Integrations
OP5 - Naemon logs
Logstash
- In Energy Logserver
naemon_beat.confset upELASTICSEARCH_HOST,ES_PORT,FILEBEAT_PORT - Copy Energy Logserver
naemon_beat.confto/etc/logstash/conf.d - Based on “FILEBEAT_PORT” if firewall is running:
sudo firewall-cmd --zone=public --permanent --add-port=FILEBEAT_PORT/tcp
sudo firewall-cmd --reload
- Based on amount of data that elasticsearch will receive you can also choose whether you want index creation to be based on moths or days:
index => "Energy Logserver-naemon-%{+YYYY.MM}"
or
index => "Energy Logserver-naemon-%{+YYYY.MM.dd}"
- Copy
naemonfile to/etc/logstash/patternsand make sure it is readable by logstash process - Restart logstash configuration e.g.:
sudo systemct restart logstash
Elasticsearch
- Connect to Elasticsearch node via SSH and Install index pattern for naemon logs. Note that if you have a default pattern covering settings section you should delete/modify that in naemon_template.sh:
  "settings": {
    "number_of_shards": 5,
    "auto_expand_replicas": "0-1"
  },
- Install template by running:
./naemon_template.sh
Energy Logserver Monitor
On Energy Logserver Monitor host install filebeat (for instance via rpm
https://www.elastic.co/downloads/beats/filebeat)In
/etc/filebeat/filebeat.ymladd:#=========================== Filebeat inputs ============================= filebeat.config.inputs: enabled: true path: configs/*.yml
You also will have to configure the output section in
filebeat.yml. You should have one logstash output:#----------------------------- Logstash output -------------------------------- output.logstash: # The Logstash hosts hosts: ["LOGSTASH_IP:FILEBEAT_PORT"]
If you have few logstash instances -
Logstashsection has to be repeated on every node andhosts:should point to all of them:hosts: ["LOGSTASH_IP:FILEBEAT_PORT", "LOGSTASH_IP:FILEBEAT_PORT", "LOGSTASH_IP:FILEBEAT_PORT" ]
Create
/etc/filebeat/configscatalog.Copy
naemon_logs.ymlto a newly created catalog.Check the newly added configuration and connection to logstash. Location of executable might vary based on os:
 /usr/share/filebeat/bin/filebeat --path.config /etc/filebeat/ test config
 /usr/share/filebeat/bin/filebeat --path.config /etc/filebeat/ test output
Restart filebeat:
 sudo systemctl restart filebeat # RHEL/CentOS 7
 sudo service filebeat restart # RHEL/CentOS 6
Elasticsearch
At this moment there should be a new index on the Elasticsearch node:
curl -XGET '127.0.0.1:9200/_cat/indices?v'
Example output:
	health status index                 uuid                   pri rep docs.count docs.deleted store.size pri.store.size
	green  open   Energy Logserver-naemon-2018.11    gO8XRsHiTNm63nI_RVCy8w   1   0      23176            0      8.3mb          8.3mb
If the index has been created, in order to browse and visualise the data, “index pattern” needs to be added in Kibana.
OP5 - Performance data
Below instruction requires that between Energy Logserver node and Elasticsearch node is working Logstash instance.
Elasticsearch
First, settings section in Energy Logservertemplate.sh should be adjusted, either:
there is a default template present on Elasticsearch that already covers shards and replicas then settings sections should be removed from the Energy Logservertemplate.sh before executing
there is no default template - shards and replicas should be adjusted for you environment (keep in mind replicas can be added later, while changing shards count on existing index requires reindexing it)
  "settings": {
    "number_of_shards": 5,
    "number_of_replicas": 0
  }
In URL Energy Logserverperfdata is a name for the template - later it can be search for or modify with it.
The “template” is an index pattern. New indices matching it will have the settings and mapping applied automatically (change it if you index name for Energy Logserver perfdata is different).
Mapping name should match documents type:
 "mappings": {
   "Energy Logserverperflogs"
Running Energy Logservertemplate.sh will create a template (not index) for Energy Logserver perf data documents.
Logstash
The Energy Logserverperflogs.conf contains example of input/filter/output configuration. It has to be copied to /etc/logstash/conf.d/. Make sure that the logstash has permissions to read the configuration files:
chmod 664 /etc/logstash/conf.d/Energy Logserverperflogs.conf
In the input section comment/uncomment “beats” or “tcp” depending on preference (beats if Filebeat will be used and tcp if NetCat). The port and the type has to be adjusted as well:
 port => PORT_NUMBER
 type => "Energy Logserverperflogs"
In a filter section type has to be changed if needed to match the input section and Elasticsearch mapping.
In an output section type should match with the rest of a config. host should point to your elasticsearch node. index name should correspond with what has been set in elasticsearch template to allow mapping application. The date for index rotation in its name is recommended and depending on the amount of data expecting to be transferred should be set to daily (+YYYY.MM.dd) or monthly (+YYYY.MM) rotation:
 hosts => ["127.0.0.1:9200"]
 index => "Energy Logserver-perflogs-%{+YYYY.MM.dd}"
Port has to be opened on a firewall:
 sudo firewall-cmd --zone=public --permanent --add-port=PORT_NUMBER/tcp
 sudo firewall-cmd --reload
Logstash has to be reloaded:
sudo systemctl restart logstash
or
sudo kill -1 LOGSTASH_PID
Energy Logserver Monitor
You have to decide wether FileBeat or NetCat will be used. In case of Filebeat - skip to the second step. Otherwise:
Comment line:
  54    open(my $logFileHandler, '>>', $hostPerfLogs) or die "Could not open $hostPerfLogs"; #FileBeat
  •	Uncomment lines:
  55 #    open(my $logFileHandler, '>', $hostPerfLogs) or die "Could not open $hostPerfLogs"; #NetCat
  ...
  88 #    my $logstashIP = "LOGSTASH_IP";
  89 #    my $logstashPORT = "LOGSTASH_PORT";
  90 #    if (-e $hostPerfLogs) {
  91 #        my $pid1 = fork();
  92 #        if ($pid1 == 0) {
  93 #            exec("/bin/cat $hostPerfLogs | /usr/bin/nc -w 30 $logstashIP $logstashPORT");
  94 #        }
  95 #    }
In process-service-perfdata-log.pl and process-host-perfdata-log.pl: change logstash IP and port:
  92 my $logstashIP = "LOGSTASH_IP";
  93 my $logstashPORT = "LOGSTASH_PORT";
In case of running single Energy Logserver node, there is no problem with the setup. In case of a peered environment $do_on_host variable has to be set up and the script process-service-perfdata-log.pl/process-host-perfdata-log.pl has to be propagated on all of Energy Logserver nodes:
 16 $do_on_host = "EXAMPLE_HOSTNAME"; # Energy Logserver node name to run the script on
 17 $hostName = hostname; # will read hostname of a node running the script
Example of command definition (/opt/monitor/etc/checkcommands.cfg) if scripts have been copied to /opt/plugins/custom/:
 # command 'process-service-perfdata-log'
 define command{
     command_name                   process-service-perfdata-log
     command_line                   /opt/plugins/custom/process-service-perfdata-log.pl $TIMET$
     }
 # command 'process-host-perfdata-log'
 define command{
     command_name                   process-host-perfdata-log
     command_line                   /opt/plugins/custom/process-host-perfdata-log.pl $TIMET$
     }
In /opt/monitor/etc/naemon.cfg service_perfdata_file_processing_command and host_perfdata_file_processing_command has to be changed to run those custom scripts:
 service_perfdata_file_processing_command=process-service-perfdata-log
 host_perfdata_file_processing_command=process-host-perfdata-log
In addition service_perfdata_file_template and host_perfdata_file_template can be changed to support sending more data to Elasticsearch. For instance, by adding $HOSTGROUPNAMES$ and $SERVICEGROUPNAMES$ macros logs can be separated better (it requires changes to Logstash filter config as well)
Restart naemon service:
 sudo systemctl restart naemon # CentOS/RHEL 7.x
 sudo service naemon restart # CentOS/RHEL 7.x
If FileBeat has been chosen, append below to filebeat.conf (adjust IP and PORT):
 filebeat.inputs:
 - type: log
   enabled: true
   paths:
     - /opt/monitor/var/service_performance.log
     - /opt/monitor/var/host_performance.log

 	tags: ["Energy Logserverperflogs"]


 output.logstash:
   # The Logstash hosts
   hosts: ["LOGSTASH_IP:LOGSTASH_PORT"]
Restart FileBeat service:
  sudo systemctl restart filebeat # CentOS/RHEL 7.x
  sudo service filebeat restart # CentOS/RHEL 7.x
Kibana
At this moment there should be new index on the Elasticsearch node with performance data documents from Energy Logserver Monitor.
Login to an Elasticsearch node and run: curl -XGET '127.0.0.1:9200/_cat/indices?v' Example output:
health status index                      pri rep docs.count docs.deleted store.size pri.store.size
green  open   auth                       5   0          7         6230      1.8mb          1.8mb
green  open   Energy Logserver-perflogs-2018.09.14    5   0      72109            0     24.7mb         24.7mb
After a while, if there is no new index make sure that:
- Naemon is runnig on Energy Logserver node
- Logstash service is running and there are no errors in: /var/log/logstash/logstash-plain.log
- Elasticsearch service is running an there are no errors in: /var/log/elasticsearch/elasticsearch.log
If the index has been created, in order to browse and visualize the data “index pattern” needs to be added to Kibana.
- After logging in to Kibana GUI go to Settings tab and add Energy Logserver-perflogs-* pattern. Chose @timestamp time field and click Create.
- Performance data logs should be now accessible from Kibana GUI Discovery tab ready to be visualize.
The Grafana instalation
To install the Grafana application you should:
add necessary repository to operating system:
  [root@logserver-6 ~]# cat /etc/yum.repos.d/grafan.repo
  [grafana]
  name=grafana
  baseurl=https://packagecloud.io/grafana/stable/el/7/$basearch
  repo_gpgcheck=1
  enabled=1
  gpgcheck=1
  gpgkey=https://packagecloud.io/gpg.key https://grafanarel.s3.amazonaws.com/RPM-GPG-KEY-grafana
  sslverify=1
  sslcacert=/etc/pki/tls/certs/ca-bundle.crt
  [root@logserver-6 ~]#
install the Grafana with following commands:
  [root@logserver-6 ~]# yum search grafana
  Loaded plugins: fastestmirror
  Loading mirror speeds from cached hostfile
   * base: ftp.man.szczecin.pl
   * extras: centos.slaskdatacenter.com
   * updates: centos.slaskdatacenter.com
  =========================================================================================================== N/S matched: grafana ===========================================================================================================
  grafana.x86_64 : Grafana
  pcp-webapp-grafana.noarch : Grafana web application for Performance Co-Pilot (PCP)

    Name and summary matches only, use "search all" for everything.

  [root@logserver-6 ~]# yum install grafana
to run application use following commands:
  [root@logserver-6 ~]# systemctl enable grafana-server
  Created symlink from /etc/systemd/system/multi-user.target.wants/grafana-server.service to /usr/lib/systemd/system/grafana-server.service.
  [root@logserver-6 ~]#
  [root@logserver-6 ~]# systemctl start grafana-server
  [root@logserver-6 ~]# systemctl status grafana-server
  ● grafana-server.service - Grafana instance
     Loaded: loaded (/usr/lib/systemd/system/grafana-server.service; enabled; vendor preset: disabled)
     Active: active (running) since Thu 2018-10-18 10:41:48 CEST; 5s ago
       Docs: http://docs.grafana.org
   Main PID: 1757 (grafana-server)
     CGroup: /system.slice/grafana-server.service
             └─1757 /usr/sbin/grafana-server --config=/etc/grafana/grafana.ini --pidfile=/var/run/grafana/grafana-server.pid cfg:default.paths.logs=/var/log/grafana cfg:default.paths.data=/var/lib/grafana cfg:default.paths.plugins=/var...

   [root@logserver-6 ~]#
To connect the Grafana application you should:
define the default login/password (line 151;154 in config file)
  [root@logserver-6 ~]# cat /etc/grafana/grafana.ini
  .....
  148 #################################### Security ####################################
  149 [security]
  150 # default admin user, created on startup
  151 admin_user = admin
  152
  153 # default admin password, can be changed before first start of grafana,  or in profile settings
  154 admin_password = admin
  155
….. - restart grafana-server service:
		[root@logserver-6 ~]# systemctl restart grafana-server

- Login to Grafana user interface using web browser: *http://ip:3000*
- use login and password that you set in the config file.
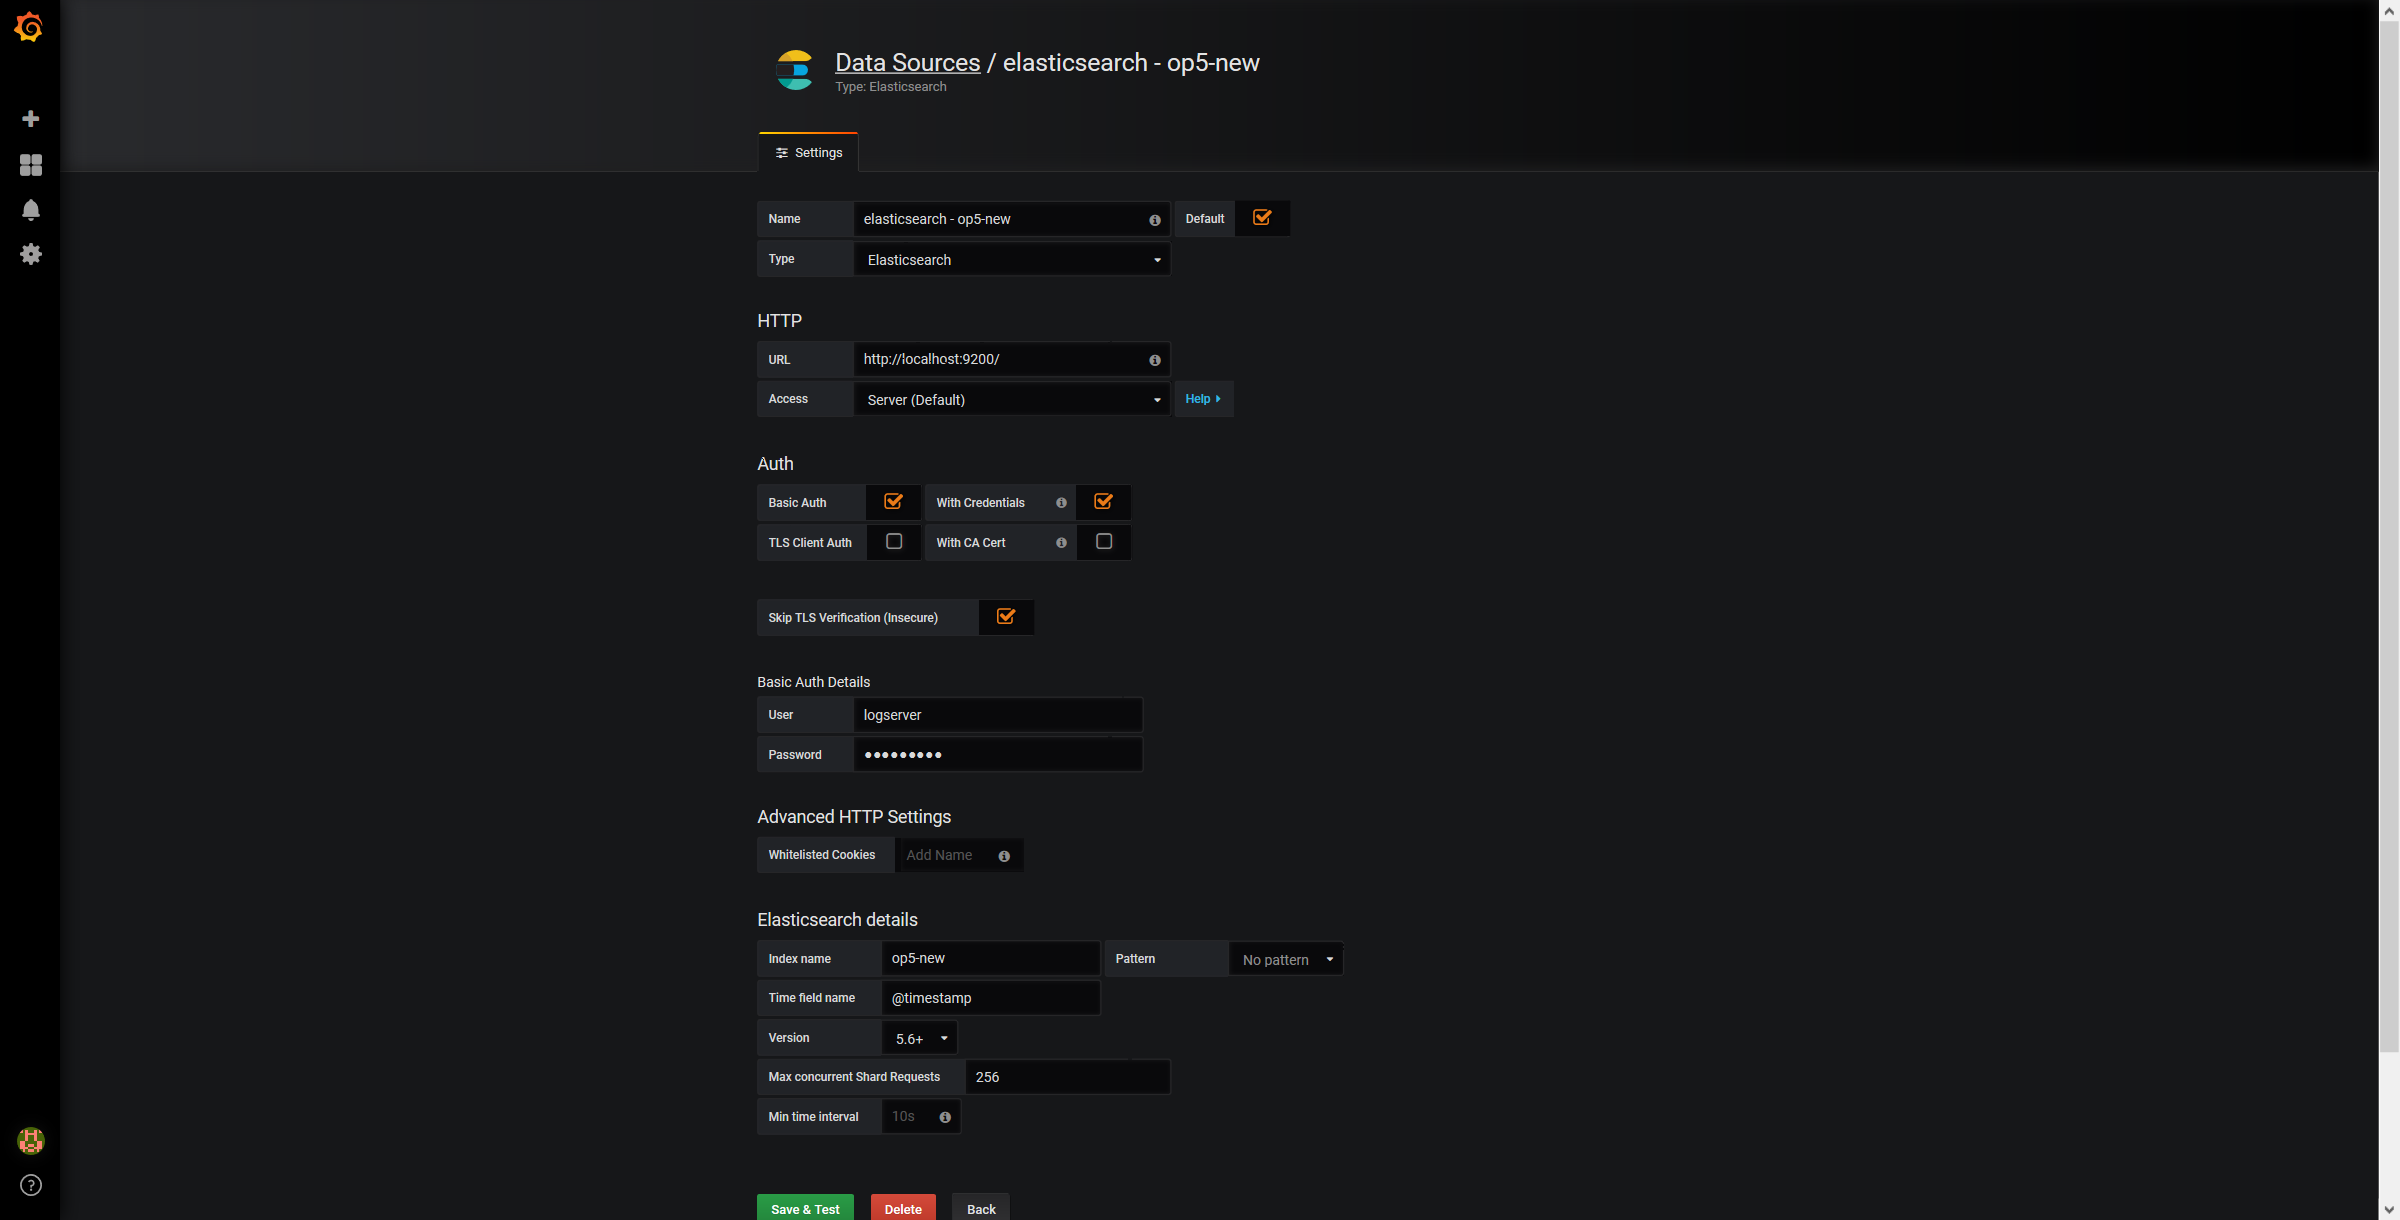
Use below example to set conection to Elasticsearch server:
The Beats configuration
Kibana API
Reference link: https://www.elastic.co/guide/en/kibana/master/api.html
After installing any of beats package you can use ready to use dashboard related to this beat package. For instance dashboard and index pattern are available in /usr/share/filebeat/kibana/6/ directory on Linux.
Before uploading index-pattern or dashboard you have to authorize yourself:
Set up login/password/kibana_ip variables, e.g.:
 login=logserver
 password=my_password
 kibana_ip=10.4.11.243
Execute command which will save authorization cookie:
curl -c authorization.txt -XPOST -k "https://${kibana_ip}:5601/login" -d "username=${username}&password=${password}&version=6.2.3&location=https%3A%2F%2F${kibana_ip}%3A5601%2Flogin"
Upload index-pattern and dashboard to Kibana, e.g.:
curl -b authorization.txt -XPOST -k "https://${kibana_ip}:5601/api/kibana/dashboards/import" -H 'kbn-xsrf: true' -H 'Content-Type: application/json' -d@/usr/share/filebeat/kibana/6/index-pattern/filebeat.json
curl -b authorization.txt -XPOST -k "https://${kibana_ip}:5601/api/kibana/dashboards/import" -H 'kbn-xsrf: true' -H 'Content-Type: application/json' -d@/usr/share/filebeat/kibana/6/dashboard/Filebeat-mysql.json
When you want to upload beats index template to Ealsticsearch you have to recover it first (usually you do not send logs directly to Es rather than to Logstash first):
/usr/bin/filebeat export template --es.version 6.2.3 >> /path/to/beats_template.json
After that you can upload it as any other template (Access Es node with SSH):
curl -XPUT "localhost:9200/_template/Energy Logserverperfdata" -H'Content-Type: application/json' -d@beats_template.json
Wazuh integration
ITRS Log Analytics can integrate with the Wazuh, which is lightweight agent is designed to perform a number of tasks with the objective of detecting threats and, when necessary, trigger automatic responses. The agent core capabilities are:
- Log and events data collection
- File and registry keys integrity monitoring
- Inventory of running processes and installed applications
- Monitoring of open ports and network configuration
- Detection of rootkits or malware artifacts
- Configuration assessment and policy monitoring
- Execution of active responses
The Wazuh agents run on many different platforms, including Windows, Linux, Mac OS X, AIX, Solaris and HP-UX. They can be configured and managed from the Wazuh server.
Deploying Wazuh Server
https://documentation.wazuh.com/current/installation-guide/installing-wazuh-server/index.html#
Deploing Wazuh Agent
https://documentation.wazuh.com/current/installation-guide/installing-wazuh-agent/index.html
Filebeat configuration
BRO integration
2FA authorization with Google Auth Provider (example)
Software used (tested versions):
- NGiNX (1.16.1 - from CentOS base reposiory)
- oauth2_proxy (https://github.com/pusher/oauth2_proxy/releases - 4.0.0)
The NGiNX configuration:
- Copy the ng_oauth2_proxy.conf to
/etc/nginx/conf.d/; - Set
ssl_certificateandssl_certificate_keypath in ng_oauth2_proxy.conf
When SSL is set using nginx proxy, Kibana can be started with http.
However, if it is to be run with encryption, you also need to change proxy_pass to the appropriate one.
The oauth2_proxy configuration:
Create a directory in which the program will be located and its configuration:
 bash
 mkdir -p /usr/share/oauth2_proxy/
 mkdir -p /etc/oauth2_proxy/
Copy files to directories:
 bash
 cp oauth2_proxy /usr/share/oauth2_proxy/
 cp oauth2_proxy.cfg /etc/oauth2_proxy/
Set directives according to OAuth configuration in Google Cloud project
 cfg
 client_id =
 client_secret =
 # the following limits domains for authorization (* - all)
 email_domains = [
   "*"
 ]
Set the following according to the public hostname:
cookie_domain = “kibana-host.org”
In case og-in restrictions for a specific group defined on the Google side:
Create administrative account: https://developers.google.com/identity/protocols/OAuth2ServiceAccount ;
Get configuration to JSON file and copy Client ID;
On the dashboard of the Google Cloud select “APIs & Auth” -> “APIs”;
Click on “Admin SDK” and “Enable API”;
Follow the instruction at https://developers.google.com/admin-sdk/directory/v1/guides/delegation#delegate_domain-wide_authority_to_your_service_account and give the service account the following permissions:
  https://www.googleapis.com/auth/admin.directory.group.readonly
  https://www.googleapis.com/auth/admin.directory.user.readonly
Follow the instructions to grant access to the Admin API https://support.google.com/a/answer/60757
Create or select an existing administrative email in the Gmail domain to flag it
google-admin-emailCreate or select an existing group to flag it
google-groupCopy the previously downloaded JSON file to
/etc/oauth2_proxy/.In file oauth2_proxy set the appropriate path:
google_service_account_json =
Service start up
Start the NGiNX service
Start the oauth2_proxy service
  bash
  /usr/share/oauth2_proxy/oauth2_proxy -config="/etc/oauth2_proxy/oauth2_proxy.cfg"
In the browser enter the address pointing to the server with the Logserver installation
Cerebro - Elasticsearch web admin tool
Software Requirements
Cerebro v0.8.4
 bash
 wget 'https://github.com/lmenezes/cerebro/releases/download/v0.8.4/cerebro-0.8.4.tgz'
Java 11+ [for basic-auth setup]
 bash
 yum install java-11-openjdk-headless.x86_64
Java 1.8.0 [without authorization]
 bash
 yum install java-1.8.0-openjdk-headless
Firewall Configuration
bash
firewall-cmd --permanent --add-port=5602/tcp
firewall-cmd --reload
Cerebro Configuration
Extract archive & move directory
 bash
 tar -xvf cerebro-0.8.4.tgz -C /opt/
 mv /opt/cerebro-0.8.4/ /opt/cerebro
Add Cerebro service user
 bash
 useradd -M -d /opt/cerebro -s /sbin/nologin cerebro
Change Cerbero permissions
 bash
 chown -R cerebro:cerebro /opt/cerebro && chmod -R 700 /opt/cerebro
Install Cerbero service (cerebro.service):
 [Unit]
 Description=Cerebro

 [Service]
 Type=simple
 User=cerebro
 Group=cerebro
 ExecStart=/opt/cerebro/bin/cerebro "-Dconfig.file=/opt/cerebro/conf/application.conf"
 Restart=always
 WorkingDirectory=/opt/cerebro

 [Install]
 WantedBy=multi-user.target


 bash
 cp cerebro.service /usr/lib/systemd/system/
 systemctl daemon-reload
 systemctl enable cerebro
Customize configuration file: /opt/cerebro/conf/application.conf
Authentication
  auth = {
    type: basic
      settings: {
        username = "logserver"
        password = "logserver"
      }
  }
A list of known Elasticsearch hosts
  hosts = [
    {
      host = "http://localhost:9200"
      name = "logserver"
      auth = {
        username = "username"
        password = "password"
      }
    }
  ]
If needed uses secure connection (SSL) with Elasticsearch, set the following section that contains path to certificate. And change the host definition from
httptohttps:play.ws.ssl { trustManager = { stores = [ { type = "PEM", path = "/etc/elasticsearch/ssl/rootCA.crt" } ] } } play.ws.ssl.loose.acceptAnyCertificate=true
SSL access to cerebro
  http = {
    port = "disabled"
  }
  https = {
    port = "5602"
  }

  # SSL access to cerebro - no self signed certificates
  #play.server.https {
  #  keyStore = {
  #    path = "keystore.jks",
  #    password = "SuperSecretKeystorePassword"
  #  }
  #}

  #play.ws.ssl {
  #  trustManager = {
  #    stores = [
  #      { type = "JKS", path = "truststore.jks", password = "SuperSecretTruststorePassword"  }
  #    ]
  #  }
  #}
Start the service
 bash
 systemctl start cerebro
 goto: https://127.0.0.1:5602
Optional configuration
Register backup/snapshot repository for Elasticsearch
 bash
 curl -k -XPUT "https://127.0.0.1:9200/_snapshot/backup?pretty" -H 'Content-Type: application/json' -d'
 {
   "type": "fs",
   "settings": {
     "location": "/var/lib/elasticsearch/backup/"
   }
 }' -u logserver:logserver
Login using curl/kibana
 bash
 curl -k -XPOST 'https://127.0.0.1:5602/auth/login' -H 'mimeType: application/x-www-form-urlencoded' -d 'user=logserver&password=logserver' -c cookie.txt
 curl -k -XGET 'https://127.0.0.1:5602' -b cookie.txt
Curator - Elasticsearch index management tool
Curator is a tool that allows you to perform index management tasks, such as:
- Close Indices
- Delete Indices
- Delete Snapshots
- Forcemerge segments
- Changing Index Settings
- Open Indices
- Reindex data
And other.
Curator installation
Curator is delivered with the client node installer.
Curator configuration
Create directory for configuration:
mkdir /etc/curator
Create directory for Curator logs file:
mkdir /var/log/curator
Running Curator
The curator executable is located in the directory:
/usr/share/kibana/curator/bin/curator
Curator requires two parameters:
- config - path to configuration file for Curator
- path to action file for Curator
Example running command:
/usr/share/kibana/curator/bin/curator --config /etc/curator/curator.conf /etc/curator/close_indices.yml
Sample configuration file
---
# Remember, leave a key empty if there is no value.  None will be a string,
# not a Python "NoneType"
client:
  hosts:
    - 127.0.0.1
  port: 9200
#  url_prefix:
#  use_ssl: False
#  certificate:
  client_cert:
  client_key:
  ssl_no_validate: False
  http_auth: $user:$passowrd
  timeout: 30
  master_only: True

logging:
  loglevel: INFO
  logfile: /var/log/curator/curator.log
  logformat: default
  blacklist: ['elasticsearch', 'urllib3']
Sample action file
close indices
actions:
  1:
    action: close
    description: >-
      Close indices older than 30 days (based on index name), for logstash-
      prefixed indices.
    options:
      delete_aliases: False
      timeout_override:
      continue_if_exception: False
      disable_action: True
    filters:
    - filtertype: pattern
      kind: prefix
      value: logstash-
      exclude:
    - filtertype: age
      source: name
      direction: older
      timestring: '%Y.%m.%d'
      unit: days
      unit_count: 30
      exclude:
delete indices
actions:
  1:
    action: delete_indices
    description: >-
      Delete indices older than 45 days (based on index name), for logstash-
      prefixed indices. Ignore the error if the filter does not result in an
      actionable list of indices (ignore_empty_list) and exit cleanly.
    options:
      ignore_empty_list: True
      timeout_override:
      continue_if_exception: False
      disable_action: True
    filters:
    - filtertype: pattern
      kind: prefix
      value: logstash-
      exclude:
    - filtertype: age
      source: name
      direction: older
      timestring: '%Y.%m.%d'
      unit: days
      unit_count: 45
      exclude:
forcemerge segments
actions:
  1:
    action: forcemerge
    description: >-
      forceMerge logstash- prefixed indices older than 2 days (based on index
      creation_date) to 2 segments per shard.  Delay 120 seconds between each
      forceMerge operation to allow the cluster to quiesce.
      This action will ignore indices already forceMerged to the same or fewer
      number of segments per shard, so the 'forcemerged' filter is unneeded.
    options:
      max_num_segments: 2
      delay: 120
      timeout_override:
      continue_if_exception: False
      disable_action: True
    filters:
    - filtertype: pattern
      kind: prefix
      value: logstash-
      exclude:
    - filtertype: age
      source: creation_date
      direction: older
      unit: days
      unit_count: 2
      exclude:
open indices
actions:
  1:
    action: open
    description: >-
      Open indices older than 30 days but younger than 60 days (based on index
      name), for logstash- prefixed indices.
    options:
      timeout_override:
      continue_if_exception: False
      disable_action: True
    filters:
    - filtertype: pattern
      kind: prefix
      value: logstash-
      exclude:
    - filtertype: age
      source: name
      direction: older
      timestring: '%Y.%m.%d'
      unit: days
      unit_count: 30
      exclude:
    - filtertype: age
      source: name
      direction: younger
      timestring: '%Y.%m.%d'
      unit: days
      unit_count: 60
      exclude:
replica reduce
actions:
  1:
    action: replicas
    description: >-
      Reduce the replica count to 0 for logstash- prefixed indices older than
      10 days (based on index creation_date)
    options:
      count: 0
      wait_for_completion: False
      timeout_override:
      continue_if_exception: False
      disable_action: True
    filters:
    - filtertype: pattern
      kind: prefix
      value: logstash-
      exclude:
    - filtertype: age
      source: creation_date
      direction: older
      unit: days
      unit_count: 10
      exclude: