User Manual
Introduction
Energy Logserver is innovation solution allowing for centralize IT systems events. It allows for an immediately review, analyze and reporting of system logs - the amount of data does not matter. Energy Logserver is a response to the huge demand for storage and analysis of the large amounts of data from IT systems. Energy Logserver is innovation solution that responds to the need of effectively processing large amounts of data coming from IT environments of today’s organizations. Based on the open-source project Elasticsearch valued on the marked, we have created an efficient solution with powerful data storage and searching capabilities. The System has been enriched of functionality that ensures the security of stored information, verification of users, data correlation and visualization, alerting and reporting.
Energy Logserver project was created to centralize events of all IT areas in the organization. We focused on creating a tool that functionality is most expected by IT departments. Because an effective licensing model has been applied, the solution can be implemented in the scope expected by the customer even with very large volume of data. At the same time, the innovation architecture allows for servicing a large portion of data, which cannot be dedicated to solution with limited scalability.
Elasticsearch
Elasticsearch is a NoSQL database solution that is the heart of our system. Text information send to the system, application and system logs are processed by Logstash filters and directed to Elasticsearch. This storage environment creates, based on the received data, their respective layout in a binary form, called a data index. The Index is kept on Elasticsearch nodes, implementing the appropriate assumptions from the configuration, such as:
- Replication index between nodes,
- Distribution index between nodes.
The Elasticsearch environment consists of nodes:
- Data node - responsible for storing documents in indexes,
- Master node - responsible for the supervisions of nodes,
- Client node - responsible for cooperation with the client.
Data, Master and Client elements are found even in the smallest Elasticsearch installations, therefore often the environment is referred to as a cluster, regardless of the number of nodes configured. Within the cluster, Elasticsearch decides which data portions are held on a specific node.
Index layout, their name, set of fields is arbitrary and depends on the form of system usage. It is common practice to put data of a similar nature to the same type of index that has a permanent first part of the name. The second part of the name often remains the date the index was created, which in practice means that the new index is created every day. This practice, however, is conventional and every index can have its own rotation convention, name convention, construction scheme and its own set of other features. As a result of passing document through the Logstash engine, each entry receive a data field, which allow to work witch data in relations to time.
The Indexes are built with elementary part called shards. It is good practice to create Indexes with the number of shards that is the multiple of the Elasticsearch data nodes number. Elasticsearch in 7.x version has a new feature called Sequence IDs that guarantee more successful and efficient shard recovery.
Elasticsearch use the mapping to describes the fields or properties that documents of that type may have. Elasticsearch in 7.x version restrict indices to a single type.
Kibana
Kibana lets you visualize your Elasticsearch data and navigate the Elastic Stack. Kibana gives you the freedom to select the way you give shape to your data. And you don’t always have to know what you’re looking for. Kibana core ships with the classics: histograms, line graphs, pie charts, sunbursts, and more. Plus, you can use Vega grammar to design your own visualizations. All leverage the full aggregation capabilities of Elasticsearch. Perform advanced time series analysis on your Elasticsearch data with our curated time series UIs. Describe queries, transformations, and visualizations with powerful, easy-to-learn expressions. Kibana 7.x has two new feature - a new “Full-screen” mode to viewing dashboards, and new the “Dashboard-only” mode which enables administrators to share dashboards safely.
Logstash
Logstash is an open source data collection engine with real-time pipelining capabilities. Logstash can dynamically unify data from disparate sources and normalize the data into destinations of your choice. Cleanse and democratize all your data for diverse advanced downstream analytics and visualization use cases.
While Logstash originally drove innovation in log collection, its capabilities extend well beyond that use case. Any type of event can be enriched and transformed with a broad array of input, filter, and output plugins, with many native codecs further simplifying the ingestion process. Logstash accelerates your insights by harnessing a greater volume and variety of data.
Logstash 7.x version supports native support for multiple pipelines. These pipelines are defined in a pipelines.yml file which is loaded by default. Users will be able to manage multiple pipelines within Kibana. This solution uses Elasticsearch to store pipeline configurations and allows for on-the-fly reconfiguration of Logstash pipelines.
ELK
“ELK” is the acronym for three open source projects: Elasticsearch, Logstash, and Kibana. Elasticsearch is a search and analytics engine. Logstash is a server‑side data processing pipeline that ingests data from multiple sources simultaneously, transforms it, and then sends it to a “stash” like Elasticsearch. Kibana lets users visualize data with charts and graphs in Elasticsearch. The Elastic Stack is the next evolution of the ELK Stack.
Data source
Where does the data come from?
Energy Logserver is a solution allowing effective data processing from the IT environment that exists in the organization.
The Elsasticsearch engine allows building a database in witch large amounts of data are stored in ordered indexes. The Logstash module is responsible for load data into Indexes, whose function is to collect data on specific tcp/udp ports, filter them, normalize them and place them in the appropriate index. Additional plugins, that we can use in Logstash reinforce the work of the module, increase its efficiency, enabling the module to quick interpret data and parse it.
Below is an example of several of the many available Logstash plugins:
exec - receive output of the shell function as an event;
imap - read email from IMAP servers;
jdbc - create events based on JDC data;
jms - create events from Jms broker;
Both Elasticsearch and Logstash are free Open-Source solutions.
More information about Elasticsearch module can be find at: https://github.com/elastic/elasticsearch
List of available Logstash plugins: https://github.com/elastic/logstash-docs/tree/master/docs/plugins
System services
For proper operation Energy Logserver requires starting the following system services:
- elasticsearch.service - we can run it with a command:
systemctl start elasticsearch.service
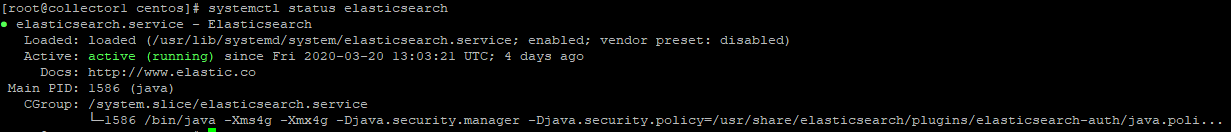
we can check its status with a command:
systemctl status elasticsearch.service
- kibana.service - we can run it with a command:
systemctl start kibana.service
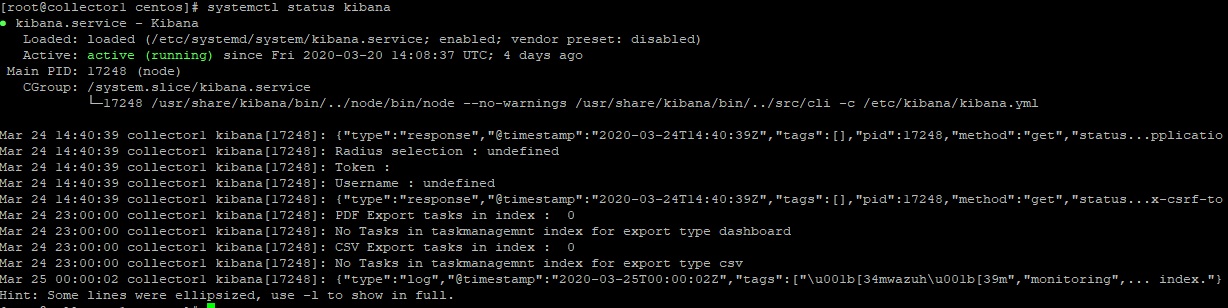
we can check its status with a command:
systemctl status kibana.service
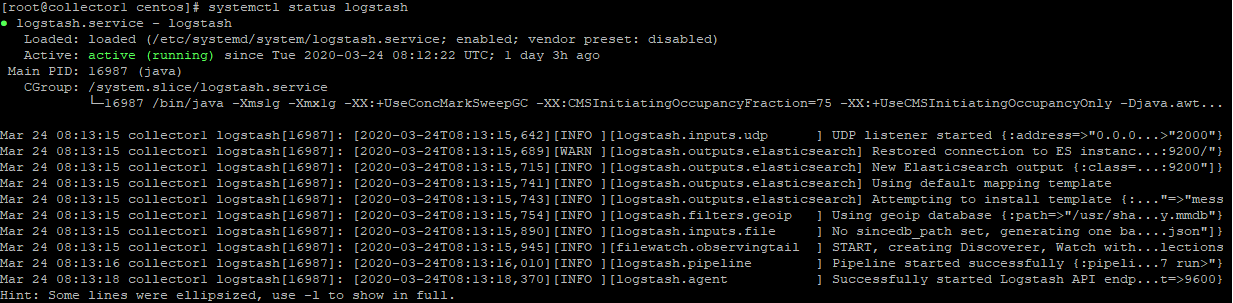
logstash.service - we can run it with a command:
systemctl start logstash.service
we can check its status with a command:
systemctl status logstash.service
First login
If you log in to Energy Logserver for the first time, you must specify the Index to be searched. We have the option of entering the name of your index, indicate a specific index from a given day, or using the asterix (*) to indicate all of them matching a specific index pattern. Therefore, to start working with Energy Logserver application, we log in to it (by default the user: logserver/password:logserver).
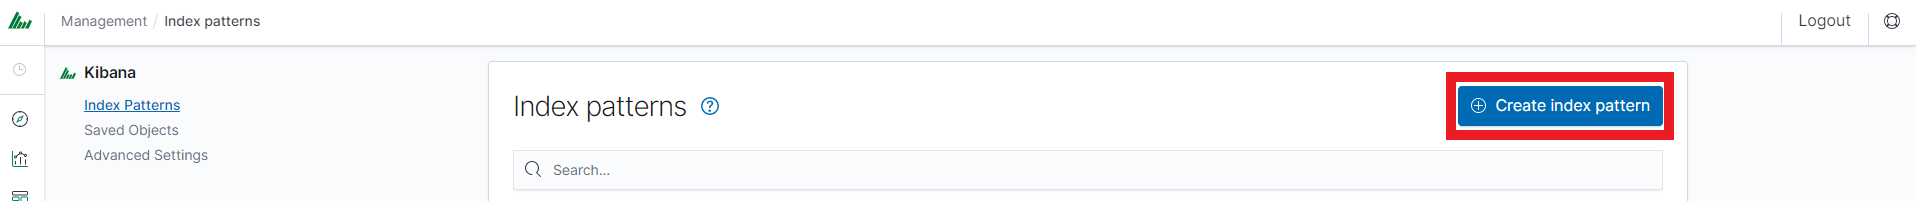
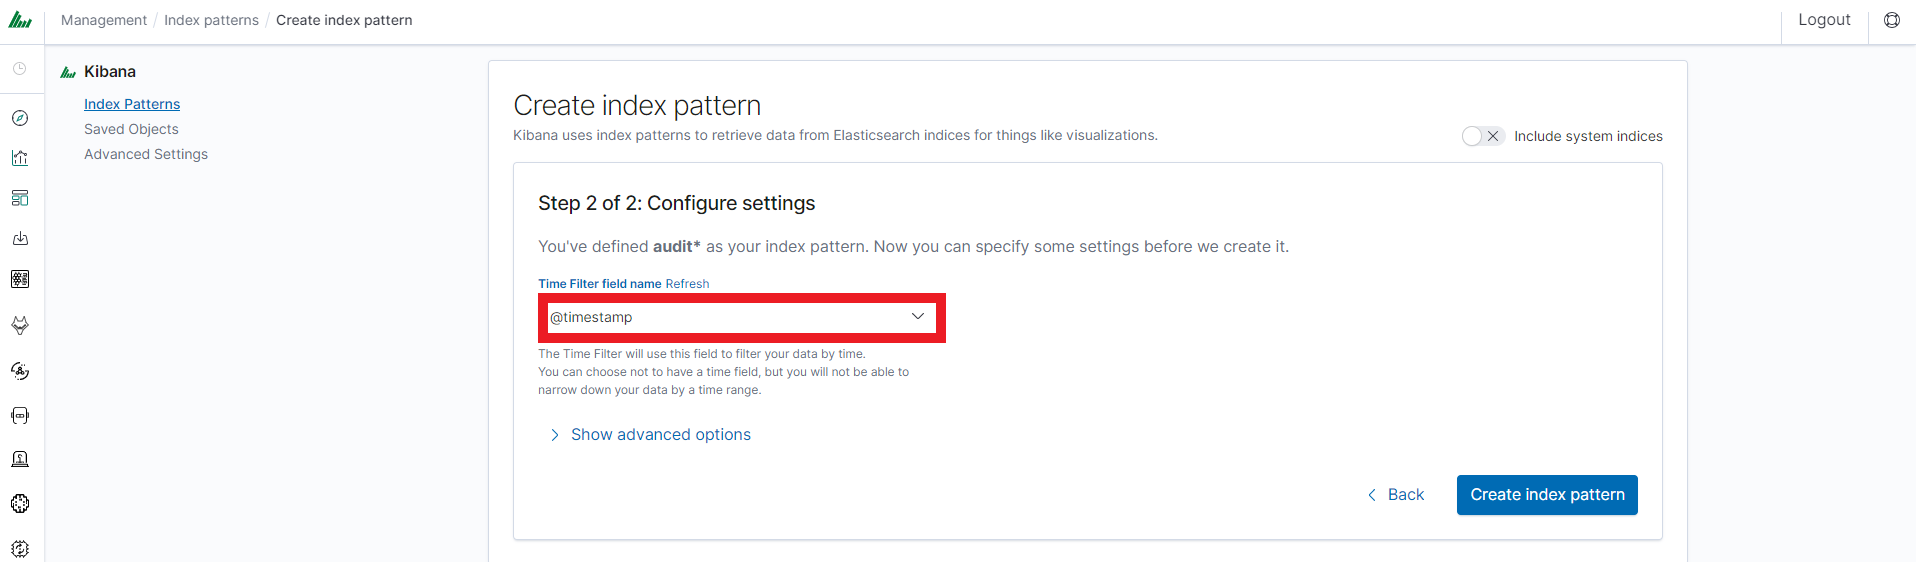
After logging in to the application click the button “Set up index pattern” to add new index patter in Kibana:
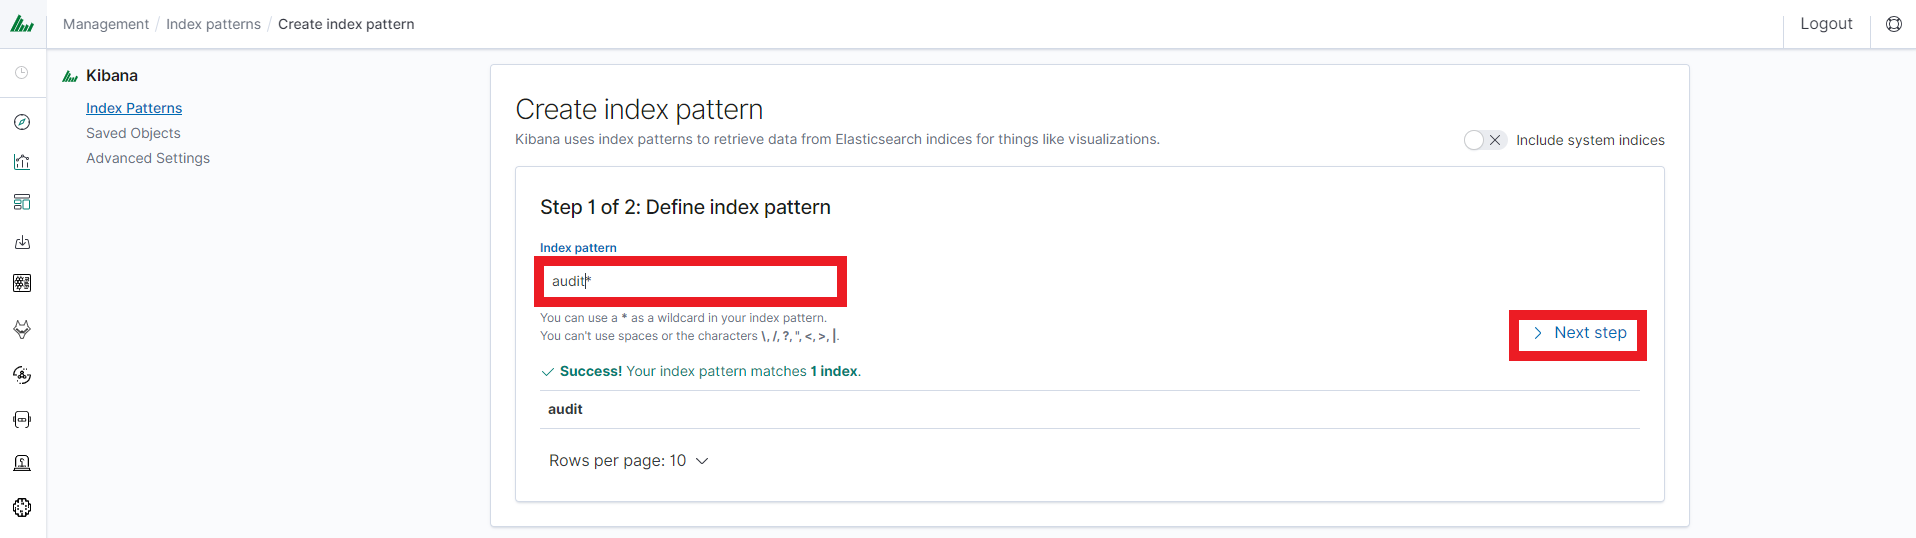
In the “Index pattern” field enter the name of the index or index pattern (after confirming that the index or sets of indexes exists) and click “Next step” button.
In the next step, from drop down menu select the “Time filter field name”, after witch individual event (events) should be sorter. By default the timestamp is set, which is the time of occurrence of the event, but depending of the preferences. It may also be the time of the indexing or other selected based on the fields indicate on the event.
At any time, you can add more indexes or index patters by going to the main tab select „Management” and next select „Index Patterns”.
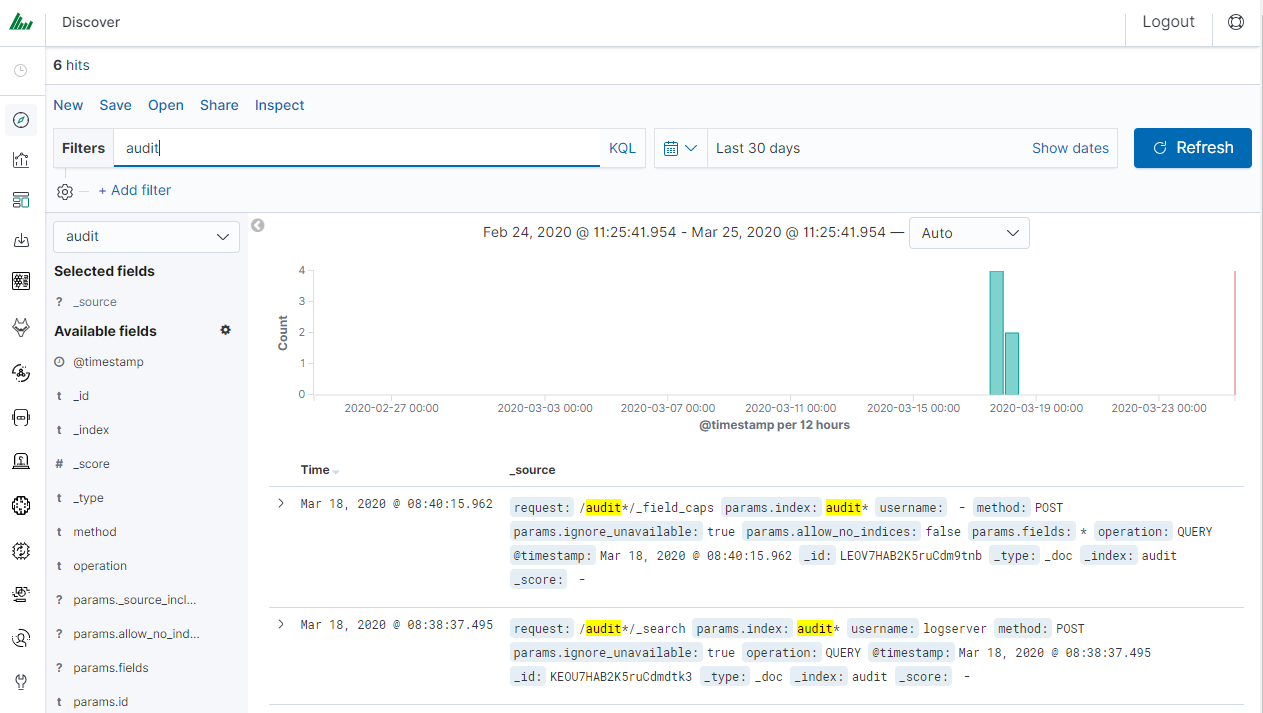
Index selection
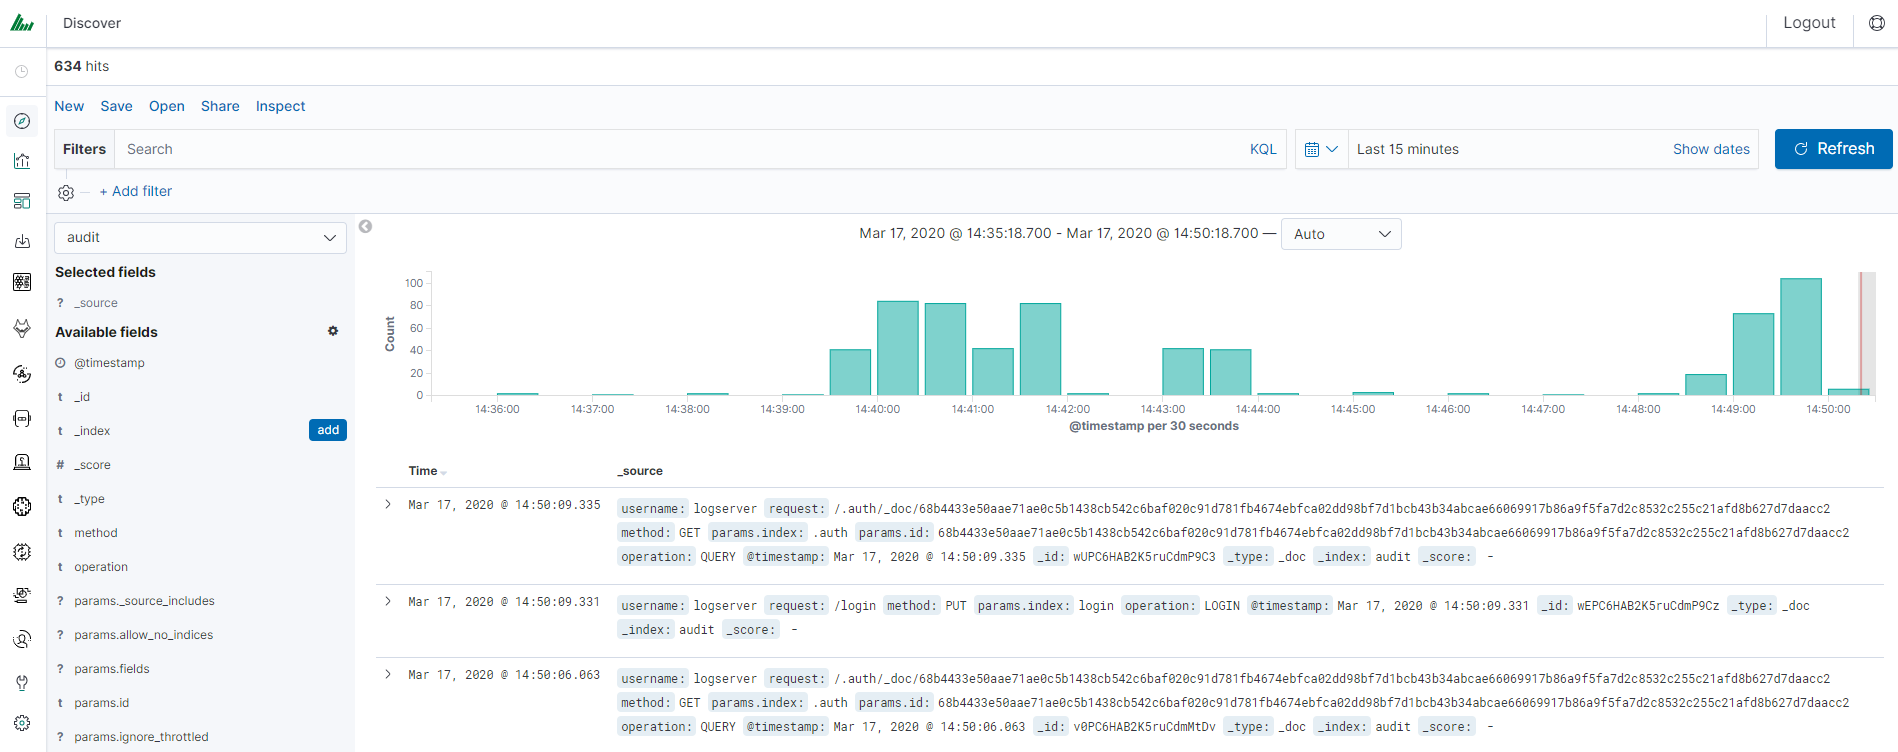
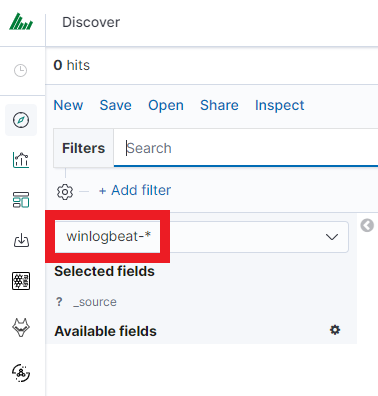
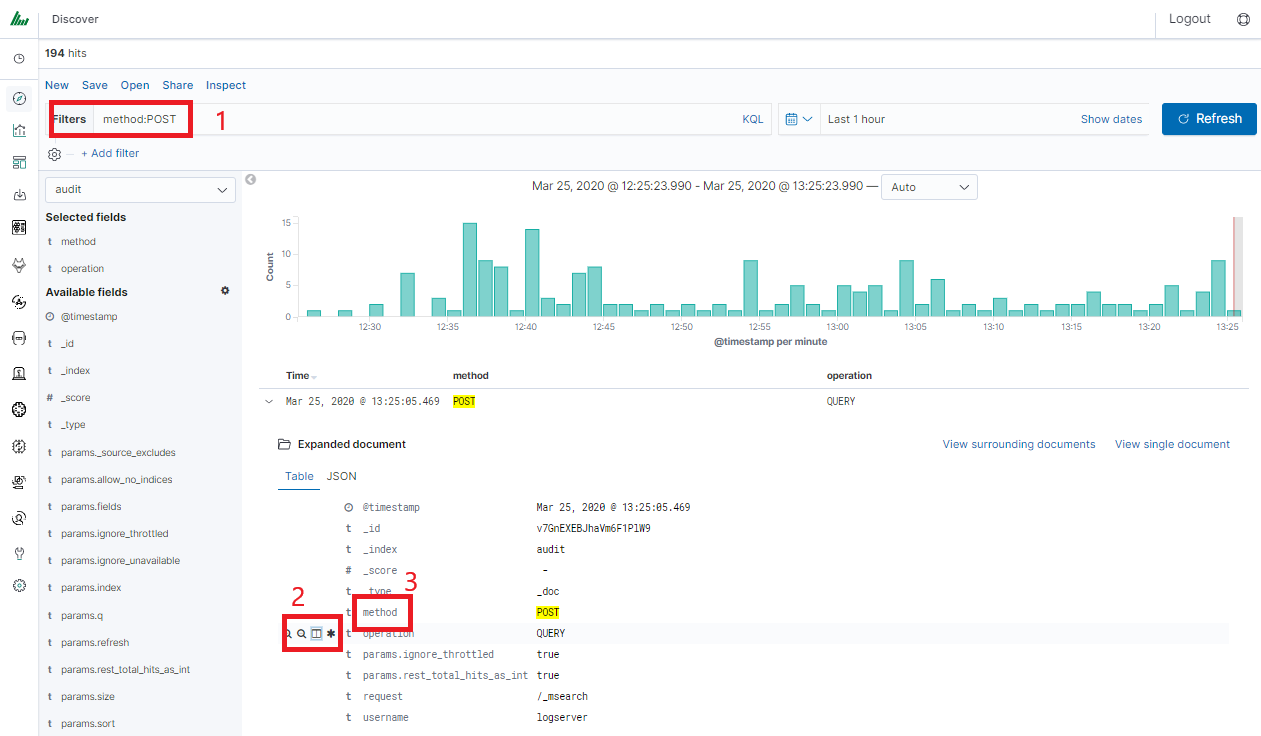
After login into Energy Logserver you will going to „Discover” tab, where you can interactively explore your data. You have access to every document in every index that matches the selected index patterns.
If you want to change selected index, drop down menu with the name of the current object in the left panel. Clicking on the object from the expanded list of previously create index patterns, will change the searched index.
Index rollover
Using the rollover function, you can make changes to removing documents from the audit, .agents, alert* indexes.
You can configure the rollover by going to the Config module, then clicking the Settings tab, go to the Index rollover settings section and select click Configure button:
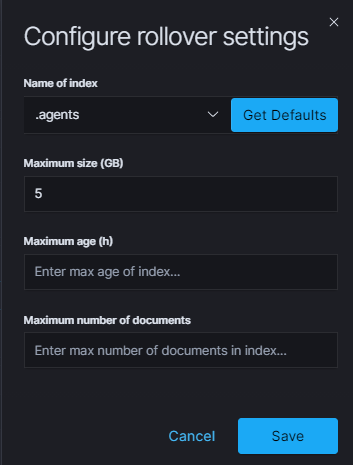
You can set the following retention parameters for the above indexes:
- Maximum size (GB);
- Maximum age (h);
- Maximum number of documents.
Discovery
Time settings and refresh
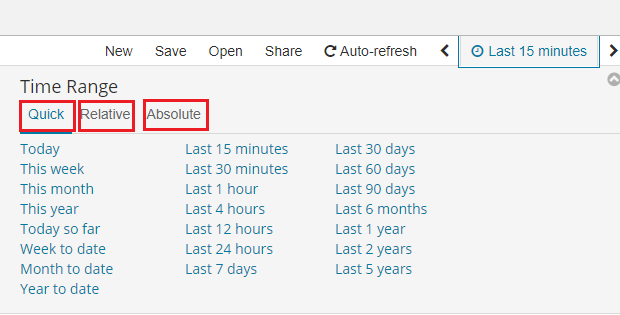
In the upper right corner there is a section in which it defines the range of time that Energy Logserver will search in terms of conditions contained in the search bar. The default value is the last 15 minutes.
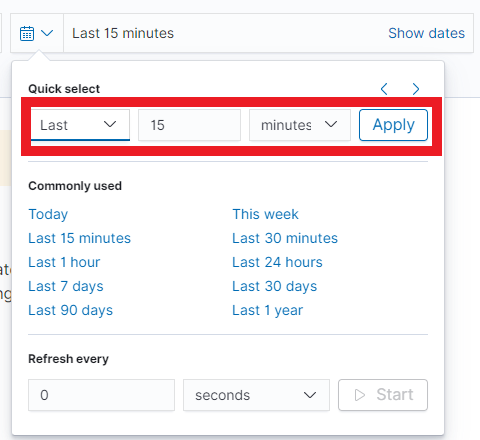
After clicking this selection, we can adjust the scope of search by selecting one of the three tabs in the drop-down window:
- Quick: contain several predefined ranges that should be clicked.
- Relative: in this windows specify the day from which Energy Logserver should search for data.
- Absolute: using two calendars we define the time range for which the search results are to be returned.
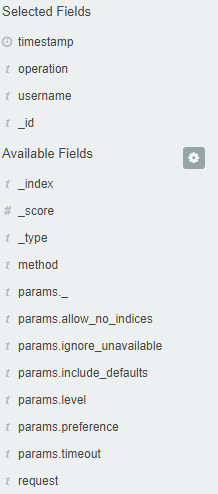
Fields
Energy Logserver in the body of searched events, it recognize fields
that can be used to created more precision queries. The extracted
fields are visible in the left panel. They are divided on three types:
timestamp, marked on clock icon
 ; text, marked with the letter “t”
 and digital, marked witch hashtag
 .
.
Pointing to them and clicking on icon
 , they are automatically transferred to
the „Selected Fields” column and in the place of events a table with
selected columns is created on regular basis. In the “Selected Fields”
selection you can also delete specific fields from the table by clicking
, they are automatically transferred to
the „Selected Fields” column and in the place of events a table with
selected columns is created on regular basis. In the “Selected Fields”
selection you can also delete specific fields from the table by clicking
 on the selected element.
Filtering and syntax building
We use the query bar to search interesting events. For example, after entering the word „error”, all events that contain the word will be displayed, additional highlighting them with an yellow background.
Syntax
Fields can be used in the similar way by defining conditions that interesting us. The syntax of such queries is:
<fields_name:<fields_value>
Example:
status:500
This query will display all events that contain the „status” fields with a value of 500.
Filters
The field value does not have to be a single, specific value. For digital fields we can specify range in the following scheme:
<fields_name:[<range_from TO <range_to]
Example:
status:[500 TO 599]
This query will return events with status fields that are in the range 500 to 599.
Operators
The search language used in Energy Logserver allows to you use logical operators „AND”, „OR” and „NOT”, which are key and necessary to build more complex queries.
- AND is used to combined expressions, e.g. „error AND „access denied”. If an event contain only one expression or the words error and denied but not the word access, then it will not be displayed.
- OR is used to search for the events that contain one OR other expression, e.g. „status:500” OR “denied”. This query will display events that contain word „denied” or status field value of 500. Energy Logserver uses this operator by default, so query „status:500” “denied” would return the same results.
- NOT is used to exclude the following expression e.g. „status:[500 TO 599] NOT status:505” will display all events that have a status fields, and the value of the field is between 500 and 599 but will eliminate from the result events whose status field value is exactly 505.
- The above methods can be combined with each other by building even more complex queries. Understanding how they work and joining it, is the basis for effective searching and full use of Energy Logserver.
Example of query built from connected logical operations:
status:[500 TO 599] AND („access denied" OR error) NOT status:505
Returns in the results all events for which the value of status fields are in the range of 500 to 599, simultaneously contain the word „access denied” or „error”, omitting those events for which the status field value is 505.
Saving and deleting queries
Saving queries enables you to reload and use them in the future.
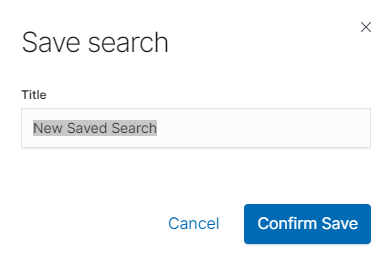
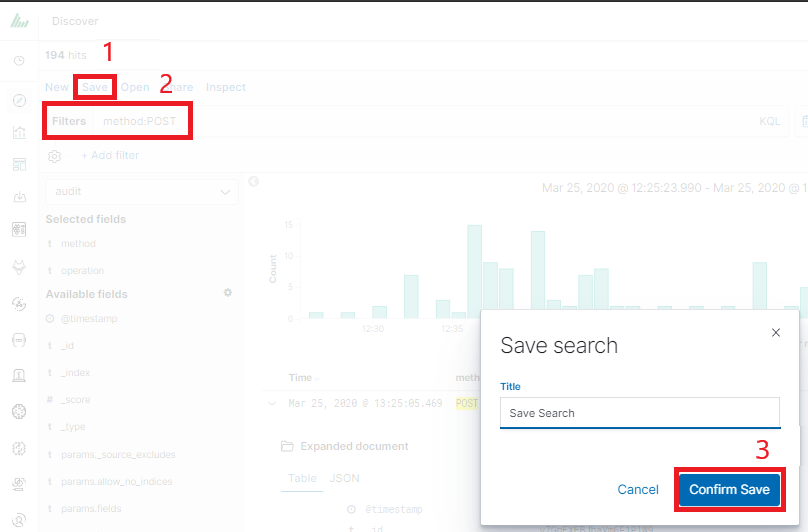
Save query
To save query, click on the “Save” button under on the query bar:

This will bring up a window in which we give the query a name and then
click the button  .
.
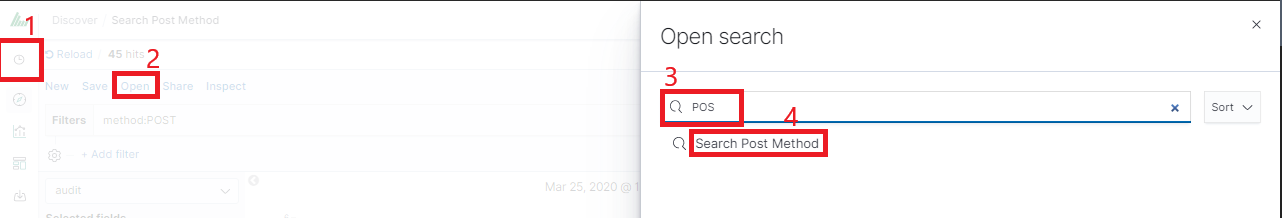
Saved queries can be opened by going to „Open” from the main menu at the top of the page, and select saved search from the search list:
Additional you can use “Saved Searchers Filter..” to filter the search list.
Open query
To open a saved query from the search list, you can click on the name of the query you are interested in.
After clicking on the icon
 on the name of the saved query and chose
“Edit Query DSL”, we will gain access to the advanced editing mode,
so that we can change the query on at a lower level.
on the name of the saved query and chose
“Edit Query DSL”, we will gain access to the advanced editing mode,
so that we can change the query on at a lower level.
It is a powerful tool designed for advanced users, designed to modify the query and the way it is presented by Energy Logserver.
Delete query
To delete a saved query, open it from the search list, and
then click on the button  .
.
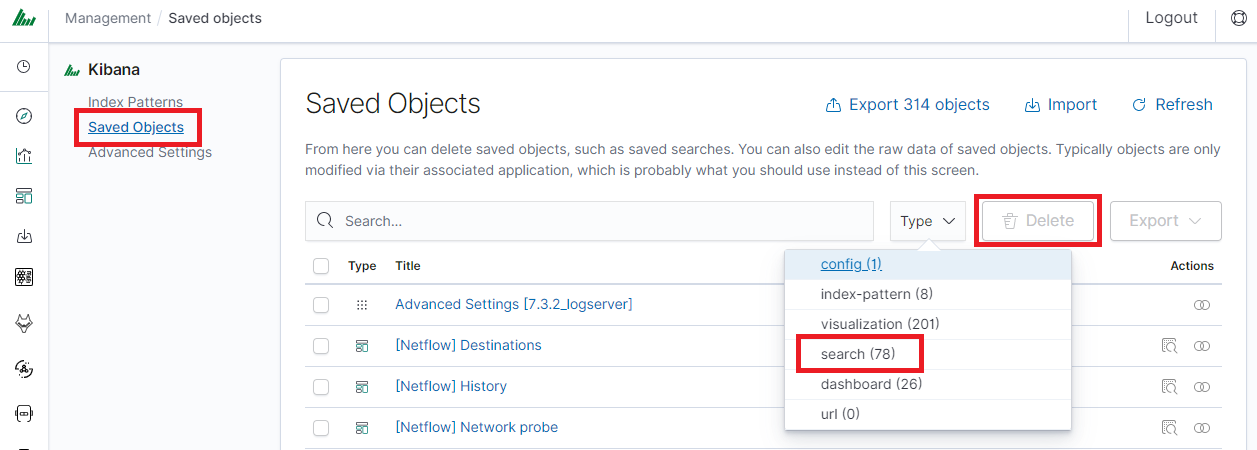
If you want delete many saved queries simultaneously go to the “Management Object”
-> “Saved Object” -> “Searches” select it in the list (the icon  to the left of the query name), and then click “Delete” button.
From this level, you can also export saved queries in the same way. To
do this, you need to click on
 and choose the save location. The file
will be saved in .JSON format. If you then want to import such a file to
Energy Logserver, click on button
and choose the save location. The file
will be saved in .JSON format. If you then want to import such a file to
Energy Logserver, click on button
 , at the top of the page and select the
desired file.
, at the top of the page and select the
desired file.
Manual incident
The Discovery module allows you to manually create incidents that are saved in the Incidents tab of the Alerts module. Manual incidents are based on search results or filtering.
For a manual incident, you can save the following parameters:
- Rule name
- Time
- Risk
- Message
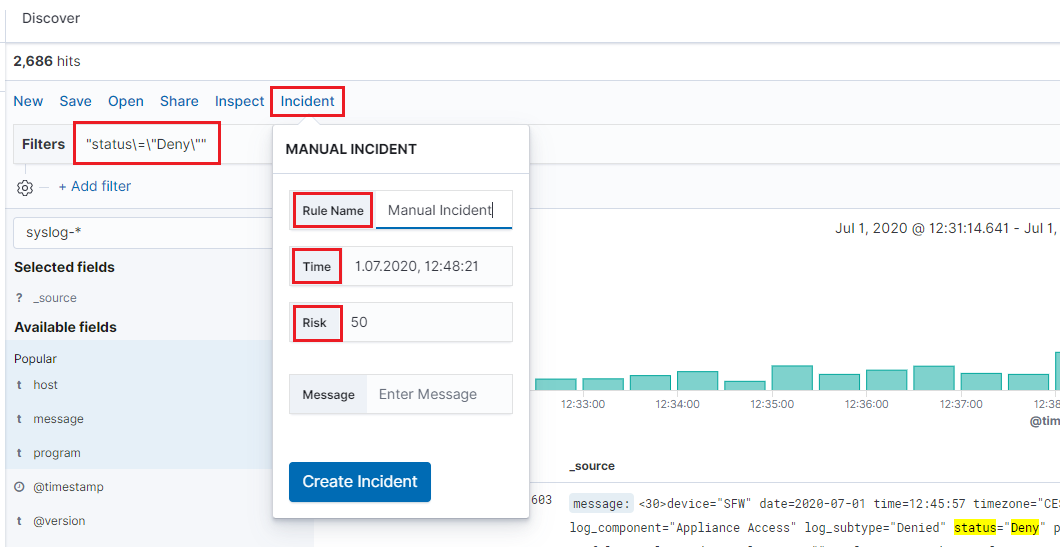
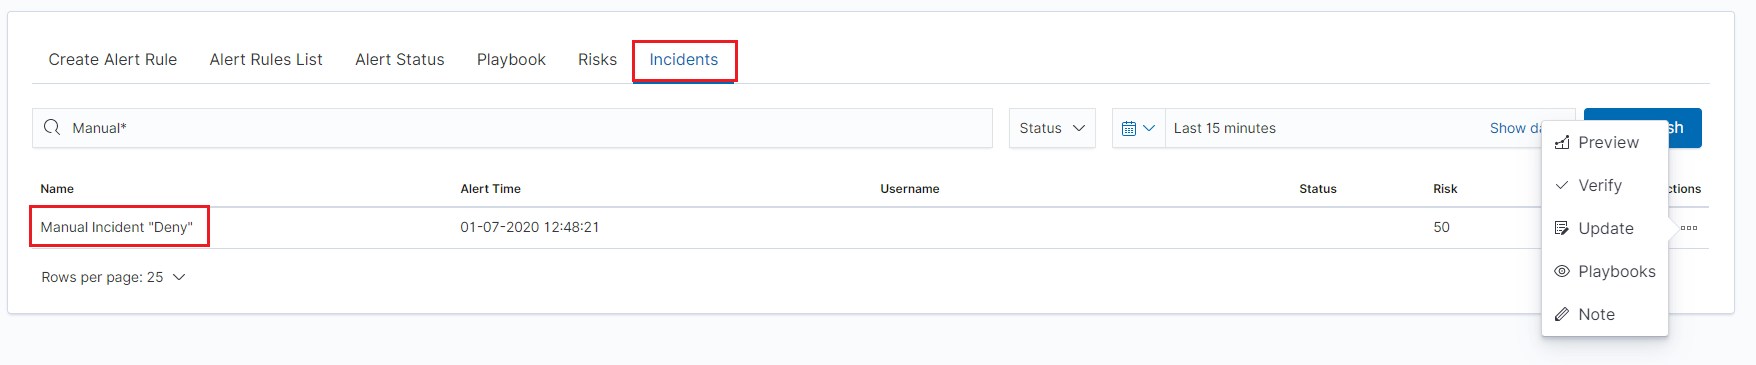
After saving the manual incident, you can go to the Incident tab in the Alert module to perform the incident handling procedure.
Change the default width of columns
To improve the readability of values in Discovery columns, you can set a minimum column width. The column width setting is in the CSS style files:
/usr/share/kibana/built_assets/css/plugins/kibana/index.dark.css
/usr/share/kibana/built_assets/css/plugins/kibana/index.light.css
To set the minimum width for the columns, e.g. 150px, add the following entry min-width: 150px in the CSS style files:
.kbnDocTableCell__dataField
   min-width: 150px;
   white-space: pre-wrap; }
Visualizations
Visualize enables you to create visualizations of the data in your Energy Logserver indices. You can then build dashboards that display related visualizations. Visualizations are based on Energy Logserver queries. By using a series of Energy Logserver aggregations to extract and process your data, you can create charts that show you the trends, spikes, and dips.
Creating visualization
Create
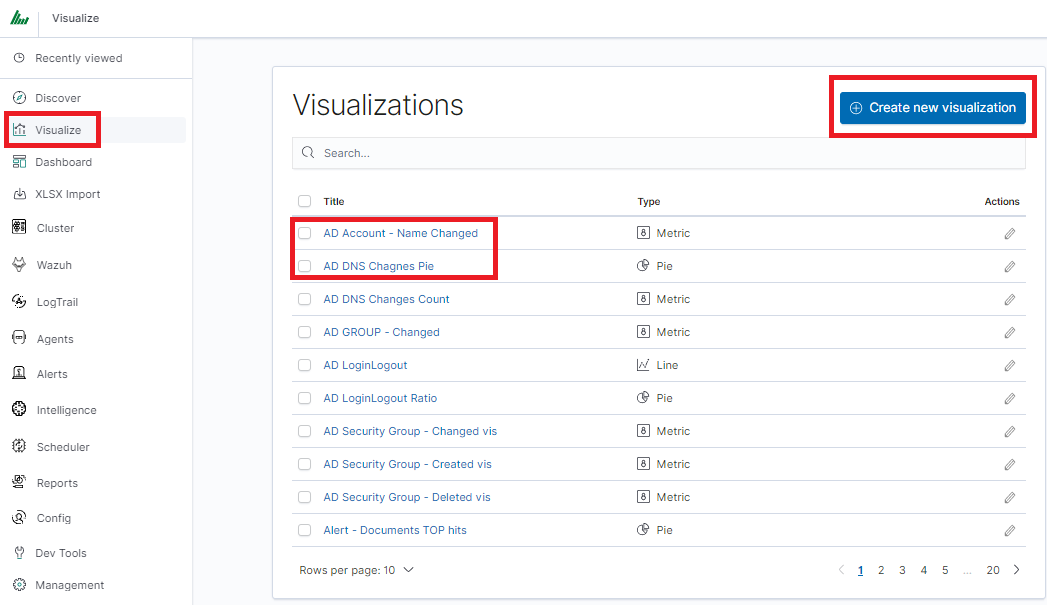
To create visualization, go to the „Visualize” tab from the main menu. A new page will be appearing where you can create or load visualization.
Load
To load previously created and saved visualization, you must select it from the list.
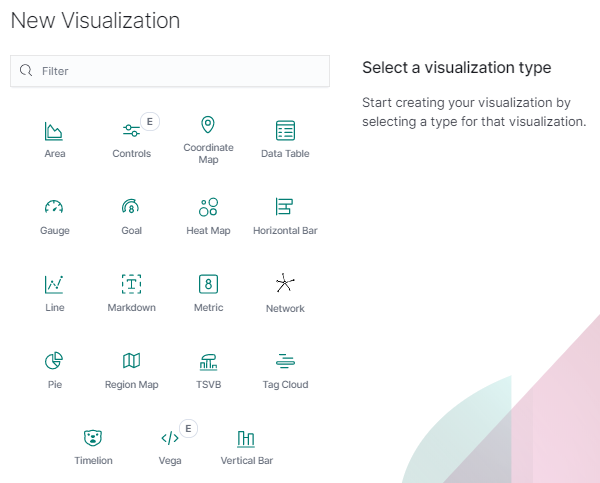
In order to create a new visualization, you should choose the preferred method of data presentation.
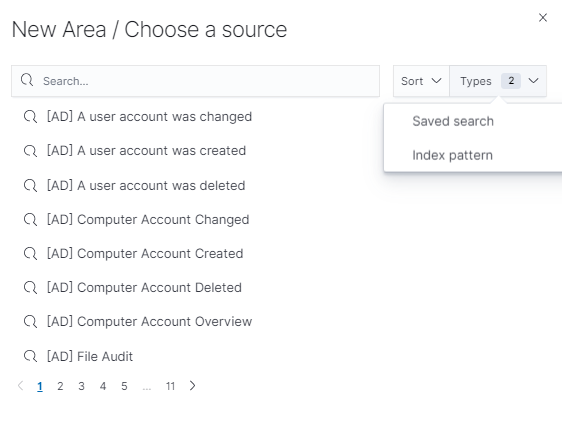
Next, specify whether the created visualization will be based on a new or previously saved query. If on new one, select the index whose visualization should concern. If visualization is created from a saved query, you just need to select the appropriate query from the list, or (if there are many saved searches) search for them by name.
Vizualization types
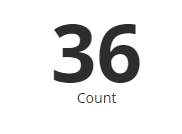
Before the data visualization will be created, first you have to choose the presentation method from an existing list. Currently there are five groups of visualization types. Each of them serves different purposes. If you want to see only the current number of products sold, it is best to choose „Metric”, which presents one value.
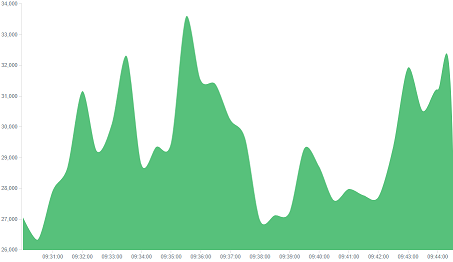
However, if we would like to see user activity trends on pages in different hour and days, a better choice will be „Area chart”, which displays a chart with time division.
The „Markdown widget” views is used to place text e.g. information about the dashboard, explanations and instruction on how to navigate. Markdown language was used to format the text (the most popular use is GitHub). More information and instruction can be found at this link: https://help.github.com/categories/writing-on-github/
Edit visualization and saving
Edititing
Editing a saved visualization enables you to directly modify the object definition. You can change the object title, add a description, and modify the JSON that defines the object properties. After selecting the index and the method of data presentation, you can enter the editing mode. This will open a new window with empty visualization.
At the very top there is a bar of queries that cat be edited throughout the creation of the visualization. It work in the same way as in the “Discover” tab, which means searching the raw data, but instead of the data being displayed, the visualization will be edited. The following example will be based on the „Area chart”. The visualization modification panel on the left is divided into three tabs: „Data”, “Metric & Axes” and „Panel Settings”.
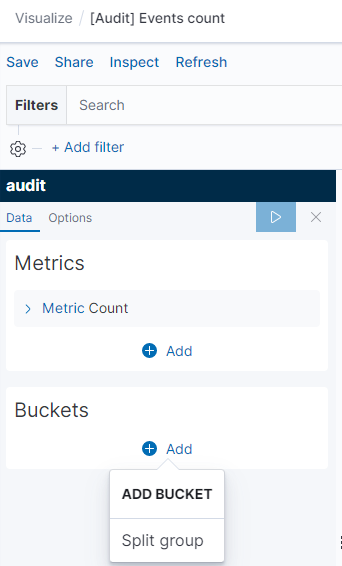
In the „Data” tab, you can modify the elements responsible for which data and how should be presented. In this tab there are two sectors: “metrics”, in which we set what data should be displayed, and „buckets” in which we specify how they should be presented.
Select the Metrics & Axes tab to change the way each individual metric is shown on the chart. The data series are styled in the Metrics section, while the axes are styled in the X and Y axis sections.
In the „Panel Settings” tab, there are settings relating mainly to visual aesthetics. Each type of visualization has separate options.
To create the first graph in the char modification panel, in the „Data” tab we add X-Axis in the “buckets” sections. In „Aggregation” choose „Histogram”, in „Field” should automatically be located “timestamp” and “interval”: “Auto” (if not, this is how we set it). Click on the icon on the panel. Now our first graph should show up.
Some of the options for „Area Chart” are:
Smooth Lines - is used to smooth the graph line.
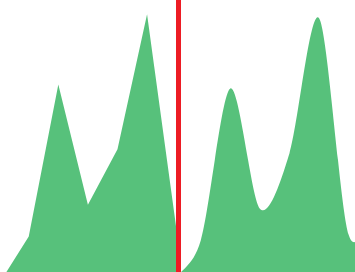
Current time marker – places a vertical line on the graph that determines the current time.
Set Y-Axis Extents – allows you to set minimum and maximum values for the Y axis, which increases the readability of the graphs. This is useful, if we know that the data will never be less then (the minimum value), or to indicate the goals the company (maximum value).
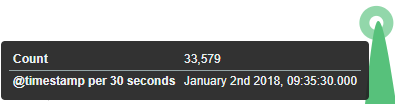
Show Tooltip – option for displaying the information window under the mouse cursor, after pointing to the point on the graph.
Saving
To save the visualization, click on the “Save” button under on the query bar:
give it a name and click the button
.
Load
To load the visualization, go to the “Management Object”
-> “Saved Object” -> “Visualizations” select it from the list. From this place,
we can also go into advanced editing mode. To view of the visualization
use  button.
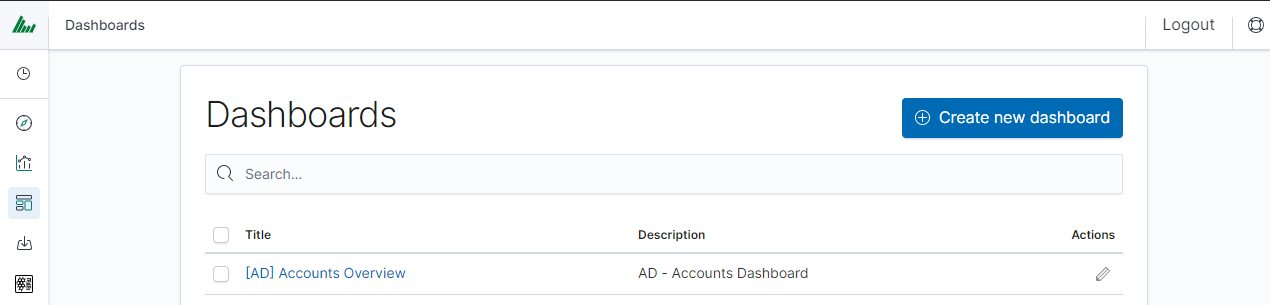
Dashboards
Dashboard is a collection of several visualizations or searches. Depending on how it is build and what visualization it contains, it can be designed for different teams e.g.:
- SOC - which is responsible for detecting failures or threats in the company;
- business - which thanks to the listings can determine the popularity of products and define the strategy of future sales and promotions;
- managers and directors - who may immediately have access to information about the performance units or branches.
Create
To create a dashboard from previously saved visualization and queries, go to the „Dashboard” tab in the main menu. When you open it, a new page will appear.
Clicking on the icon “Add” at the top of page select “Visualization” or “Saved Search” tab.
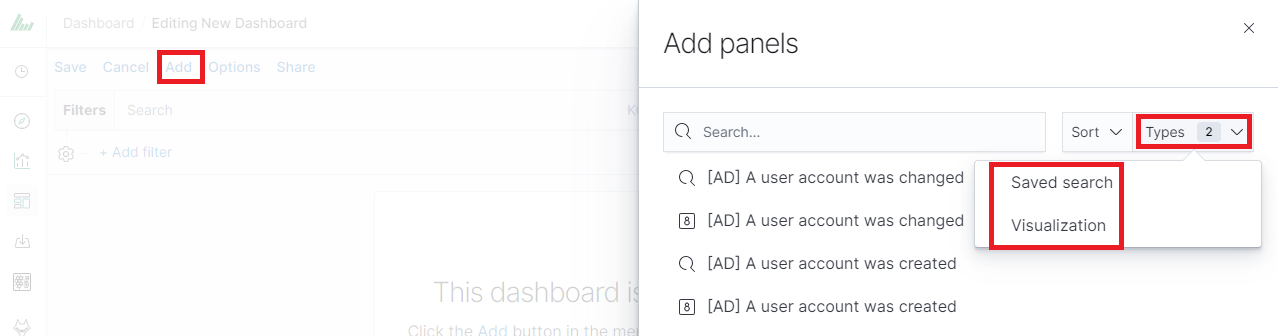
and selecting a saved query and / or visualization from the list will add them to the dashboard. If, there are a large number of saved objects, use the bar to search for them by name.
Elements of the dashboard can be enlarged arbitrarily (by clicking on the right bottom corner of object and dragging the border) and moving (by clicking on the title bar of the object and moving it).
Saving
You may change the time period of your dashboard.
At the upper right hand corner, you may choose the time range of your dashboard.
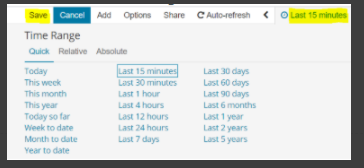
Click save and choose the ‘Store time with dashboard’ if you are editing an existing dashboard. Otherwise, you may choose ‘Save as a new dashboard’ to create a new dashboard with the new time range.
To save a dashboard, click on the “Save” button to the up of the query bar and give it a name.
Load
To load the Dashboard, go to the “Management Object”
-> “Saved Object” -> “Dashborad” select it from the list. From this place,
we can also go into advanced editing mode. To view of the visualization
use  button.
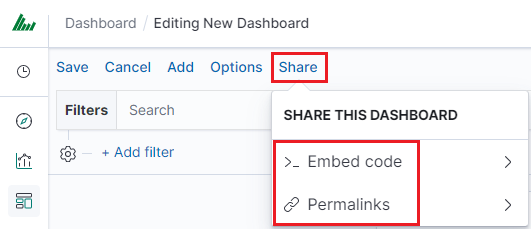
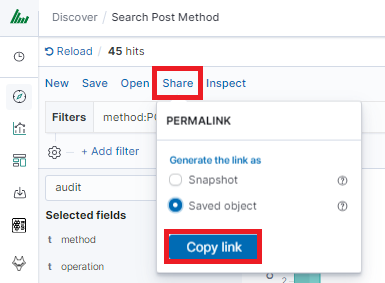
Sharing dashboards
The dashboard can be share with other Energy Logserver users as well as on any page - by placing a snippet of code. Provided that it cans retrieve information from Energy Logserver.
To do this, create new dashboard or open the saved dashboard and click on the “Share” to the top of the page. A window will appear with generated two URL. The content of the first one “Embaded iframe” is used to provide the dashboard in the page code, and the second “Link” is a link that can be passed on to another user. There are two option for each, the first is to shorten the length of the link, and second on copies to clipboard the contest of the given bar.
Dashboard drilldown
In discovery tab search for message of Your interest
Save Your search
Check You „Shared link” and copy it
! ATTENTION ! Do not copy „?_g=()” at the end.
Select Alerting module
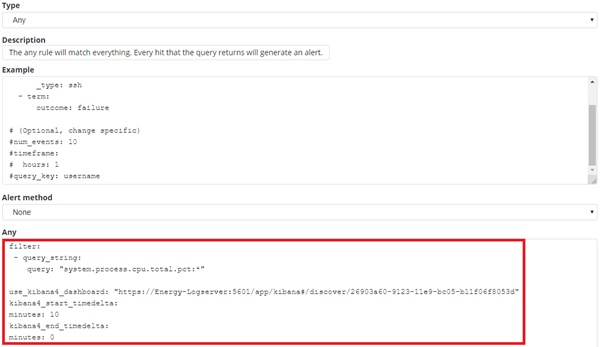
Once Alert is created use ANY frame to add the following directives:
Use_kibana4_dashboard: paste Your „shared link” here
use_kibana_dashboard: - The name of a Kibana dashboard to link to. Instead of generating a dashboard from a template, Alert can use an existing dashboard. It will set the time range on the dashboard to around the match time, upload it as a temporary dashboard, add a filter to the query_key of the alert if applicable, and put the url to the dashboard in the alert. (Optional, string, no default).
Kibana4_start_timedelta
kibana4_start_timedelta: Defaults to 10 minutes. This option allows you to specify the start time for the generated kibana4 dashboard. This value is added in front of the event. For example,
`kibana4_start_timedelta: minutes: 2`
Kibana4_end_timedelta`
kibana4_end_timedelta: Defaults to 10 minutes. This option allows you to specify the end time for the generated kibana4 dashboard. This value is added in back of the event. For example,
kibana4_end_timedelta: minutes: 2
Sample:
Search for triggered alert in Discovery tab. Use alert* search pattern.
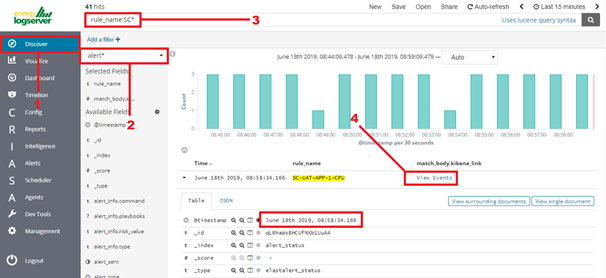
Refresh the alert that should contain url for the dashboard. Once available, kibana_dashboard field can be exposed to dashboards giving You a real drill down feature.
Sound notification
You can use sound notification on dashboard when the new document is coming. To configure sound notification on dashboard use the following steps:
- create and save the
Saved searchinDiscoverymodule; - open the proper dashboard and
addthe previously createdSaved search; - exit form dashboard editing mode by click on the
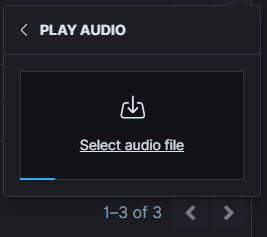
savebutton; - click on three small square on the previously added object and select
Play audio: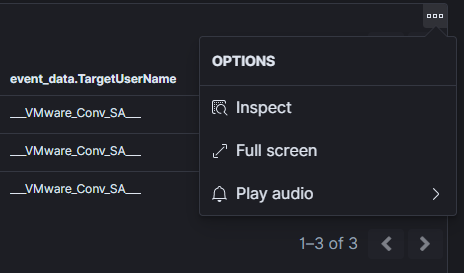
- select the sound file in the mp3 format from your local disk and click OK:
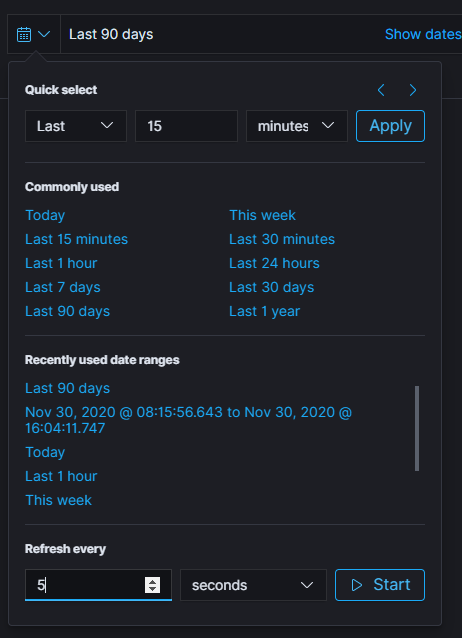
- on the dashboard set the automatically refresh data. for example every 5 seconds:
- when new document will coming the sound will playing.# Reports #
Energy Logserver contains a module for creating reports that can be run cyclically and contain only interesting data, e.g. a weekly sales report.
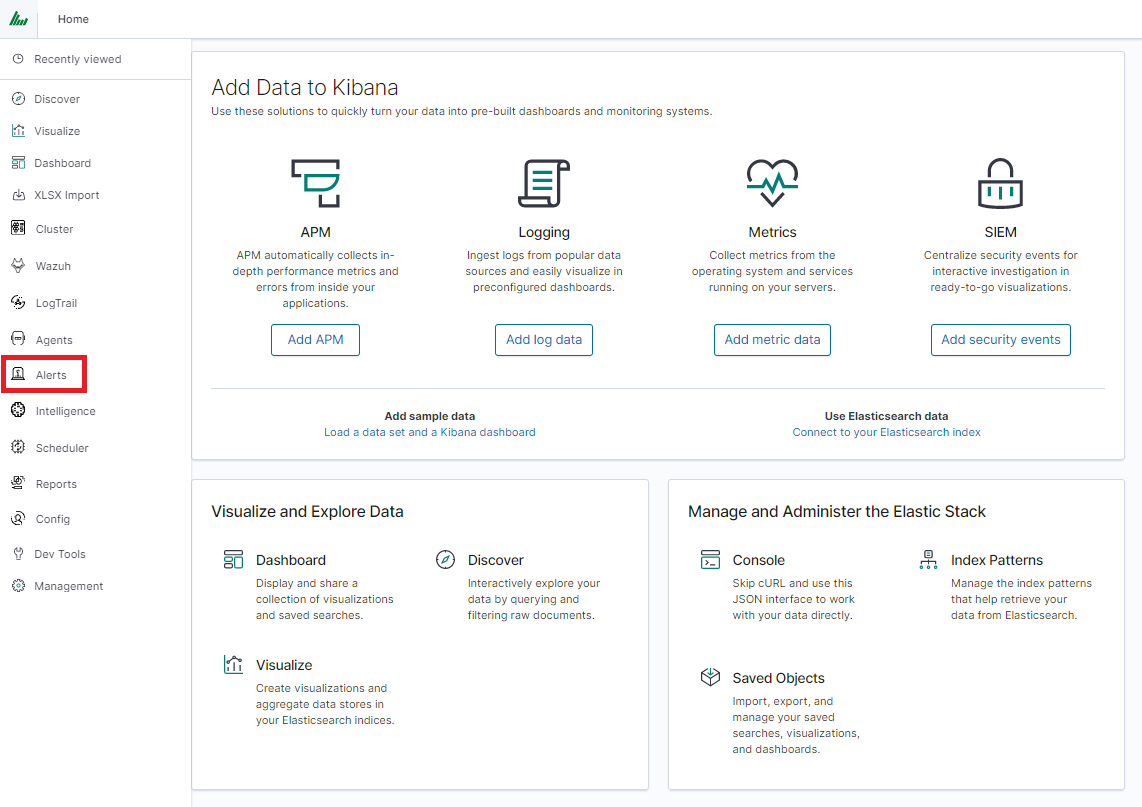
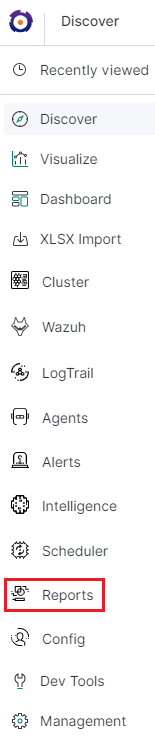
To go to the reports windows, select to tiles icon from the main menu bar, and then go to the „Reports” icon (To go back, go to the „Search” icon).
Reports
CSV Report
To export data to CSV Report click the Reports icon, you immediately go to the first tab - Export Data
In this tab we have the opportunity to specify the source from which
we want to do export. It can be an index pattern. After selecting it,
we confirm the selection with the Submit button and a report is
created at the moment. The symbol
 can refresh the list of reports and see
what its status is.
can refresh the list of reports and see
what its status is.
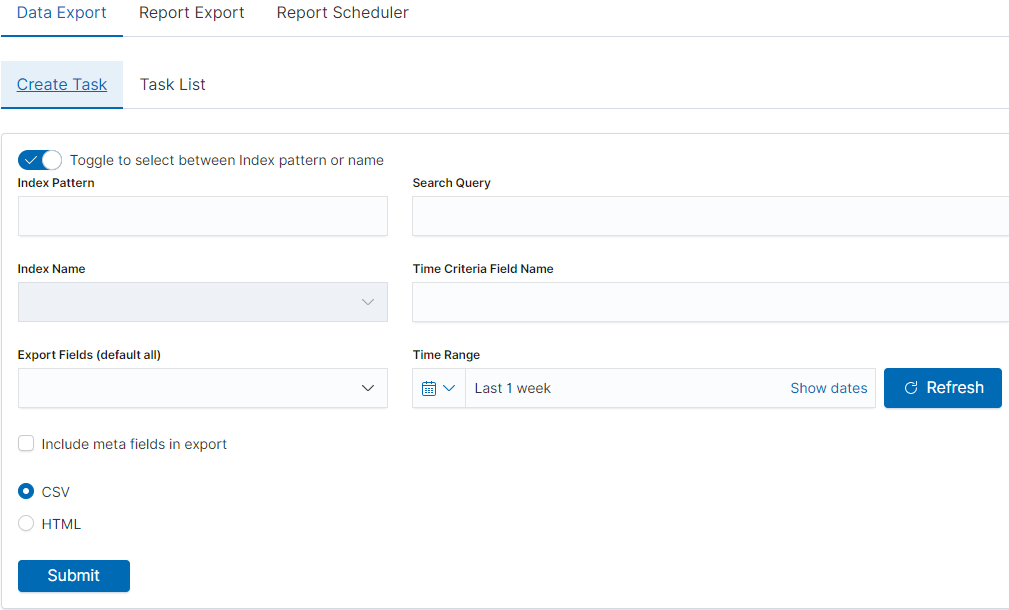
We can also create a report by pointing to a specific index from the drop-down list of indexes.
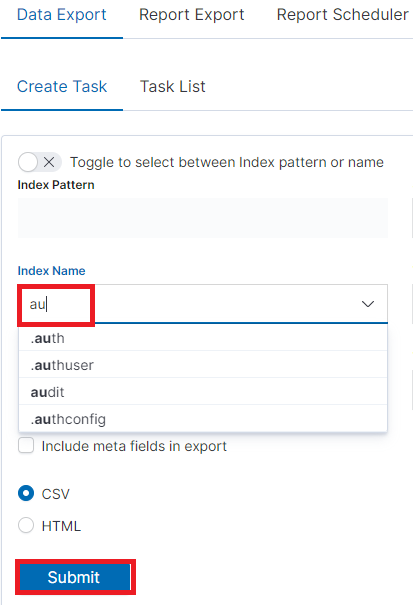
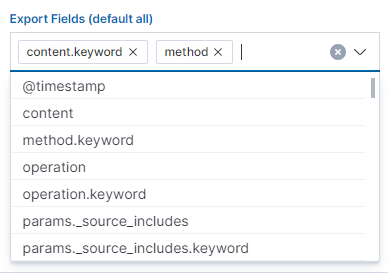
We can also check which fields are to be included in the report. The selection is confirmed by the Submit button.
When the process of generating the report (Status:Completed) is finished, we can download it (Download button) or delete (Delete button). The downloaded report in the form of *.csv file can be opened in the browser or saved to the disk.
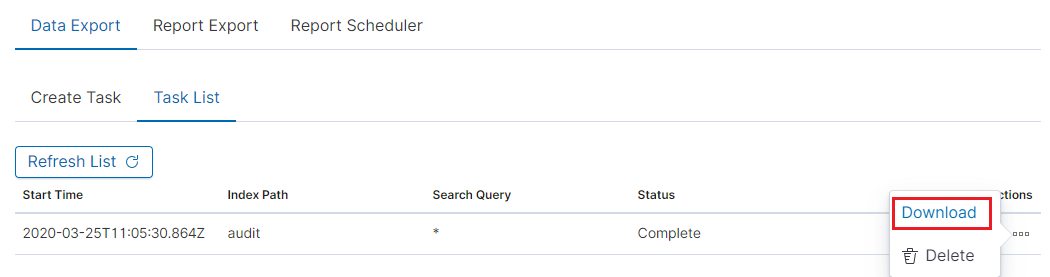
In this tab, the downloaded data has a format that we can import into other systems for further analysis.
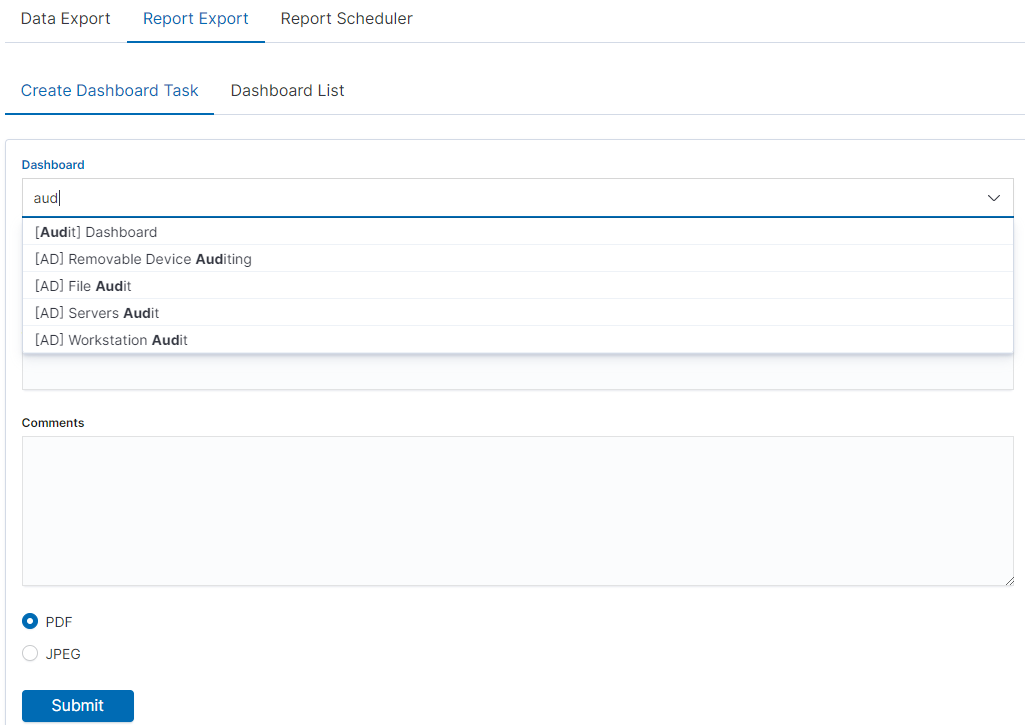
PDF Report
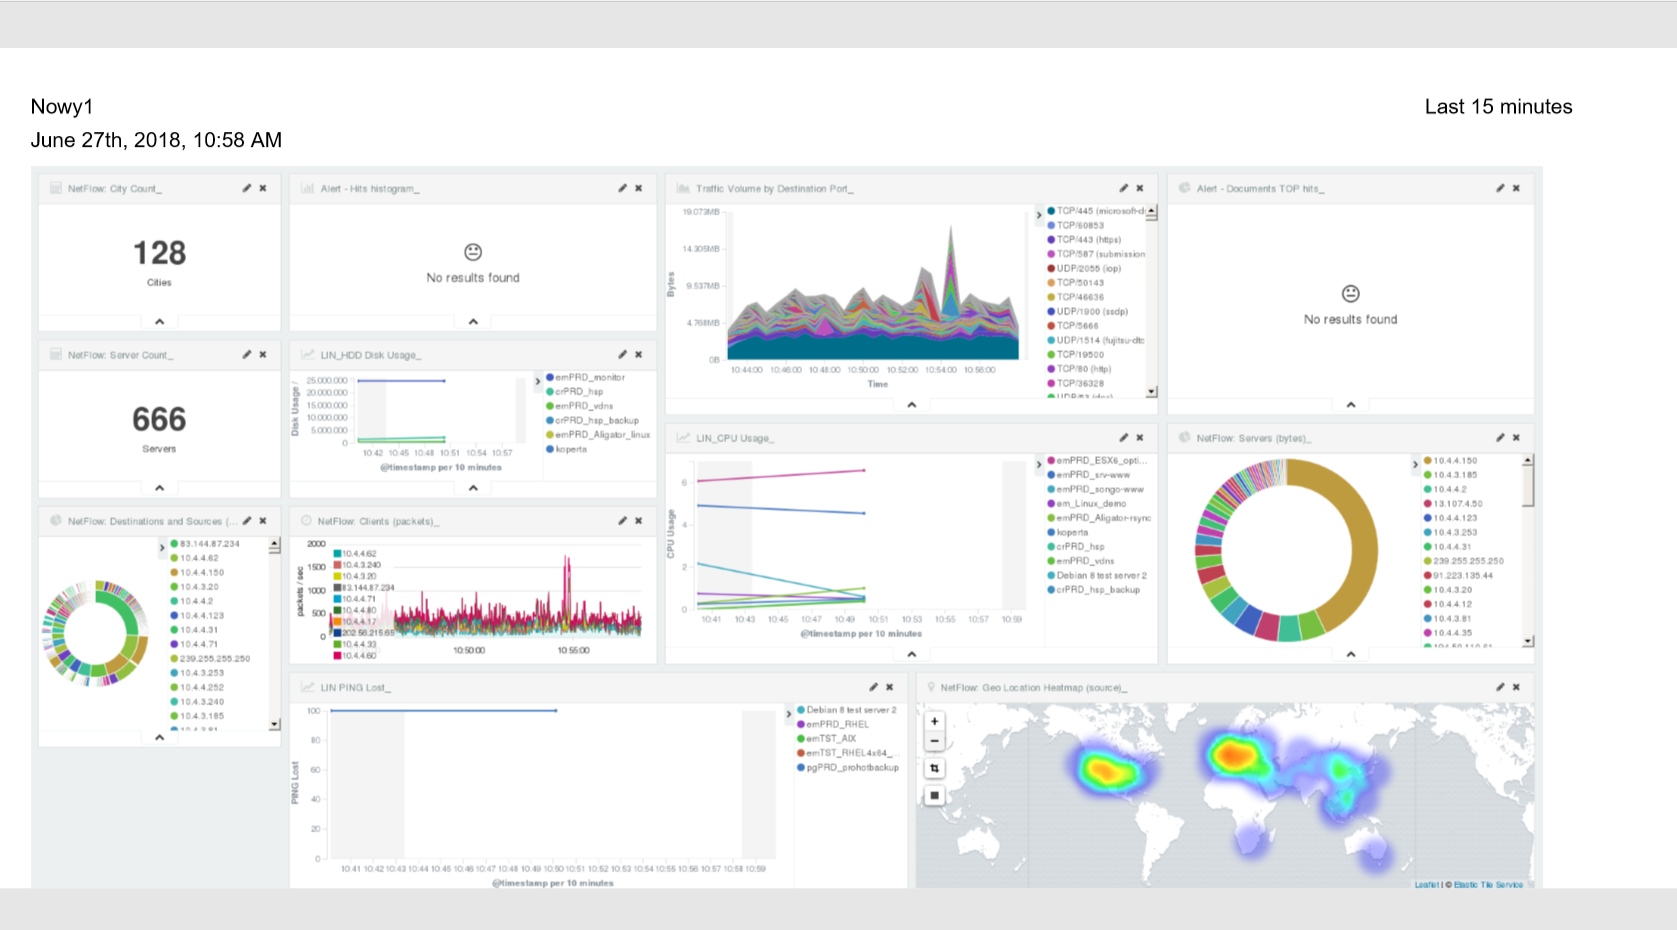
In the Export Dashboard tab we have the possibility to create graphic reports in PDF files. To create such a report, just from the drop-down list of previously created and saved Dashboards, indicate the one we are interested in, and then confirm the selection with the Submit button. A newly created export with the Processing status will appear on the list under Dashboard Name. When the processing is completed, the Status changes to Complete and it will be possible to download the report.
By clicking the Download button, the report is downloaded to the disk or we can open it in the PDF file browser. There is also to option of deleting the report with the Delete button.
Below is an example report from the Dashboard template generated and downloaded as a PDF file.
PDF report from the table visualization
Data from a table visualization can be exported as a PDF report.
To export a table visualization data, follow these steps:
Go to the ‘Report’ module and then to the ‘Report Export’ tab,
Add the new task name in ‘Task Name’ field,
Toggle the switch ‘Enable Data Table Export’:
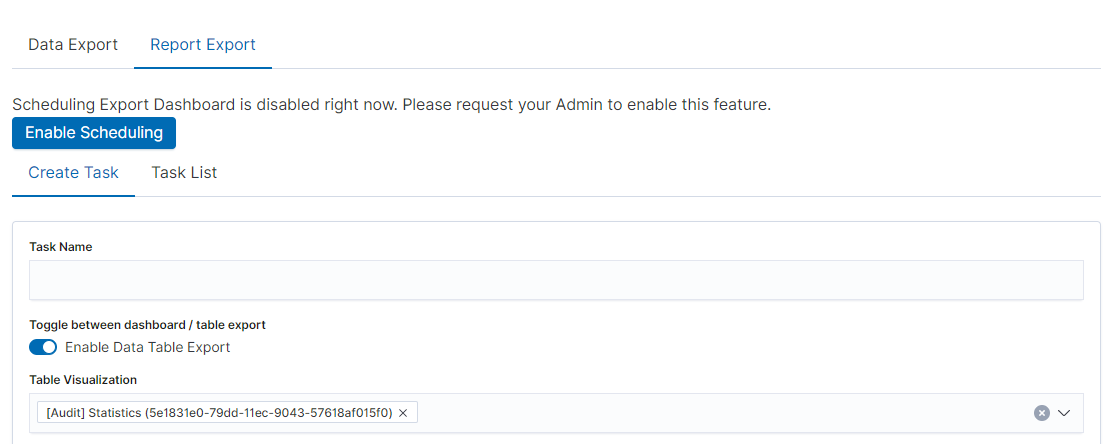
Select the table from the ‘Table Visualization’ list,
Select the time range for which the report is to be prepared,
You can select a logo from the ‘Logo’ list,
You can add a report title using the ‘Title’ field,
You can add a report comment using the ‘Comments’ field,
Select the ‘Submit’ button to start creating the report,
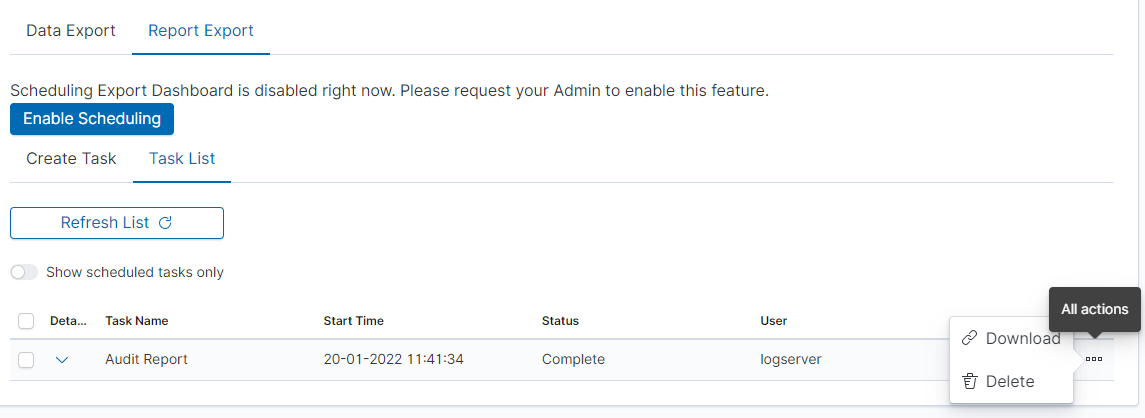
You can follow the progress in the ‘Task List’ tab,
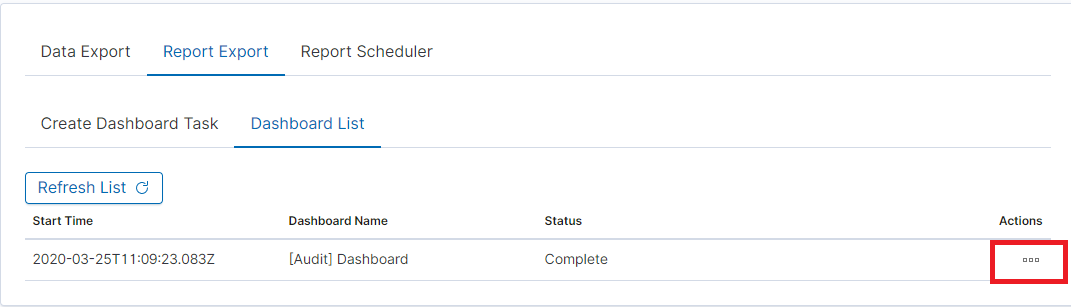
After completing the task, the status will change to ‘Complete’ and you can download the PDF report via ‘Action’ -> ‘Download’:
Scheduler Report (Schedule Export Dashboard)
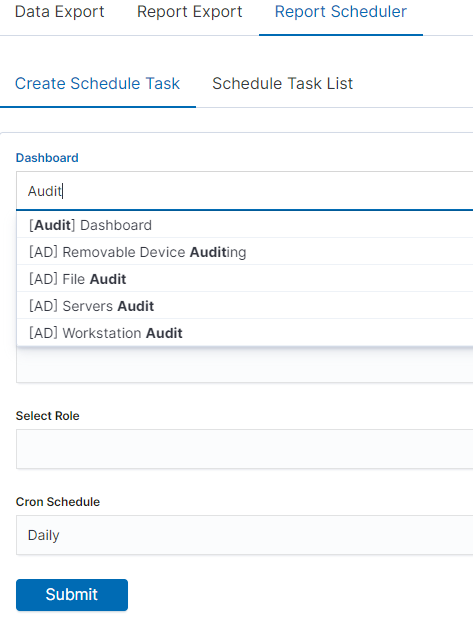
In the Report selection, we have the option of setting the Scheduler which from Dashboard template can generate a report at time intervals. To do this goes to the Schedule Export Dashboard tab.
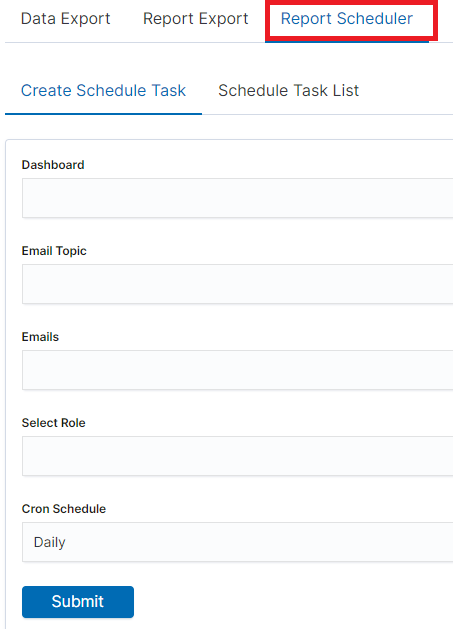
Scheduler Report (Schedule Export Dashboard)
In this tab mark the saved Dashboard.
Note: The default time period of the dashboard is last 15 minutes.
Please refer to Discovery > Time settings and refresh to change the time period of your dashboard.
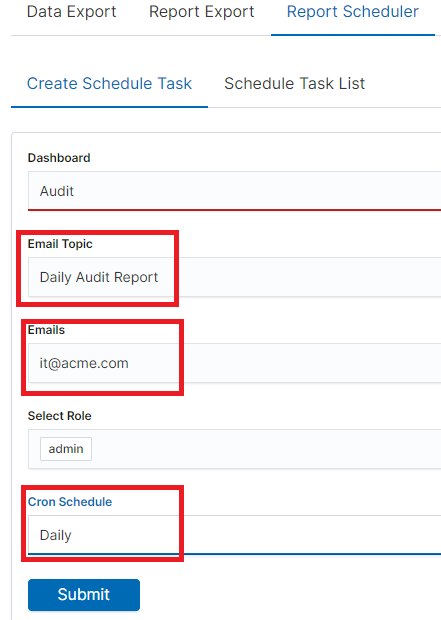
In the Email Topic field, enter the Message title, in the Email field enter the email address to which the report should be sent. From drop-down list choose at what frequency you want the report to be generated and sent. The action configured in this way is confirmed with the Submit button.
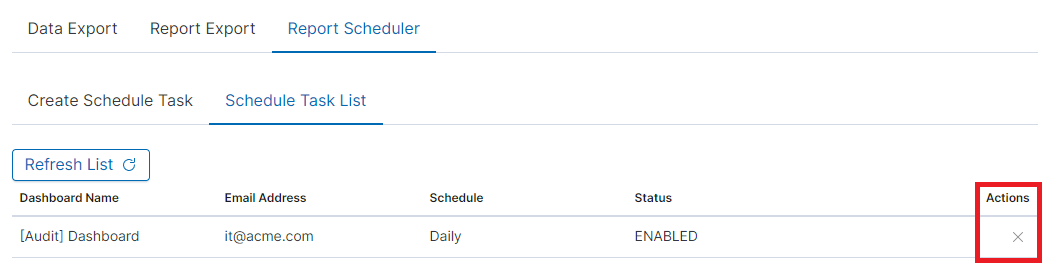
The defined action goes to the list and will generate a report to the e-mail address, with the cycle we set, until we cannot cancel it with the Cancel button.
User roles and object management
Users, roles and settings
Energy Logserver allows to you manage users and permission for indexes and methods used by them. To do this click the “Config” button from the main menu bar.
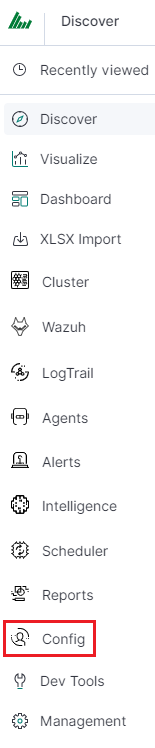
A new window will appear with three main tabs: „User Management”, „Settings” and „License Info”.
From the „User Management” level we have access to the following possibilities: Creating a user in „Create User”, displaying users in „User List”, creating new roles in „Create roles” and displaying existing roles in „List Role”.
Creating a User (Create User)
Creating user
To create a new user click on the Config icon and you immediately enter the administration panel, where the first tab is to create a new user (Create User).
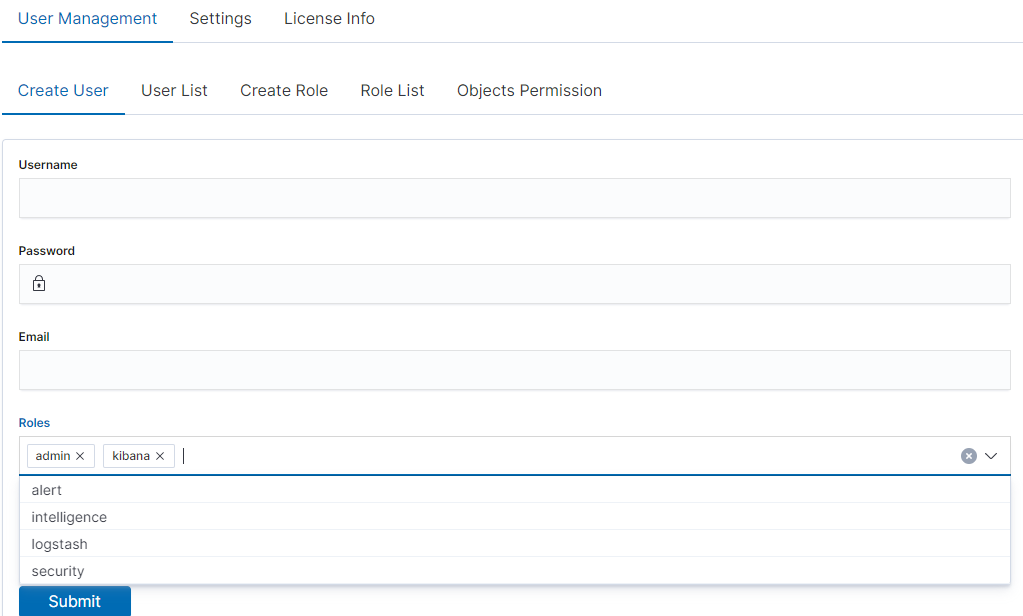
In the wizard that opens, we enter a unique username (Username field), password for the user (field Password) and assign a role (field Role). In this field we have the option of assigning more than one role. Until we select role in the Roles field, the Default Role field remains empty. When we mark several roles, these roles appear in the Default Role field. In this field we have the opportunity to indicate which role for a new user will be the default role with which the user will be associated in the first place when logging in. The default role field has one more important task - it binds all users with the field / role set in one group. When one of the users of this group create Visualization or Dashboard it will be available to other users from this role(group). Creating the account is confirmed with the Submit button.
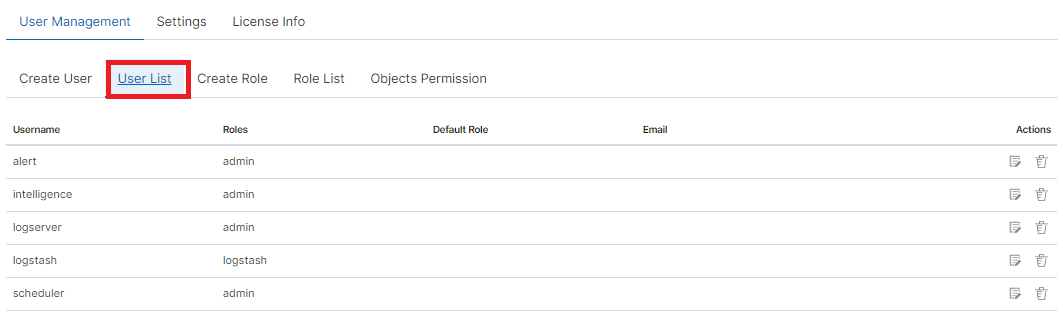
User’s modification and deletion, (User List)
Once we have created users, we can display their list. We do it in next tab (User List).
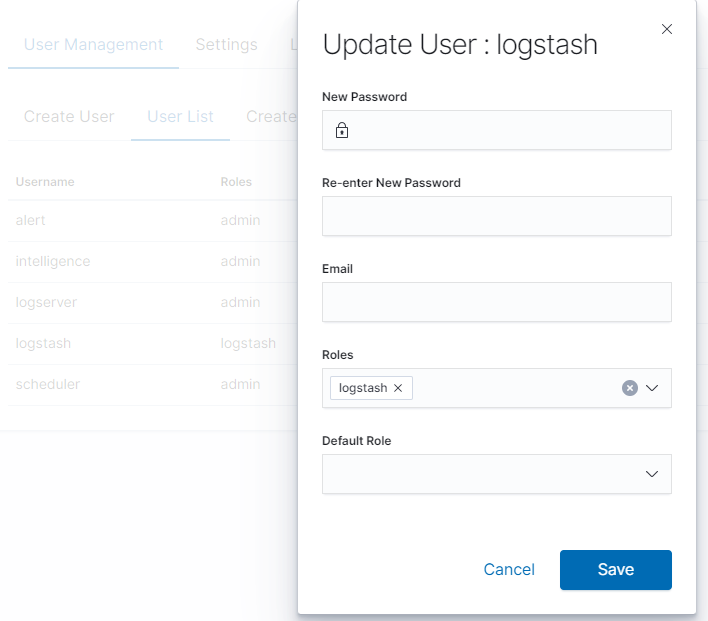
In this view, we get a list of user account with assigned roles and we have two buttons: Delete and Update. The first of these is ability to delete a user account. Under the Update button is a drop-down menu in which we can change the previous password to a new one (New password), change the password (Re-enter Ne Password), change the previously assigned roles (Roles), to other (we can take the role assigned earlier and give a new one, extend user permissions with new roles). The introduced changes are confirmed with the Submit button.
We can also see current user setting and clicking the Update button collapses the previously expanded menu.
Create, modify and delete a role (Create Role), (Role List)
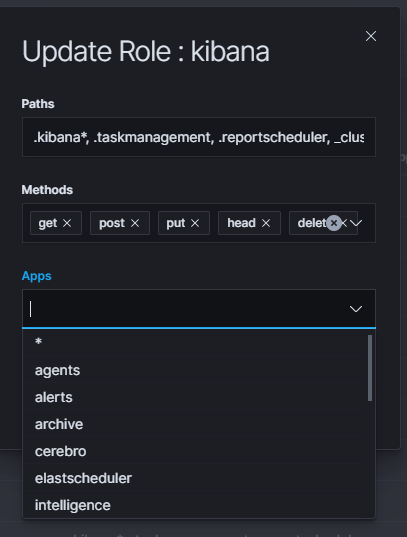
In the Create Role tab we can define a new role with permissions that we assign to a pattern or several index patterns.
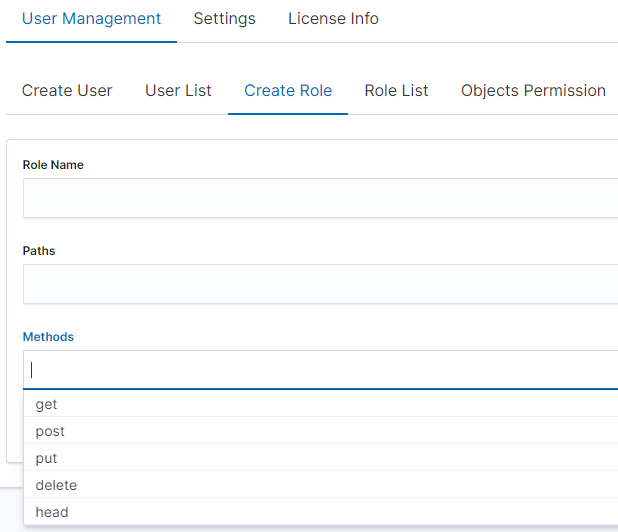
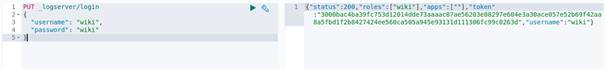
In example, we use the syslog2* index pattern. We give this name in the Paths field. We can provide one or more index patterns, their names should be separated by a comma. In the next Methods field, we select one or many methods that will be assigned to the role. Available methods:
- PUT - sends data to the server
- POST - sends a request to the server for a change
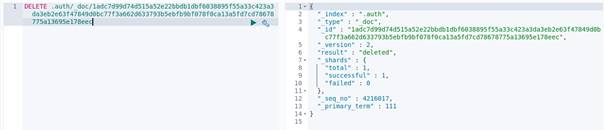
- DELETE - deletes the index / document
- GET - gets information about the index /document
- HEAD - is used to check if the index /document exists
In the role field, enter the unique name of the role. We confirm addition of a new role with the Submit button. To see if a new role has been added, go to the net Role List tab.
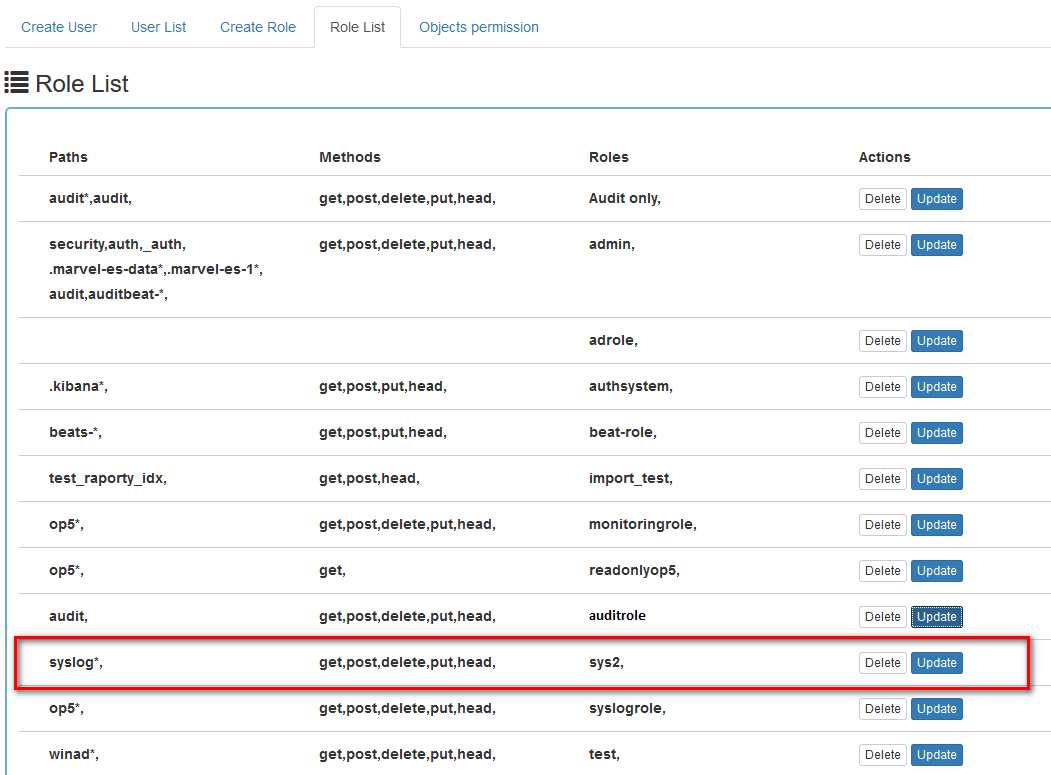
As we can see, the new role has been added to the list. With the Delete button we have the option of deleting it, while under the Update button we have a drop-down menu thanks to which we can add or remove an index pattern and add or remove a method. When we want to confirm the changes, we choose the Submit button. Pressing the Update button again will close the menu.
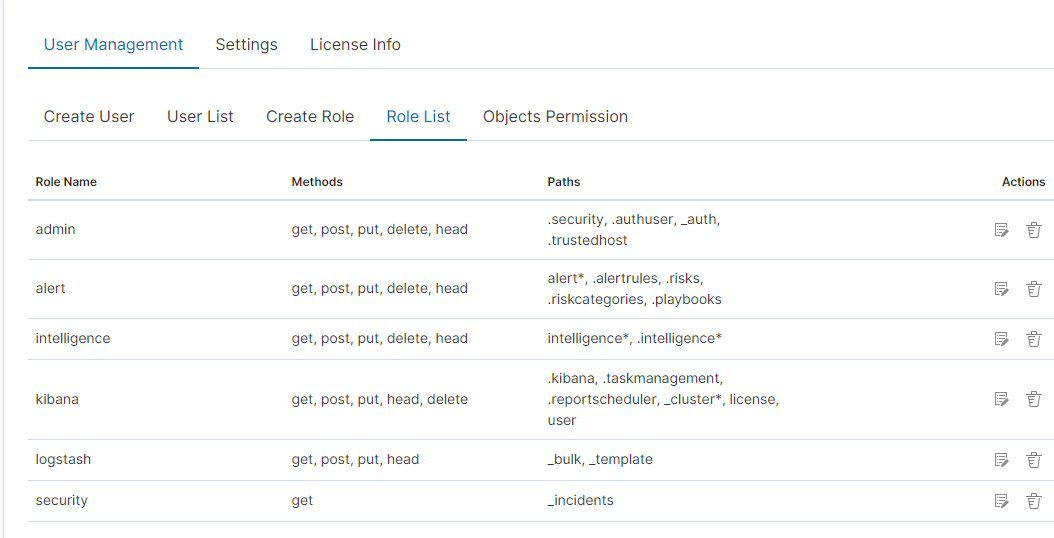
Fresh installation of the application have sewn solid roles which granting user special rights:
- admin - this role gives unlimited permissions to administer / manage the application
- alert - a role for users who want to see the Alert module
- kibana - a role for users who want to see the application GUI
- Intelligence - a role for users who are to see the Intelligence moduleObject access permissions (Objects permissions)
In the User Manager tab we can parameterize access to the newly created role as well as existing roles. In this tab we can indicate to which object in the application the role has access.
Example:
In the Role List tab we have a role called sys2, it refers to all index patterns beginning with syslog* and the methods get, post, delete, put and head are assigned.
When we go to the Object permission tab, we have the option to choose the sys2 role in the drop-down list choose a role:
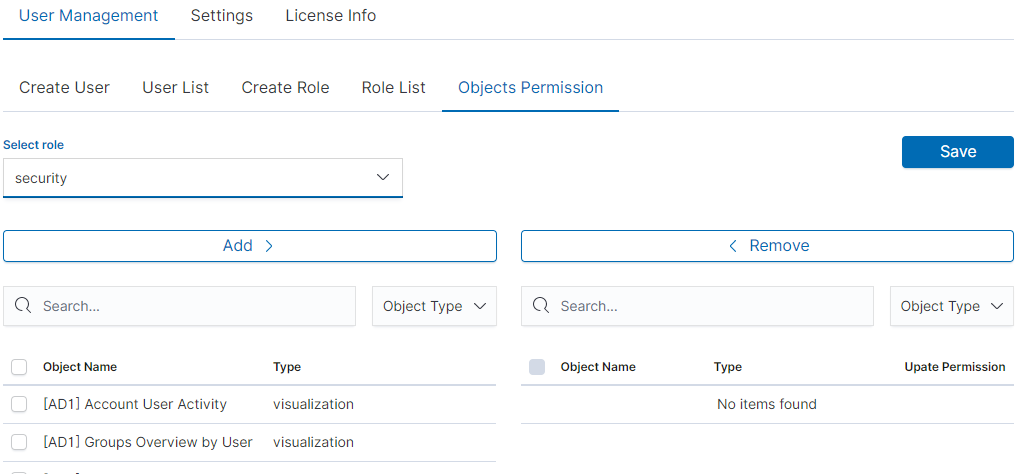
After selecting, we can see that we already have access to the objects: two index patterns syslog2* and Energy Logserver-* and on dashboard Windows Events. There are also appropriate read or updates permissions.
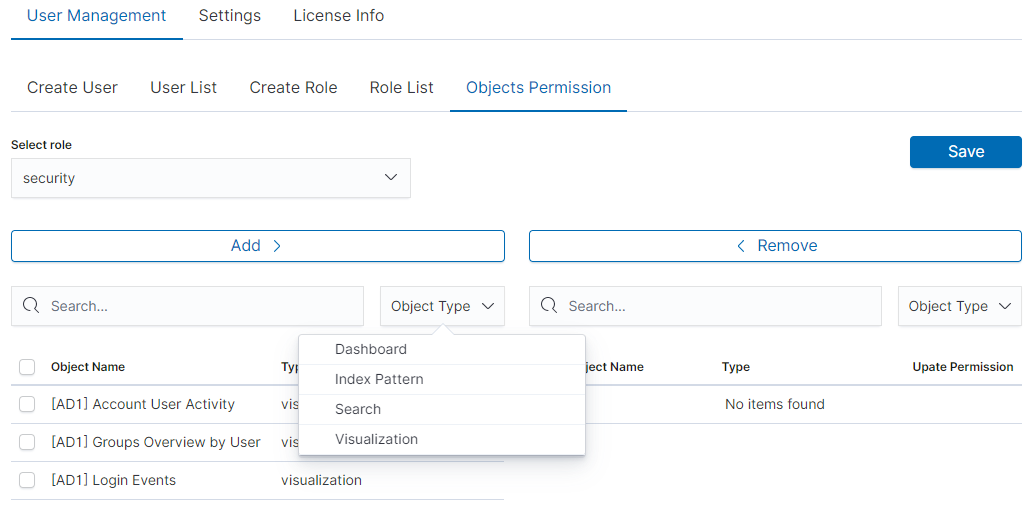
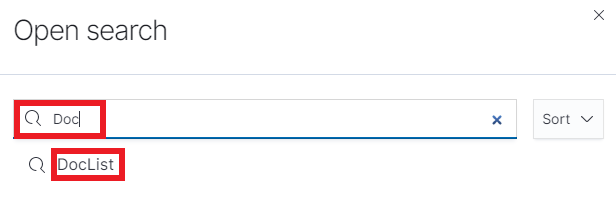
From the list we have the opportunity to choose another object that we
can add to the role. We have the ability to quickly find this object
in the search engine (Find) and narrowing the object class in
the drop-down field “Select object type”. The object type are associated
with saved previously documents in the sections Dashboard, Index pattern,
Search and Visualization.
By buttons  we have the ability to add or remove or
object, and Save button to save the selection.
we have the ability to add or remove or
object, and Save button to save the selection.
Default user and passwords
The table below contains built-in user accounts and default passwords:
|Address                |User         |Password     |Role         |Description                                     |Usage          |
|-----------------------|-------------|-------------|-------------|------------------------------------------------|---------------|
|https://localhost:5601	|logserver    |logserver    |logserver    |A built-in *superuser* account                  |               |
|                       |alert        |alert        |alert        |A built-in account for  the Alert module        |               |
|                       |intelligence |intelligece  |intelligence |A built-in account for the Intelligence module  | authorizing communication with elasticsearch server |
|                       |scheduler    |scheduler    |scheduler    |A built-in account for the Scheduler module     |
|                       |logstash     |logstash     |logstash     |A built-in account for authorized comuunication form Logstash |
|                       |cerebro      |     |system acconut only     |A built-in account for authorized comuunication from Cerebro moudule |
Changing password for the system account
After you change password for one of the system account ( alert, intelligence, logserver, scheduler), you must to do appropriate changes in the application files.
Account Logserver
- Update /etc/kibana/kibana.yml
vi /etc/kibana/kibana.yml
elasticsearch.password: new_logserver_passowrd
elastfilter.password: "new_logserver_password"
cerebro.password: "new_logserver_password"
Update passowrd in /opt/license-service/license-service.conf file:
elasticsearch_connection:
hosts: ["10.4.3.185:9200"]

username: logserver
password: "new_logserver_password"

https: true
Update password in curator configuration file: /usr/share/kibana/curator/curator.yml
http_auth: logserver:"new_logserver_password
Account Intelligence
Update /opt/ai/bin/conf.cfg
vi /opt/ai/bin/conf.cfg
password=new_intelligence_password
Account Alert
Update file /opt/alert/config.yaml
vi /opt/alert/config.yaml
es_password: alert
Account Scheduler
Update /etc/kibana/kibana.yml
vi /etc/kibana/kibana.yml
elastscheduler.password: "new_scheduler_password"
Account Logstash
Update the Logstash pipeline configuration files (*.conf) in output sections:
vi /etc/logstash/conf.d/*.conf
elasticsearch {
	hosts => ["localhost:9200"]
	index => "syslog-%{+YYYY.MM}"
	user => "logstash"
	password => "new_password"
}
Module Access
You can restrict access to specific modules for a user role. For example: the user can only use the Discovery, Alert and Cerebro modules, the other modules should be inaccessible to the user.
You can do this by editing the roles in the Role List and selecting the application from the Apps list. After saving, the user has access only to specific modules.
Manage API keys
The system allows you to manage, create and delete API access keys from the level of the GUI management application.
Examples of implementation:
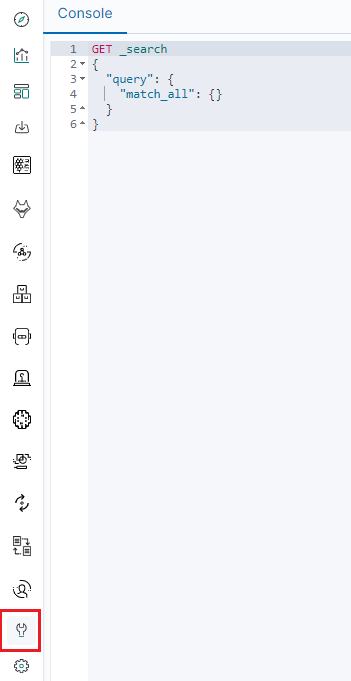
From the main menu select “Dev Tools” button:
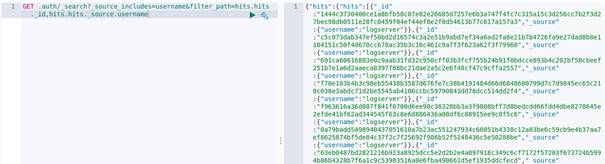
List of active keys:
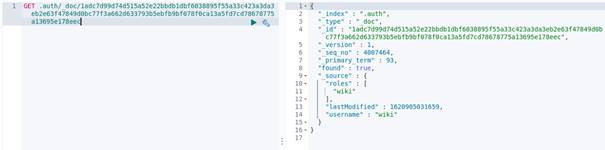
Details of a single key:
Create a new key:
Deleting the key:
Settings
General Settings
The Settings tab is used to set the audit on different activates or events and consists of several fields:
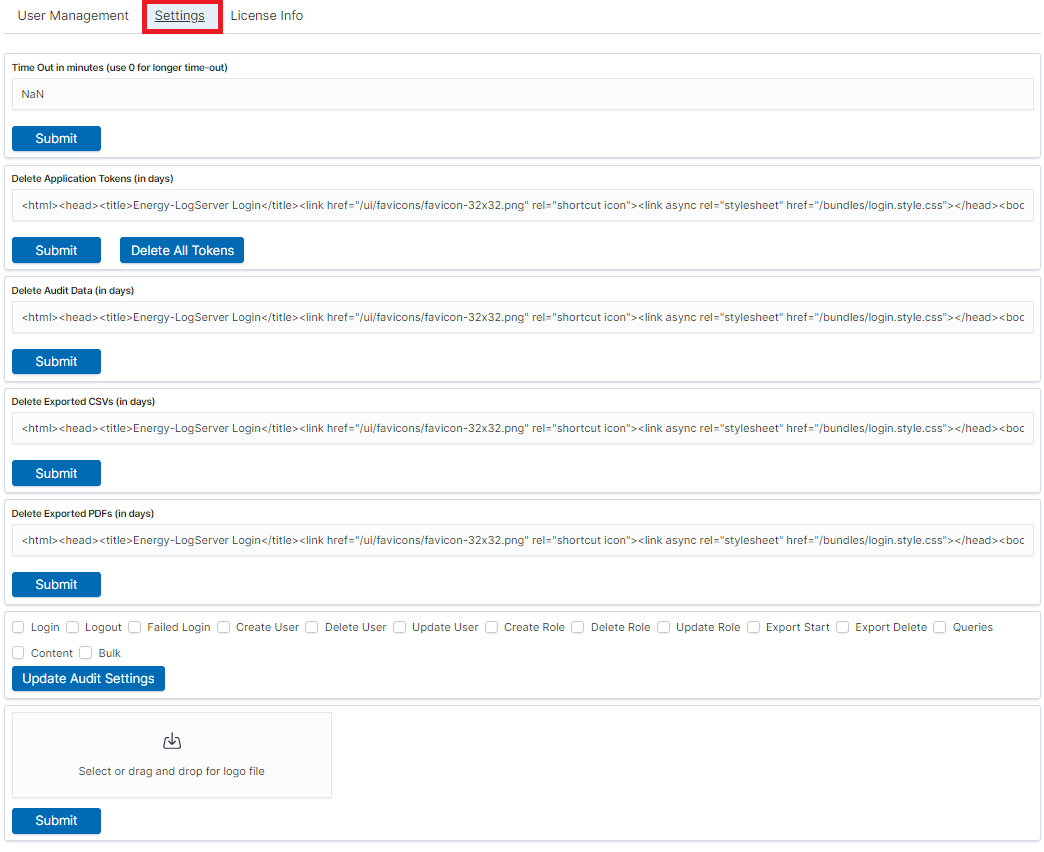
- Time Out in minutes field - this field defines the time after how many minutes the application will automatically log you off
- Delete Application Tokens (in days) - in this field we specify after what time the data from the audit should be deleted
- Delete Audit Data (in days) field - in this field we specify after what time the data from the audit should be deleted
- Next field are checkboxes in which we specify what kind of events are to be logged (saved) in the audit index. The events that can be monitored are: logging (Login), logging out (Logout), creating a user (Create User), deleting a user (Delete User), updating user (Update User), creating a role (Create Role), deleting a role (Delete Role), update of the role (Update Role), start of export (Export Start), delete of export (Export Delete), queries (Queries), result of the query (Content), if attempt was made to perform a series of operation (Bulk)
- Delete Exported CSVs (in days) field - in this field we specify after which time exported file with CSV extension have to be removed
- Delete Exported PDFs (in days) field - in this field we specify after which time exported file with PDF extension have to be removed
To each field is assigned “Submit” button thanks to which we can confirm the changes.
License (License Info)
The License Information tab consists of several non-editable information fields.
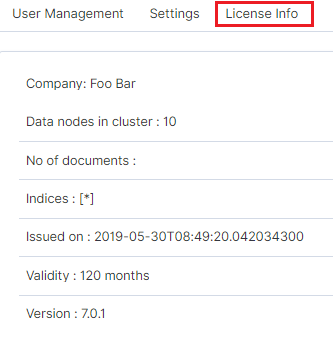
These fields contain information:
- Company field, who owns the license - in this case EMCA S.A.
- Data nodes in cluster field - how many nodes we can put in one cluster - in this case 100
- No of documents field - empty field
- Indices field - number of indexes, symbol[*] means that we can create any number of indices
- Issued on field - date of issue
- Validity field - validity, in this case for 360000 months
Renew license
To change the Energy Logserver license files on a running system, do the following steps.
Copy the current license files to the backup folder:
mv /usr/share/elasticsearch/es_* ~/backup/
Copy the new license files to the Elasticsearch installation directory:
cp es_* /usr/share/elasticsearch/
Add necessary permission to the new license files:
chown elasticsearch:elasticsearch /usr/share/elasticsearch/es_*
Reload the license using the License API:
curl -u $USER:$PASSWORD -X POST http://localhost:9200/_license/reload
Special accounts
At the first installation of the Energy Logserver application, apart from the administrative account (logserver), special applications are created in the application: alert, intelligence and scheduler.
- Alert Account - this account is connected to the Alert Module which is designed to track events written to the index for the previously defined parameters. If these are met the information action is started (more on the action in the Alert section)
- Intelligence Account - with this account is related to the module of artificial intelligence which is designed to track events and learn the network based on previously defined rules artificial intelligence based on one of the available algorithms (more on operation in the Intelligence chapter)
- Scheduler Account - the scheduler module is associated with this account, which corresponds to, among others for generating reports
Index management
Note
Before use Index Management module is necessary to set appropriate password for Log Server user in the following file: /usr/share/kibana/curator/curator.yml
The Index Management module allows you to manage indexes and perform activities such as:
- Closing indexes,
- Delete indexes,
- Performing a merge operation for index,
- Shrink index shards,
- Index rollover.
The Index Management module is accessible through the main menu tab.
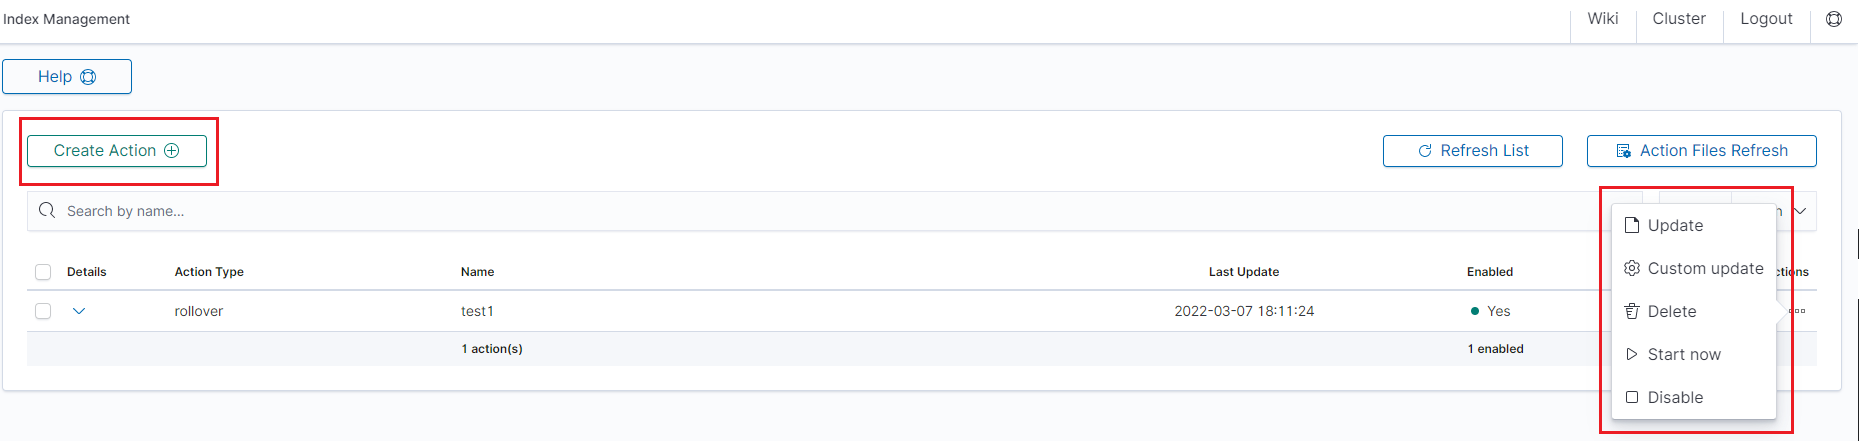
The main module window allows you to create new Create Task tasks, view and manage created tasks, that is:
- Update,
- Custom update,
- Delete,
- Start now,
- Disable / Enable.
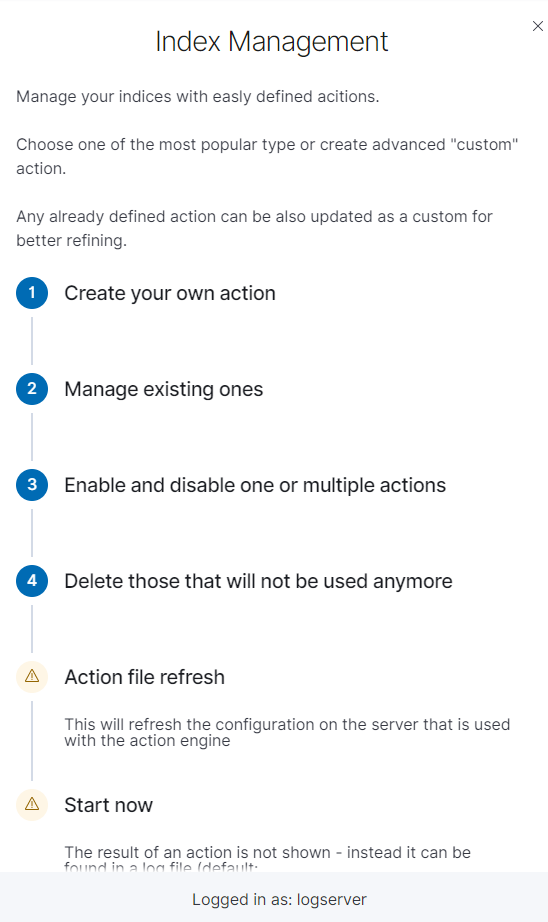
Note Use the Help button
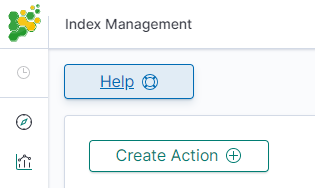
***By using the Help button you can get a detailed description of the current action***s
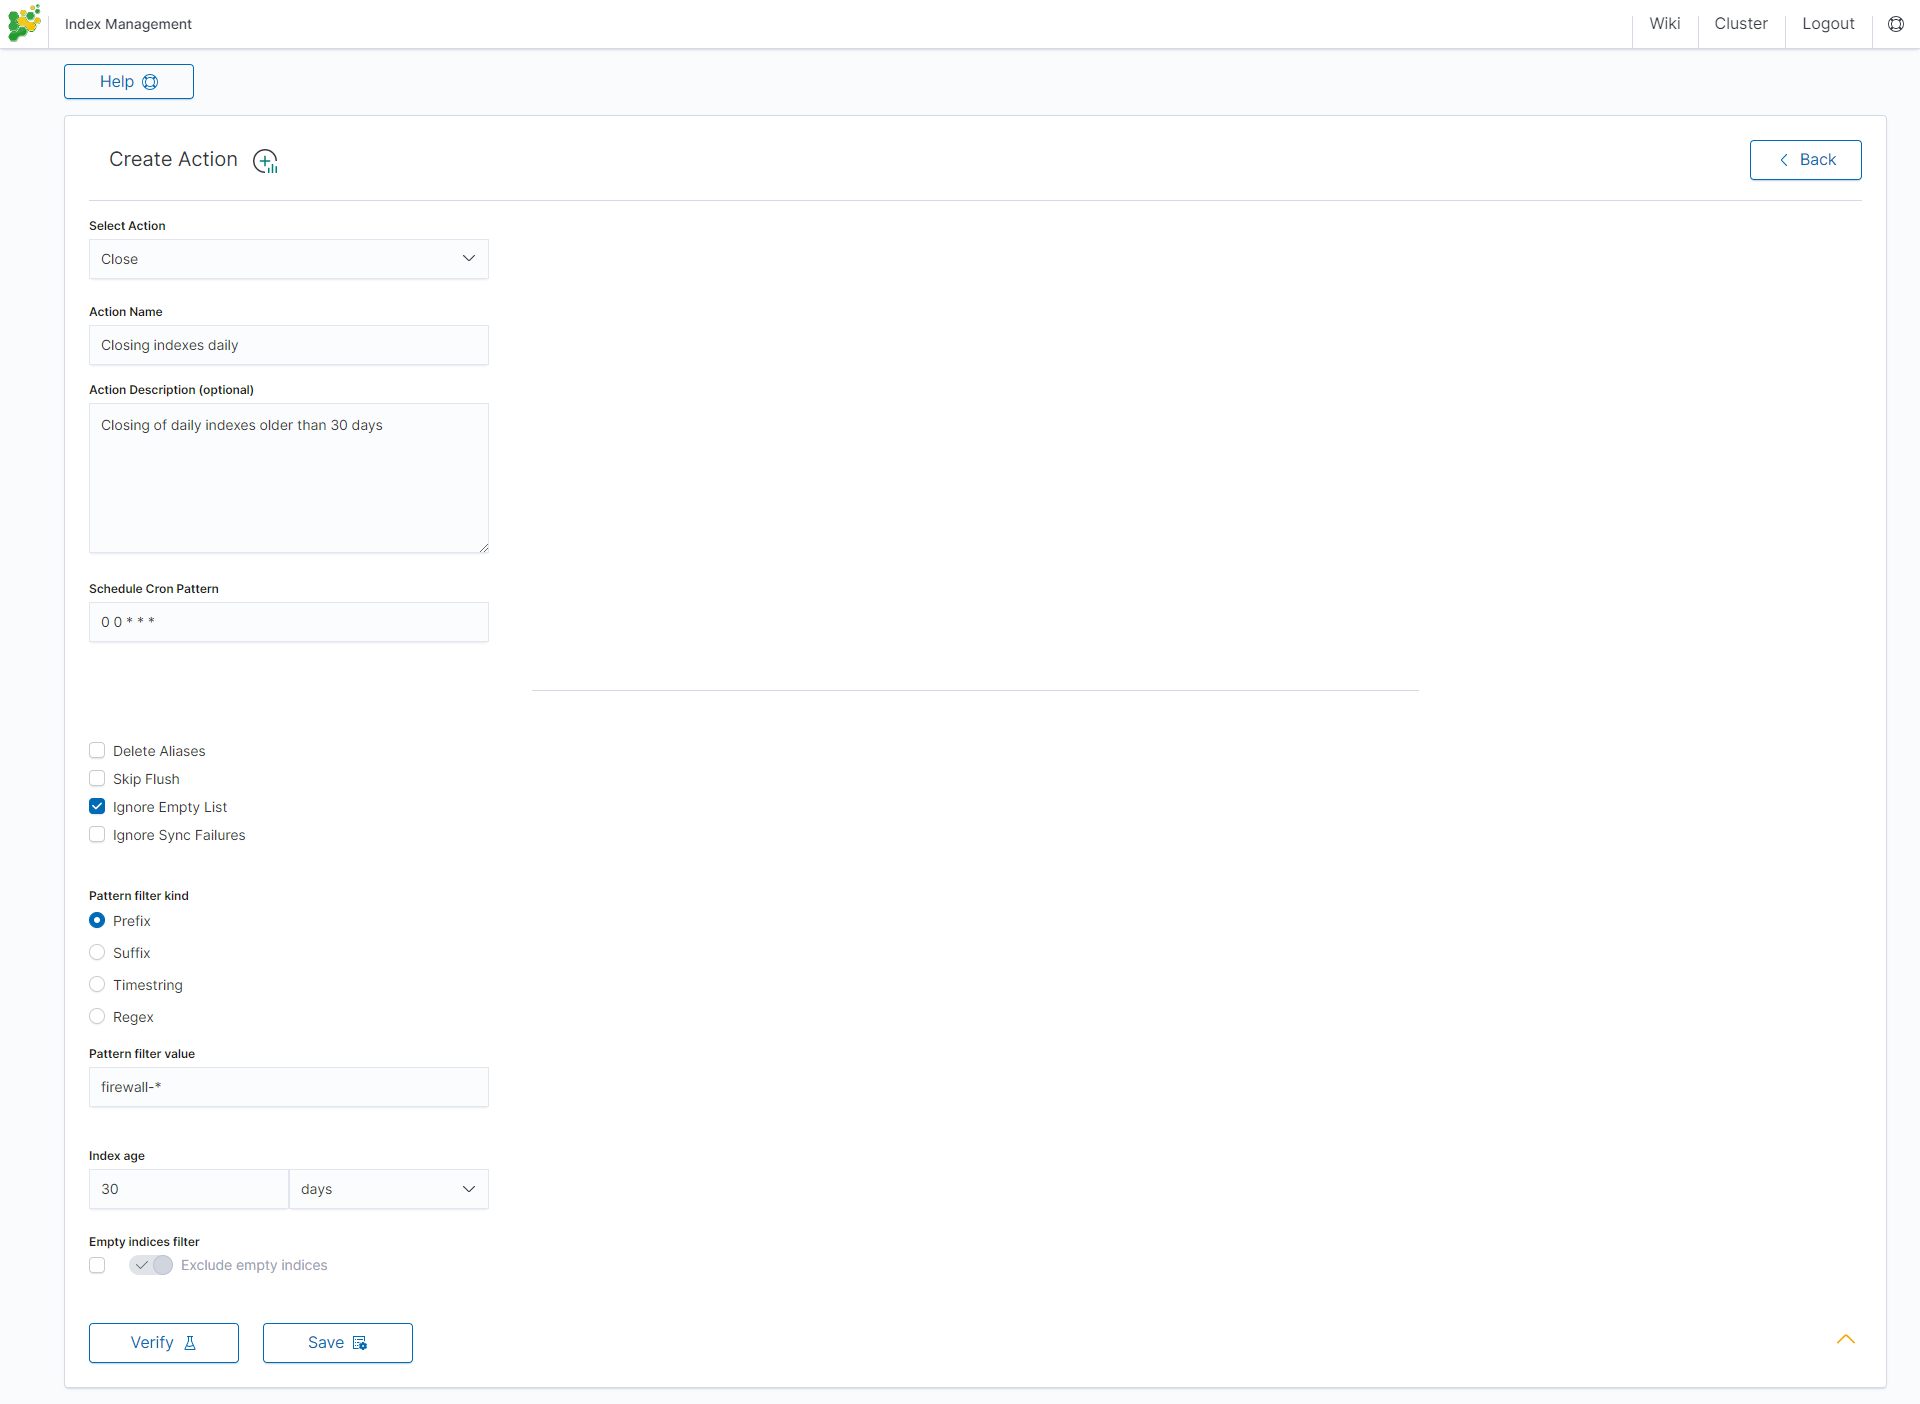
Close action
This action closes the selected indices, and optionally deletes associated aliases beforehand.
Settings required:
- Action Name
- Schedule Cron Pattern - it sets when the task is to be executed, to decode cron format use on-line tool: https://crontab.guru,
- Pattern filter kind - it sets the index filtertype for the task,
- Pattern filter value - it sets value for the index filter,
- Index age - it sets index age for the task.
Optional settings:
- Timeout override
- Ignore Empty List
- Continue if exception
- Closed indices filter
- Empty indices filter
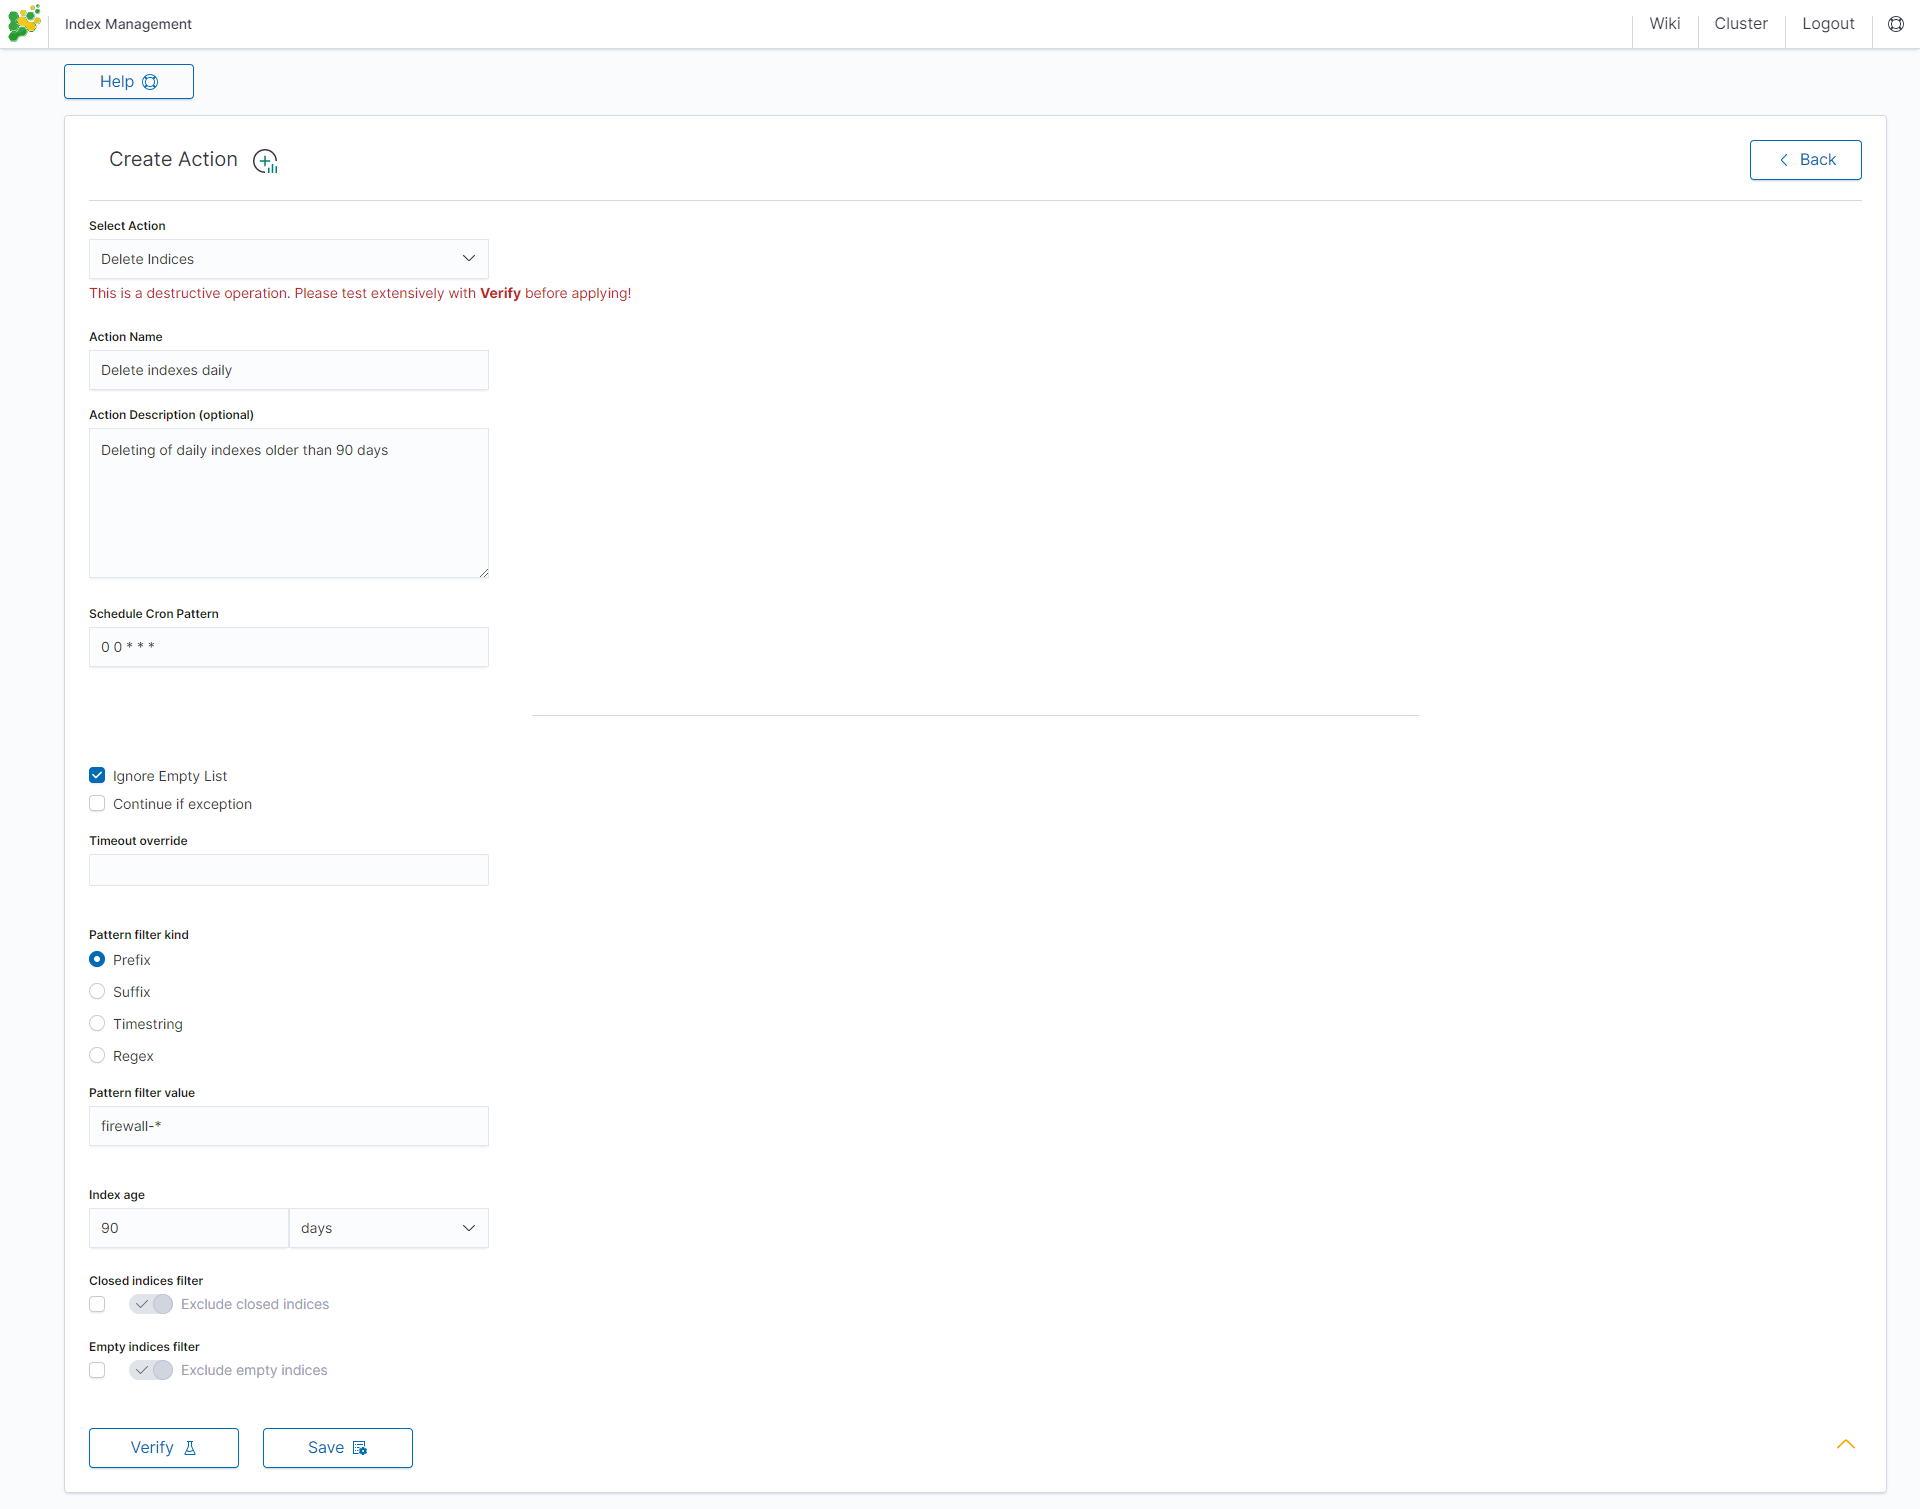
Delete action
This action deletes the selected indices.
Settings required:
- Action Name
- Schedule Cron Pattern - it sets when the task is to be executed, to decode cron format use on-line tool: https://crontab.guru/,
- Pattern filter kind - it sets the index filtertype for the task,
- Pattern filter value - it sets value for the index filter,
- Index age - it sets index age for the task.
Optional settings:
- Delete Aliases
- Skip Flush
- Ignore Empty List
- Ignore Sync Failures
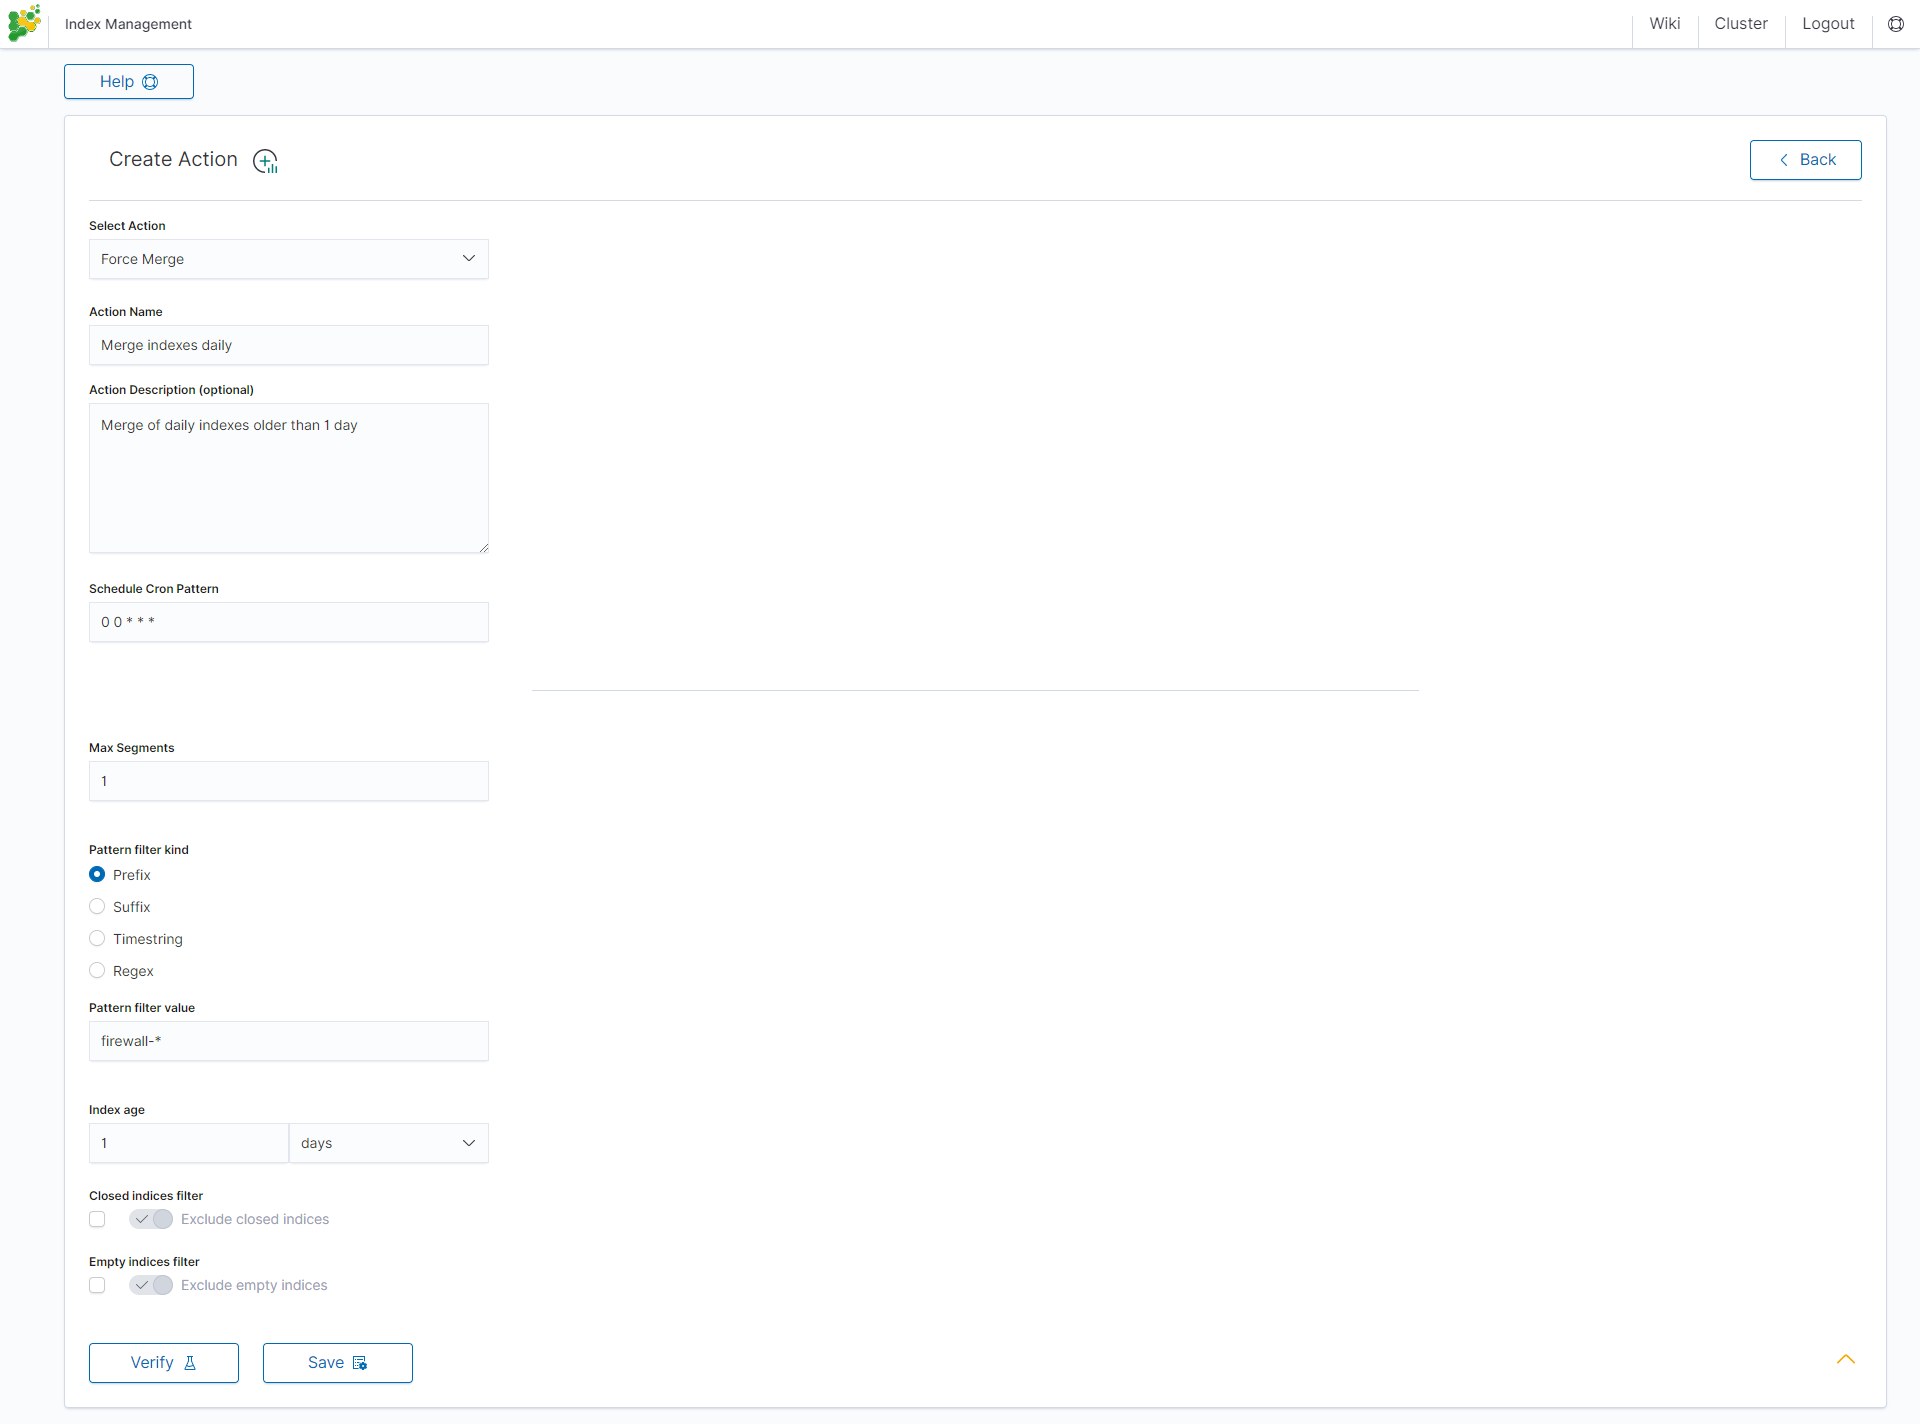
Force Merge action
This action performs a forceMerge on the selected indices, merging them in specific number of segments per shard.
Settings required:
- Action Name
- Schedule Cron Pattern - it sets when the task is to be executed, to decode cron format use on-line tool: https://crontab.guru/,
- Max Segments - it sets the number of segments for the shard,
- Pattern filter kind - it sets the index filtertype for the task,
- Pattern filter value - it sets value for the index filter,
- Index age - it sets index age for the task.
Optional settings:
- Ignore Empty List
- Ignore Sync Failures
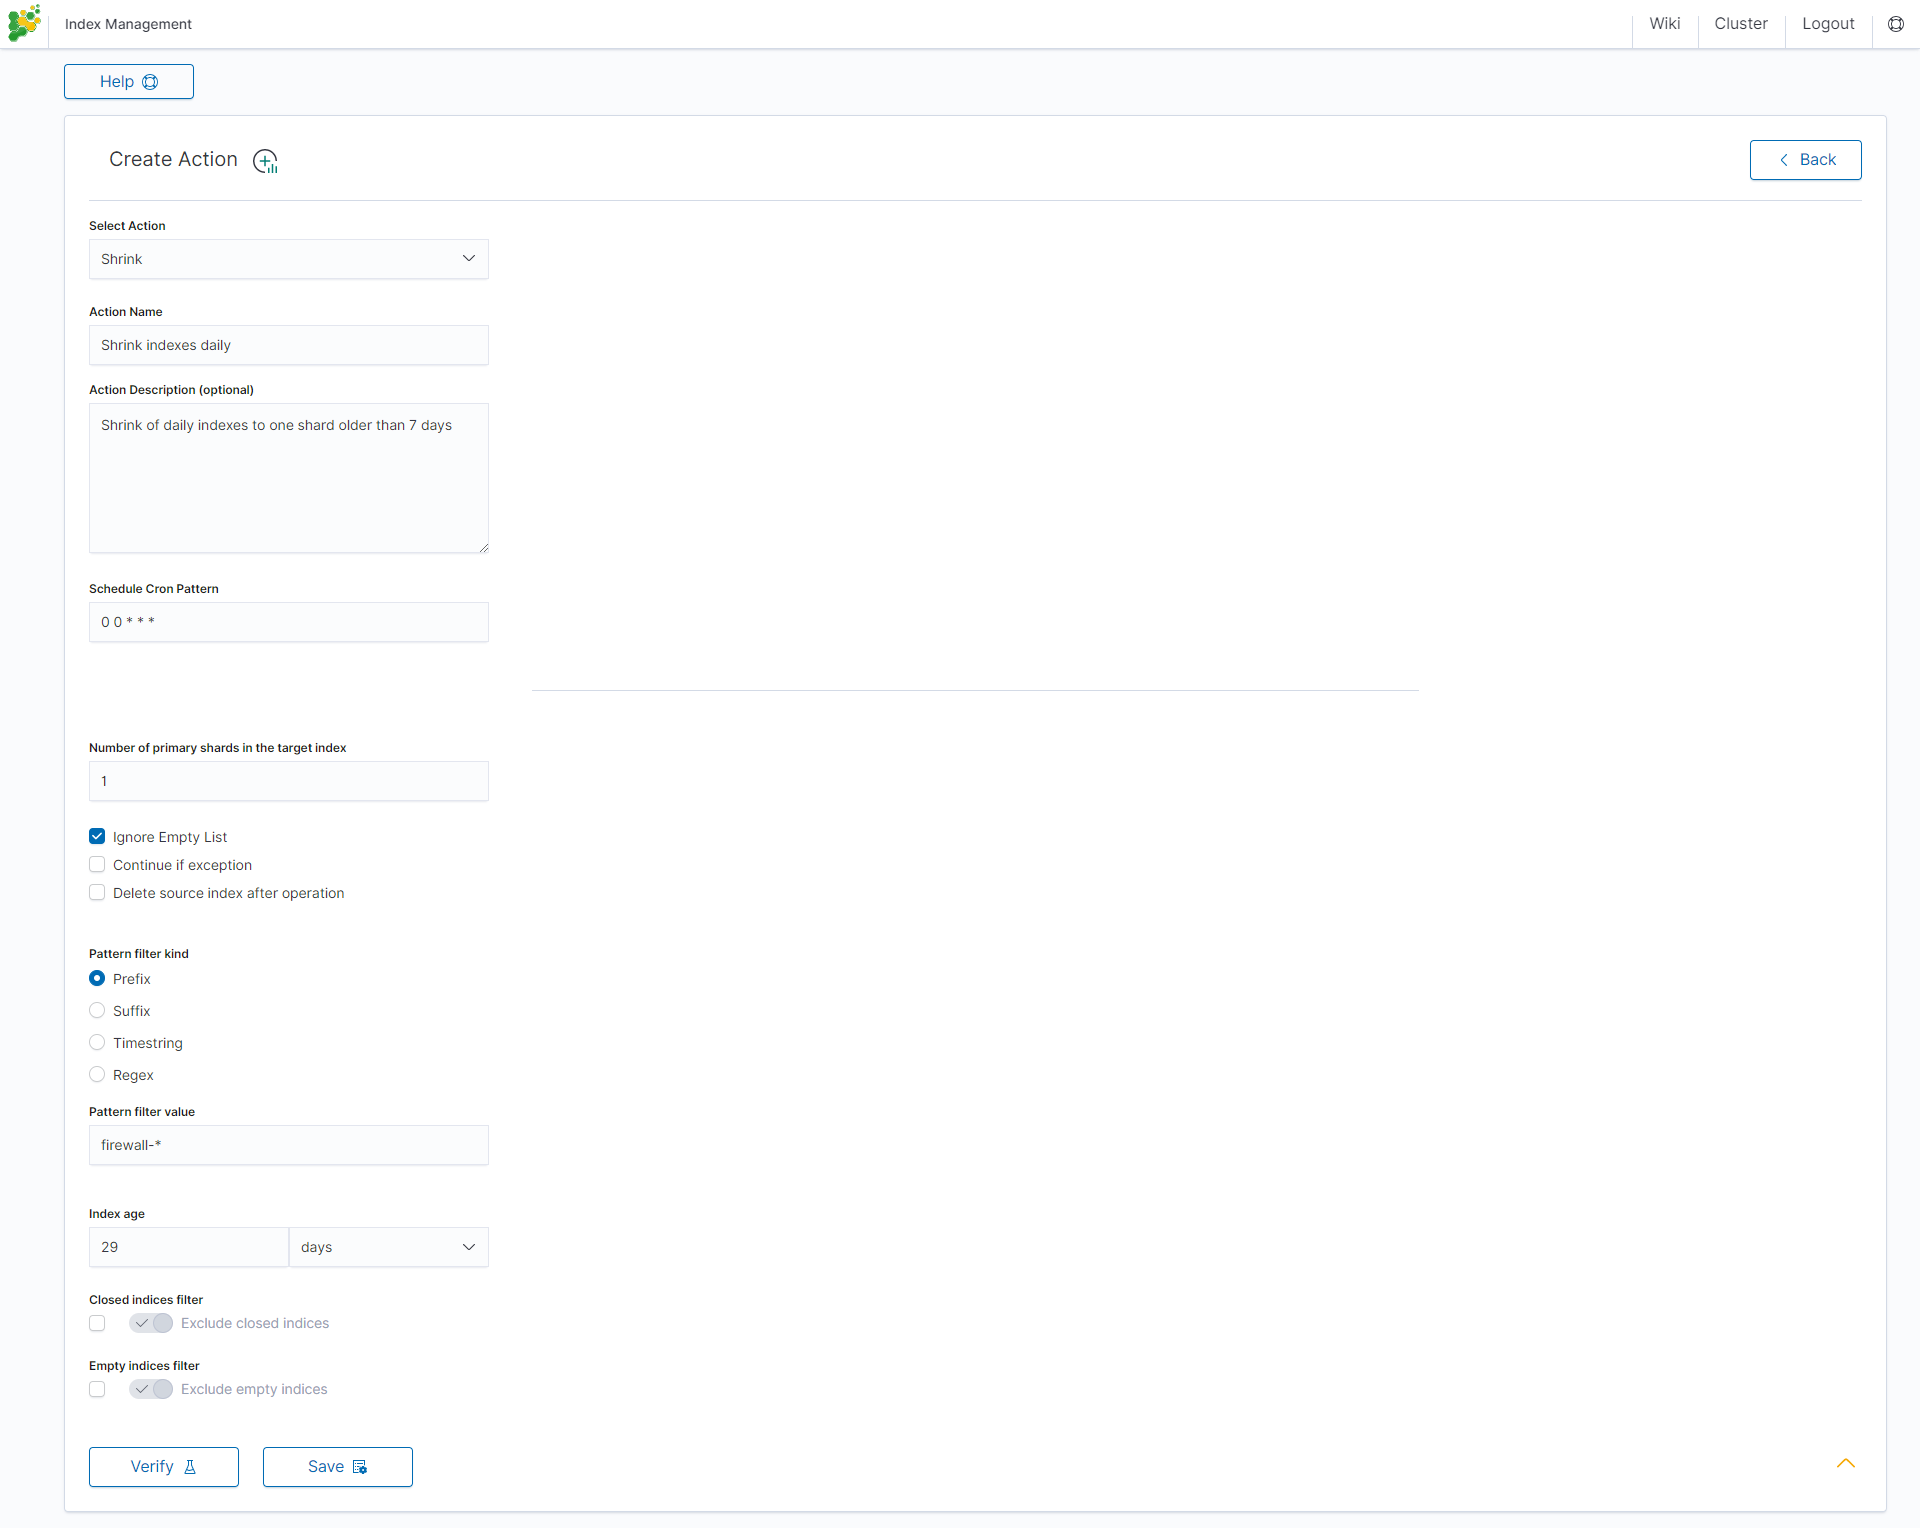
Shrink action
Shrinking an index is a good way to reduce the total shard count in your cluster.
Several conditions need to be met in order for index shrinking to take place:
- The index must be marked as read-only
- A (primary or replica) copy of every shard in the index must be relocated to the same node
- The cluster must have health green
- The target index must not exist
- The number of primary shards in the target index must be a factor of the number of primary shards in the source index.
- The source index must have more primary shards than the target index.
- The index must not contain more than 2,147,483,519 documents in total across all shards that will be shrunk into a single shard on the target index as this is the maximum number of docs that can fit into a single shard.
- The node handling the shrink process must have sufficient free disk space to accommodate a second copy of the existing index.
Task will try to meet these conditions. If it is unable to meet them all, it will not perform a shrink operation.
Settings required:
- Action Name
- Schedule Cron Pattern - it sets when the task is to be executed, to decode cron format use on-line tool: https://crontab.guru/,
- Number of primary shards in the target indexs - it sets the number of shared for the target index,
- Pattern filter kind - it sets the index filtertype for the task,
- Pattern filter value - it sets value for the index filter,
- Index age - it sets index age for the task.
Optional settings:
- Ignore Empty List
- Continue if exception
- Delete source index after operation
- Closed indices filter
- Empty indices filter
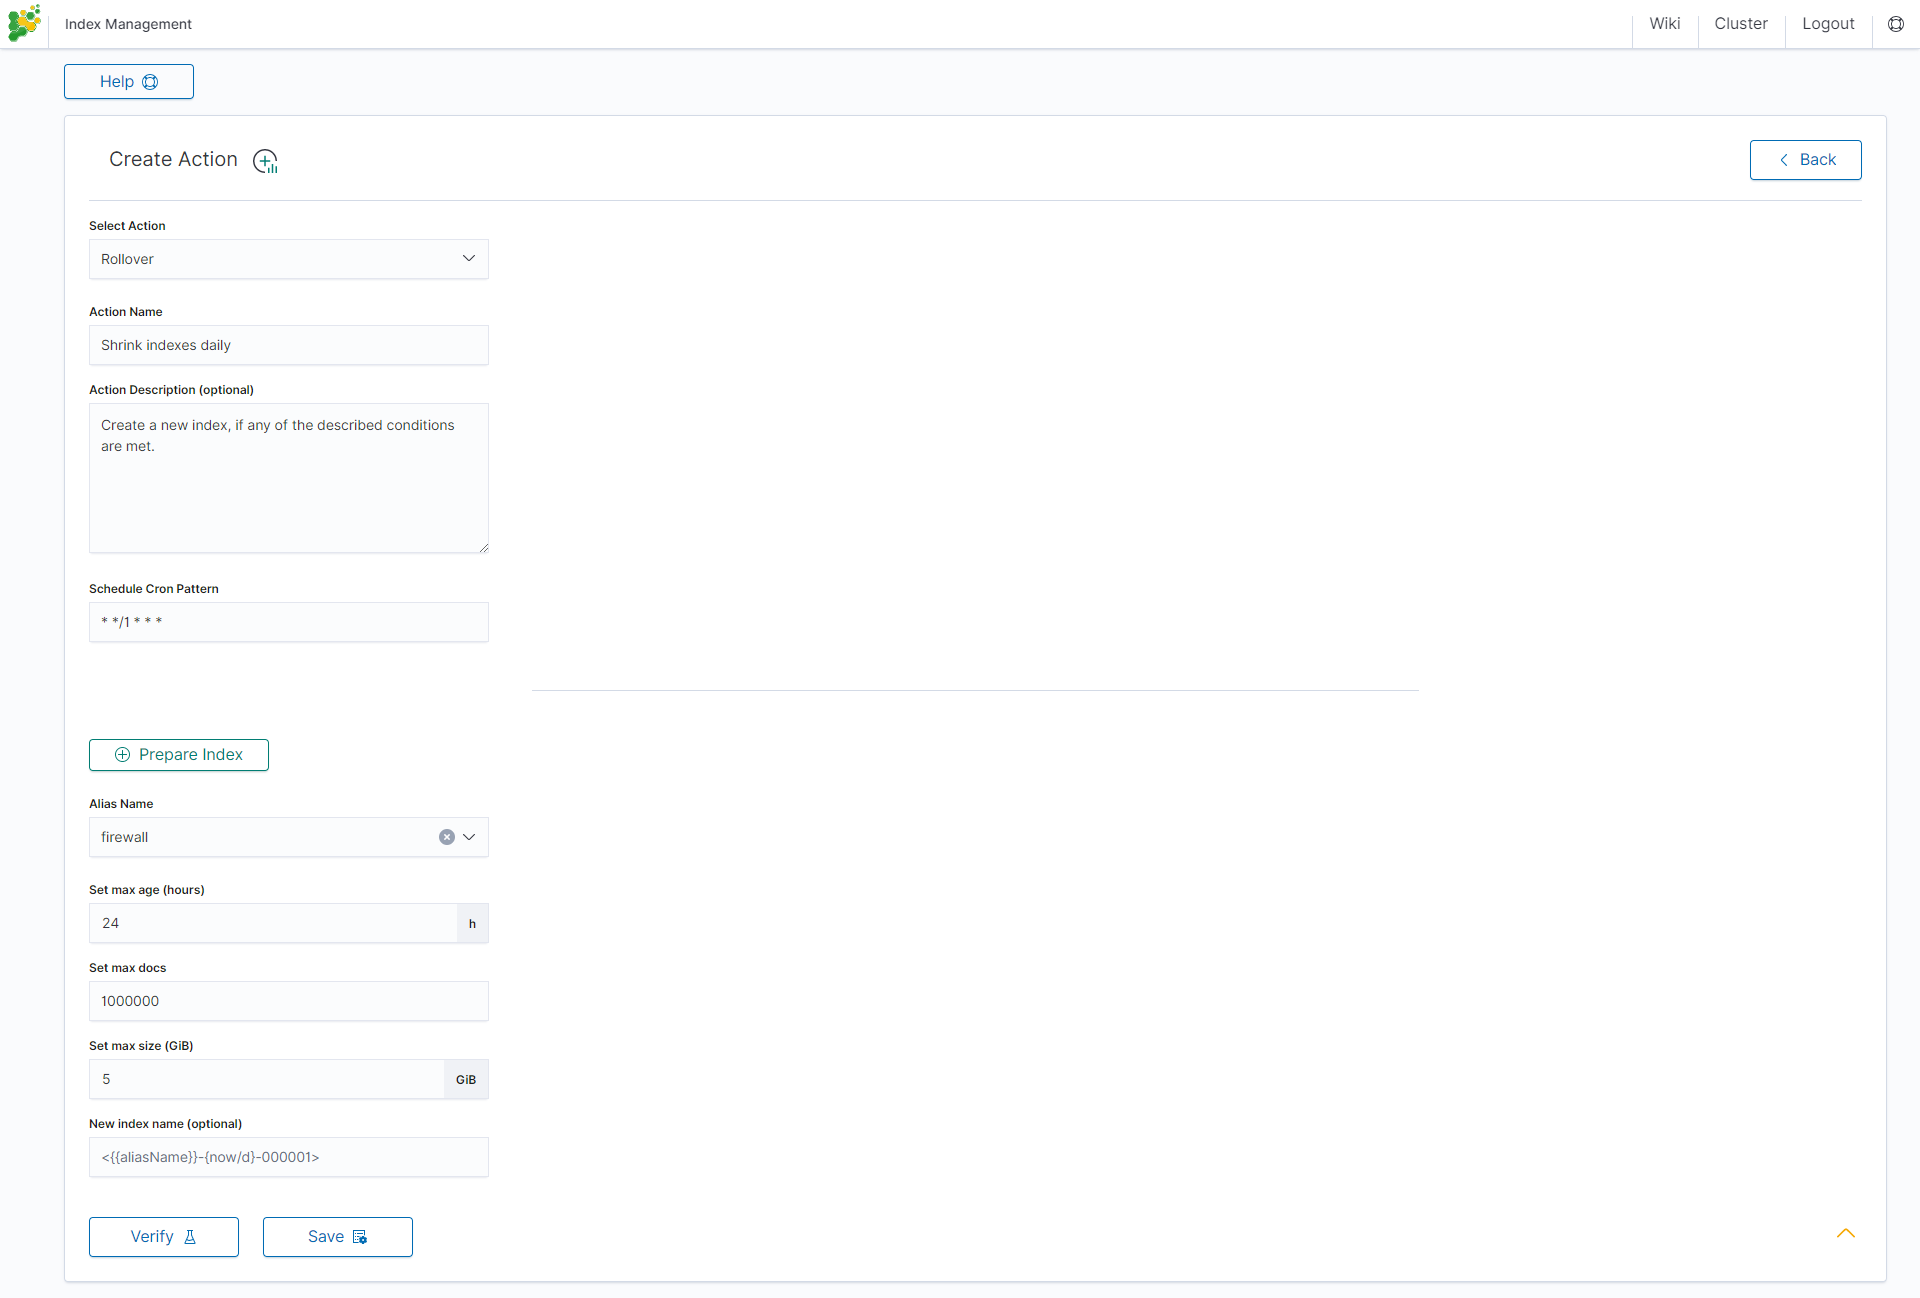
Rollover action
This action uses the Elasticsearch Rollover API to create a new index, if any of the described conditions are met.
Settings required:
- Action Name
- Schedule Cron Pattern - it sets when the task is to be executed, to decode cron format use on-line tool: https://crontab.guru/,
- Alias Name - it sets alias for index,
- Set max age (hours) - it sets age for index after then index will rollover,
- Set max docs - it sets number of documents for index after which index will rollover,
- Set max size (GiB) - it sets index size in GB after which index will rollover.
Optional settings:
- New index name (optional)
Custom action
Additionally, the module allows you to define your own actions in line with the Curator documentation: https://www.elastic.co/guide/en/elasticsearch/client/curator/current/actions.html
To create a Custom action, select Custom from Select Action, enter a name in the Action Name field and set the schedule in the Schedule Cron Pattern field. In the edit field, enter the definition of a custom action:
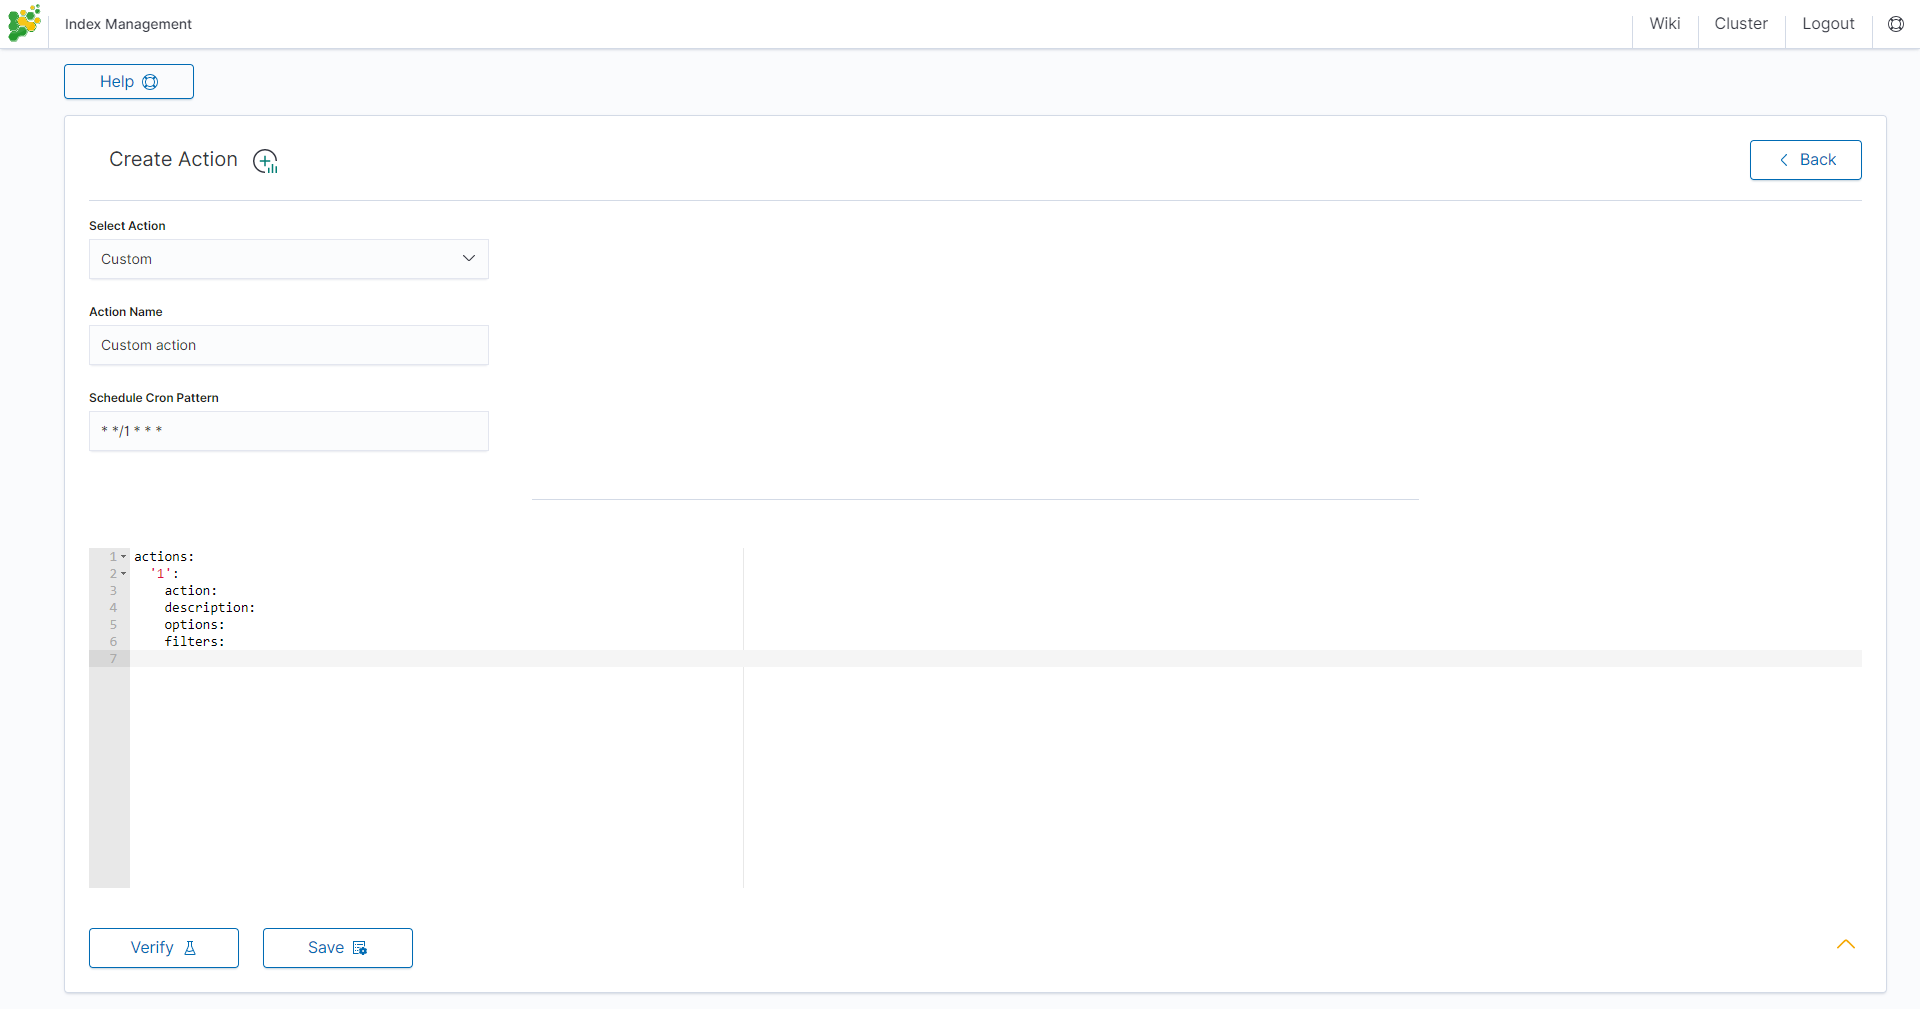
Custom Action examles:
Open index
actions:
  1:
    action: open
    description: >-
      Open indices older than 30 days but younger than 60 days (based on index
      name), for logstash- prefixed indices.
    options:
      timeout_override:
      continue_if_exception: False
      disable_action: True
    filters:
    - filtertype: pattern
      kind: prefix
      value: logstash-
      exclude:
    - filtertype: age
      source: name
      direction: older
      timestring: '%Y.%m.%d'
      unit: days
      unit_count: 30
      exclude:
    - filtertype: age
      source: name
      direction: younger
      timestring: '%Y.%m.%d'
      unit: days
      unit_count: 60
      exclude:
Replica reduce
actions:
  1:
    action: replicas
    description: >-
      Reduce the replica count to 0 for logstash- prefixed indices older than
      10 days (based on index creation_date)
    options:
      count: 0
      wait_for_completion: False
      timeout_override:
      continue_if_exception: False
      disable_action: True
    filters:
    - filtertype: pattern
      kind: prefix
      value: logstash-
      exclude:
    - filtertype: age
      source: creation_date
      direction: older
      unit: days
      unit_count: 10
      exclude:
Index allocation
actions:
  1:
    action: allocation
    description: >-
      Apply shard allocation routing to 'require' 'tag=cold' for hot/cold node
      setup for logstash- indices older than 3 days, based on index_creation
      date
    options:
      key: tag
      value: cold
      allocation_type: require
      disable_action: True
    filters:
    - filtertype: pattern
      kind: prefix
      value: logstash-
    - filtertype: age
      source: creation_date
      direction: older
      unit: days
      unit_count: 3
Cluster routing
  1:
    action: cluster_routing
    description: >-
      Disable shard routing for the entire cluster.
    options:
      routing_type: allocation
      value: none
      setting: enable
      wait_for_completion: True
      disable_action: True
  2:
    action: (any other action details go here)
    ...
  3:
    action: cluster_routing
    description: >-
      Re-enable shard routing for the entire cluster.
    options:
      routing_type: allocation
      value: all
      setting: enable
      wait_for_completion: True
      disable_action: True
Intelligence Module
A dedicated artificial intelligence module has been built in the Energy Logserver system that allows prediction of parameter values relevant to the maintenance of infrastructure and IT systems. Such parameters include:
- use of disk resources,
- use of network resources,
- using the power of processors
- detection of known incorrect behaviour of IT systems
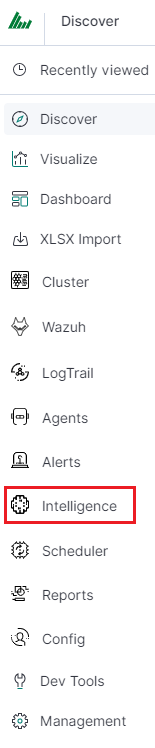
To access of the Intelligence module, click the tile icon from the main meu bar and then go to the „Intelligence” icon (To go back, click to the „Search” icon).
There are 4 screens available in the
module:
- Create AI Rule - the screen allows you to create artificial intelligence rules and run them in scheduler mode or immediately
- AI Rules List - the screen presents a list of created artificial intelligence rules with the option of editing, previewing and deleting them
- AI Learn - the screen allows to define the conditions for teaching the MLP neural network
- AI Learn Tasks - a screen on which the initiated and completed learning processes of neural networks with the ability to preview learning results are presented.# Create AI Rule #
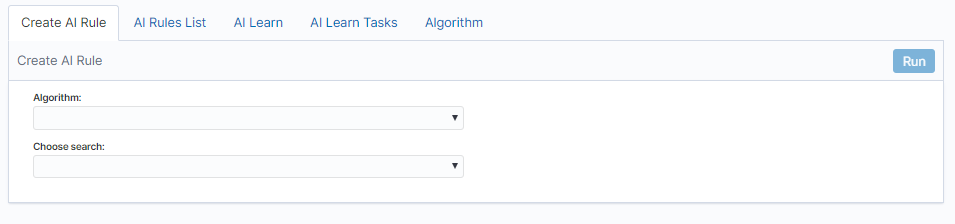
To create the AI Rule, click on the tile icon from the main menu bar, go to the „Intelligence” icon and select “Create AI Rule” tab. The screen allows to defining the rules of artificial intelligence based on one of the available algorithms (a detailed description of the available algorithms is available in a separate document).
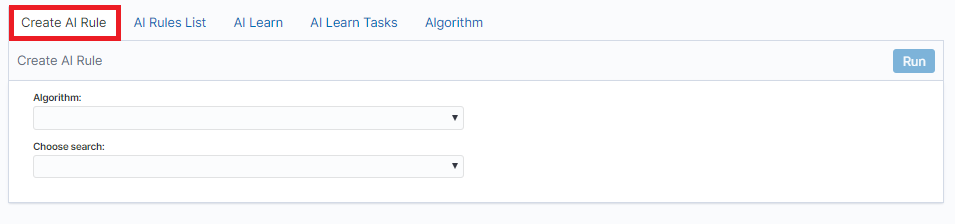
Description of the controls available on the fixed part of screen:
- Algorithm - the name of the algorithm that forms the basis of the artificial intelligence rule
- Choose search - search defined in the Energy Logserver system, which is used to select a set of data on which the artificial intelligence rule will operate
- Run - a button that allows running the defined AI rule or saving it to the scheduler and run as planned
The rest of the screen will depend on the chosen artificial intelligence algorithm.
The fixed part of the screen
Description of the controls available on the fixed part of screen:
- Algorithm - the name of the algorithm that forms the basis of the artificial intelligence rule
- Choose search - search defined in the Energy Logserver system, which is used to select a set of data on which the artificial intelligence rule will operate
- Run - a button that allows running the defined AI rule or saving it to the scheduler and run as planned
The rest of the screen will depend on the chosen artificial intelligence algorithm.
Screen content for regressive algorithms
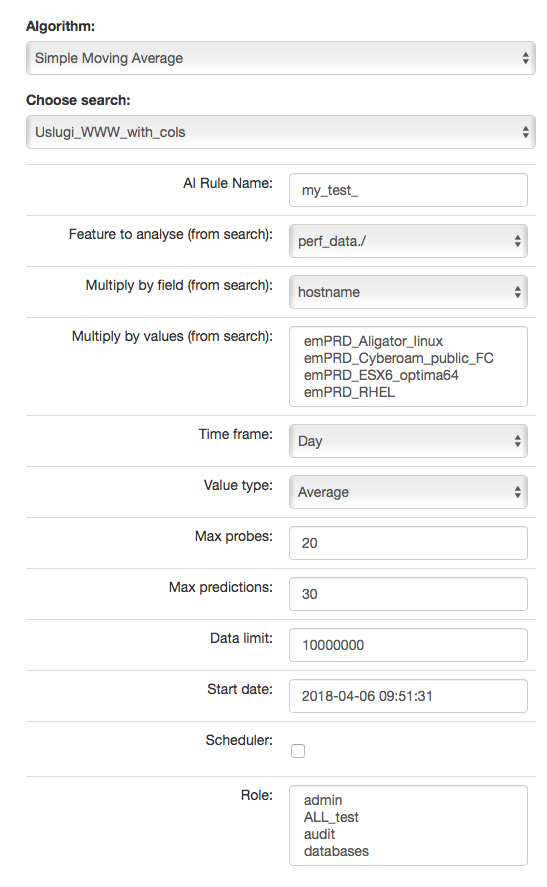
Description of controls:
- feature to analyze from search - analyzed feature (dictated)
- multiply by field - enable multiplication of algorithms after unique values of the feature indicated here. Multiplication allows you to run the AI rule one for e.g. all servers. The value “none” in this field means no multiplication.
- multiply by values - if a trait is indicated in the „multiply by field”, then unique values of this trait will appear in this field. Multiplications will be made for the selected values. If at least one of value is not selected, the „Run” buttons will be inactive.`
In other words, multiplication means performing an analysis for many values from the indicated field, for example: sourece_node_host- which we indicate in Multiply by field (from search).
However, in Multiply by values (from search) we already indicate values of this field for which the analysis will be performed, for example: host1, host2, host3, ….
- time frame - feature aggregation method (1 minute, 5 minute, 15 minute, 30 minute, hourly, weekly, monthly, 6 months, 12 months)
- max probes - how many samples back will be taken into account for analysis. A single sample is an aggregated data according to the aggregation method.
- value type - which values to take into account when aggregating for a given time frame (e.g. maximum from time frame, minimum, average)
- max predictions - how many estimates we make for ahead (we take time frame)
- data limit - limits the amount of date downloaded from the source. It speeds up processing but reduces its quality
- start date - you can set a date earlier than the current date in order to verify how the selected algorithm would work on historical data
- Scheduler - a tag if the rule should be run according to the plan for the scheduler. If selected, additional fields will appear;
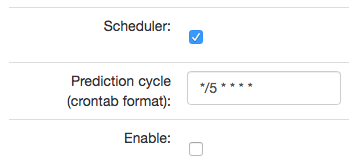
- Prediction cycle - plan definition for the scheduler, i.e. the cycle in which the prediction rule is run (e.g. once a day, every hour, once a week). In the field, enter the command that complies with the cron standard. Enable – whether to immediately launch the scheduler plan or save only the definition
- Role - only users with the roles selected here and the administrator will be able to run the defend AI rules The selected „time frame” also affects the prediction period. If we choose “time frame = monthly”, we will be able to predict a one month ahead from the moment of prediction (according to the “prediction cycle” value)
Screen content for the Trend algorithm
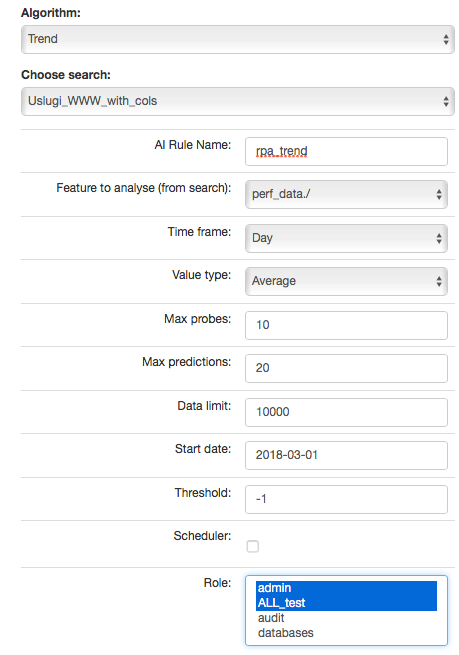
Description of controls:
- feature to analyze from search - analyzed feature (dictated)
- multiply by field - enable multiplication of algorithms after unique values of the feature indicated here. Multiplication allows you to run the AI rule one for e.g. all servers. The value “none” in this field means no multiplication.
- multiply by values - if a trait is indicated in the „multiply by field”, then unique values of this trait will appear in this field. Multiplications will be made for the selected values. If at least one of value is not selected, the „Run” buttons will be inactive.`
In other words, multiplication means performing an analysis for many values from the indicated field, for example: sourece_node_host- which we indicate in Multiply by field (from search).
However, in Multiply by values (from search) we already indicate values of this field for which the analysis will be performed, for example: host1, host2, host3, ….
- time frame - feature aggregation method (1 minute, 5 minute, 15 minute, 30 minute, hourly, weekly, monthly, 6 months, 12 months)
- max probes - how many samples back will be taken into account for analysis. A single sample is an aggregated data according to the aggregation method.
- value type - which values to take into account when aggregating for a given time frame (e.g. maximum from time frame, minimum, average)
- max predictions - how many estimates we make for ahead (we take time frame)
- data limit - limits the amount of date downloaded from the source. It speeds up processing but reduces its quality
- start date - you can set a date earlier than the current date in order to verify how the selected algorithm would work on historical data
- Scheduler - a tag if the rule should be run according to the plan for the scheduler. If selected, additional fields will appear;
- Prediction cycle - plan definition for the scheduler, i.e. the cycle in which the prediction rule is run (e.g. once a day, every hour, once a week). In the field, enter the command that complies with the cron standard. Enable – whether to immediately launch the scheduler plan or save only the definition
- Role - only users with the roles selected here and the administrator will be able to run the defend AI rules The selected „time frame” also affects the prediction period. If we choose “time frame = monthly”, we will be able to predict a one month ahead from the moment of prediction (according to the “prediction cycle” value)
- Threshold - default values -1 (do not search). Specifies the algorithm what level of exceeding the value of the feature „feature to analyze from cheese” is to look for. The parameter currently used only by the “Trend” algorithm.
Screen content for the neural network (MLP) algorithm
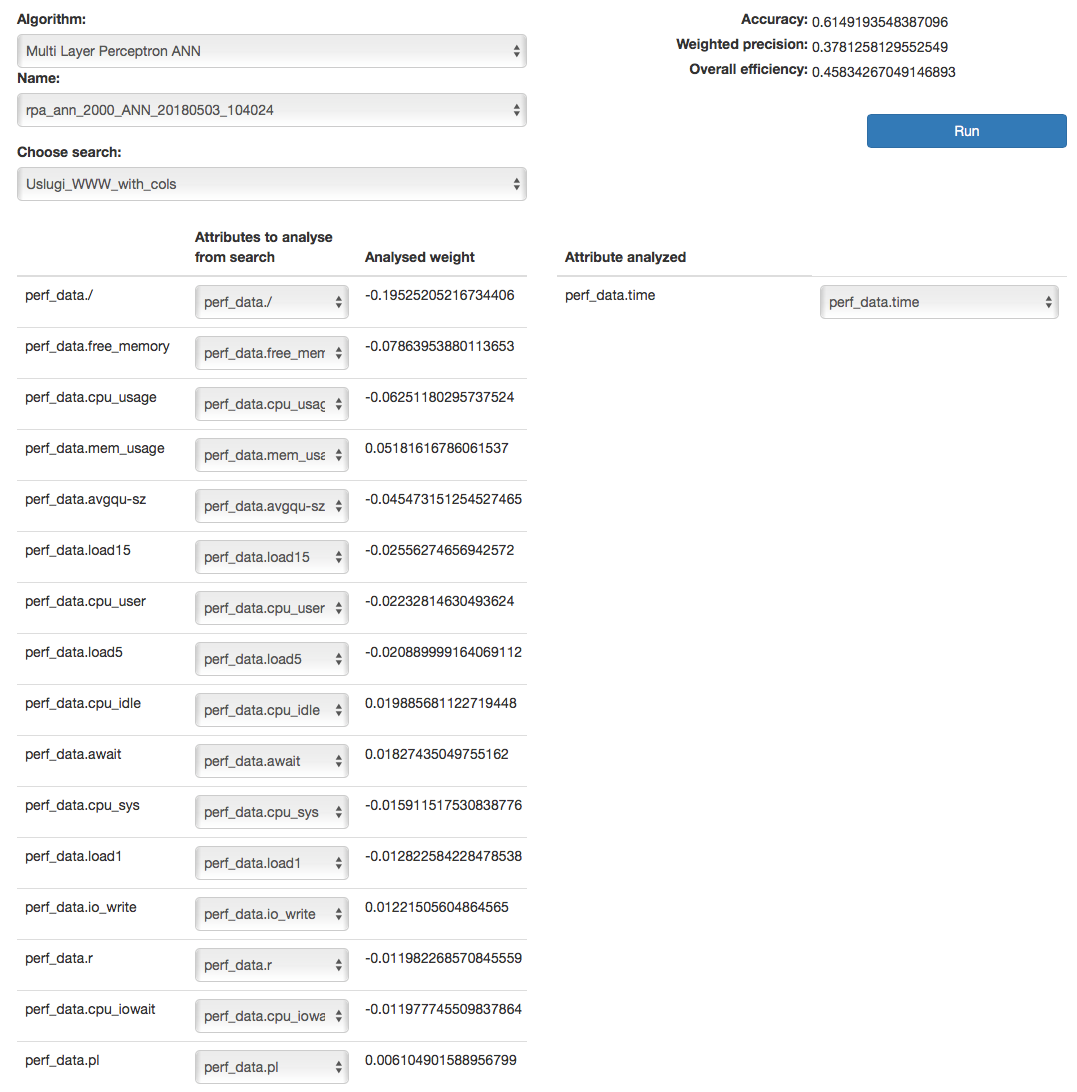
Descriptions of controls:
- Name - name of the learned neural network
- Choose search - search defined in Energy Logserver, which is used to select a set of data on which the rule of artificial intelligence will work
- Below, on the left, a list of attributes and their weights based on teaching ANN will be defined during the teaching. The user for each attribute will be able to indicate the field from the above mentioned search, which contain the values of the attribute and which will be analyzed in the algorithm. The presented list (for input and output attributes) will have a static and dynamic part. Static creation by presenting key with the highest weights. The key will be presented in the original form, i.e. perf_data./ The second part is a DropDown type list that will serve as a key update according to the user’s naming. On the right side, the attribute will be examined in a given rule / pattern. Here also the user must indicate a specific field from the search. In both cases, the input and output are narrowed based on the search fields indicated in Choose search.
- Data limit - limits the amount of data downloaded from the source. It speeds up the processing, but reduces its quality.
- Scheduler - a tag if the rule should be run according to the plan or the scheduler. If selected, additional fields will appear:
- Prediction cycle - plan definition for the scheduler, i.e. the cycle in which the prediction rule is run (e.g. once a day, every hour, once a week). In the field, enter the command that complies with the cron standard
- Enable - whether to immediately launch the scheduler plan or save only the definition
- Role - only users with the roles selected here and the administrator will be able to run the defined AI rules
AI Rules List
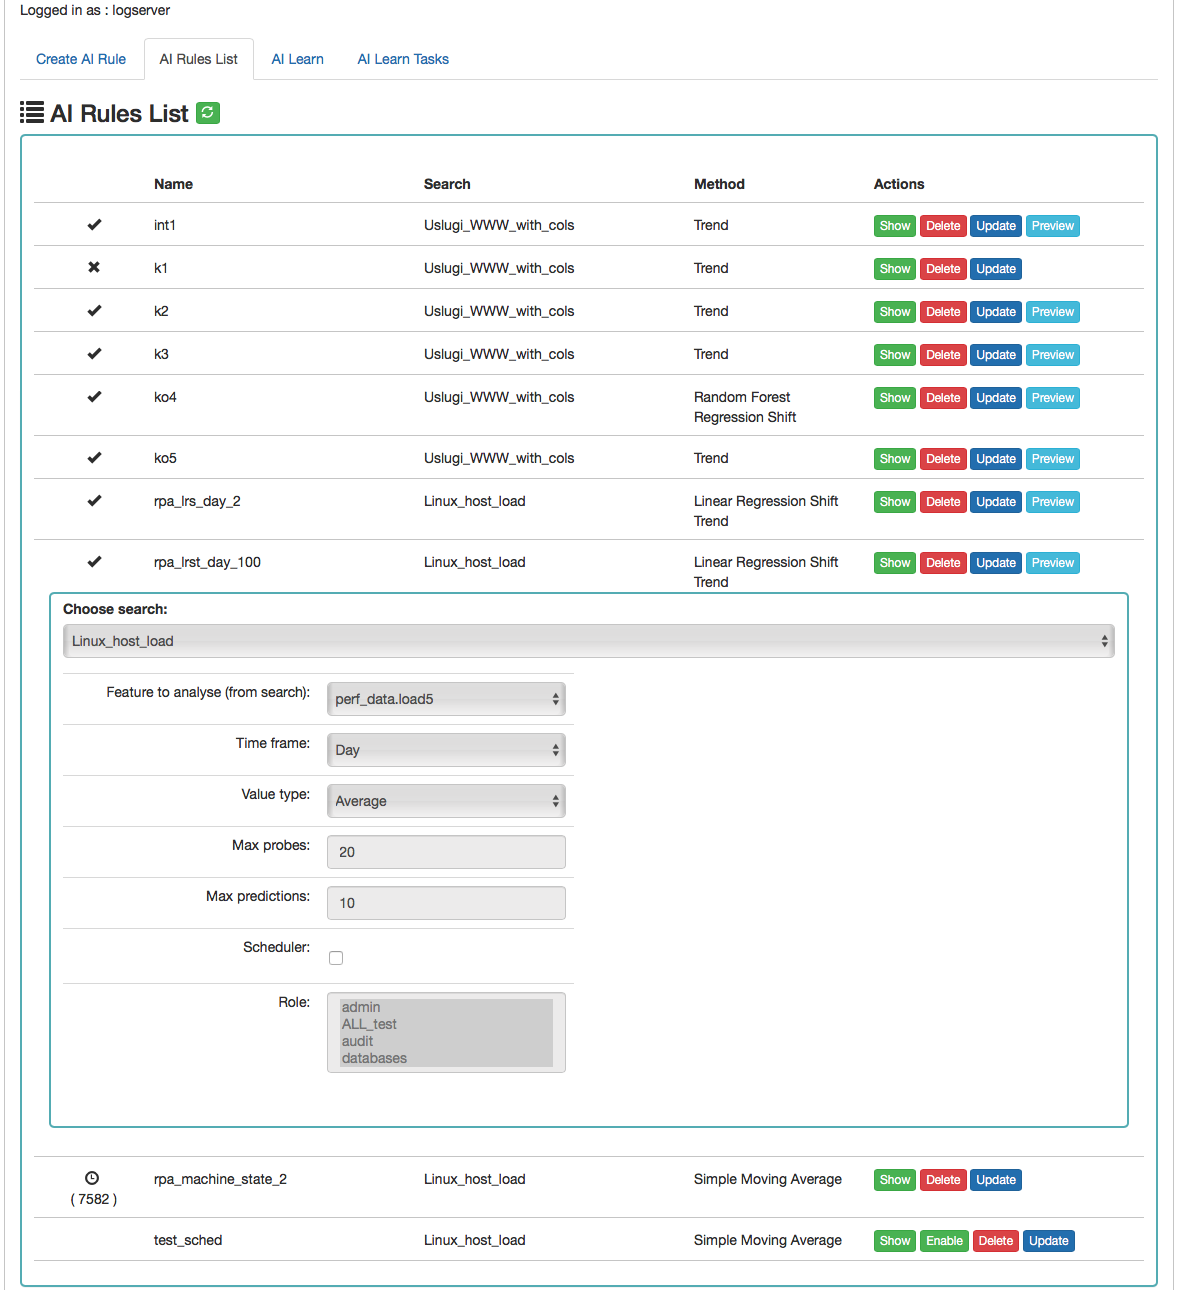
Column description:
- Status:
 - the process is being processed (the pid of the process is in brackets)
 - process completed correctly
 - the process ended with an error
- Name - the name of the rule
- Search - the search on which the rule was run
- Method - an algorithm used in the AI rule
- Actions - allowed actions:
- Show - preview of the rule definition
- Enable/Disable - rule activation /deactivation
- Delete - deleting the rule
- Update - update of the rule definition
- Preview - preview of the prediction results (the action is available after the processing has been completed correctly).
AI Learn
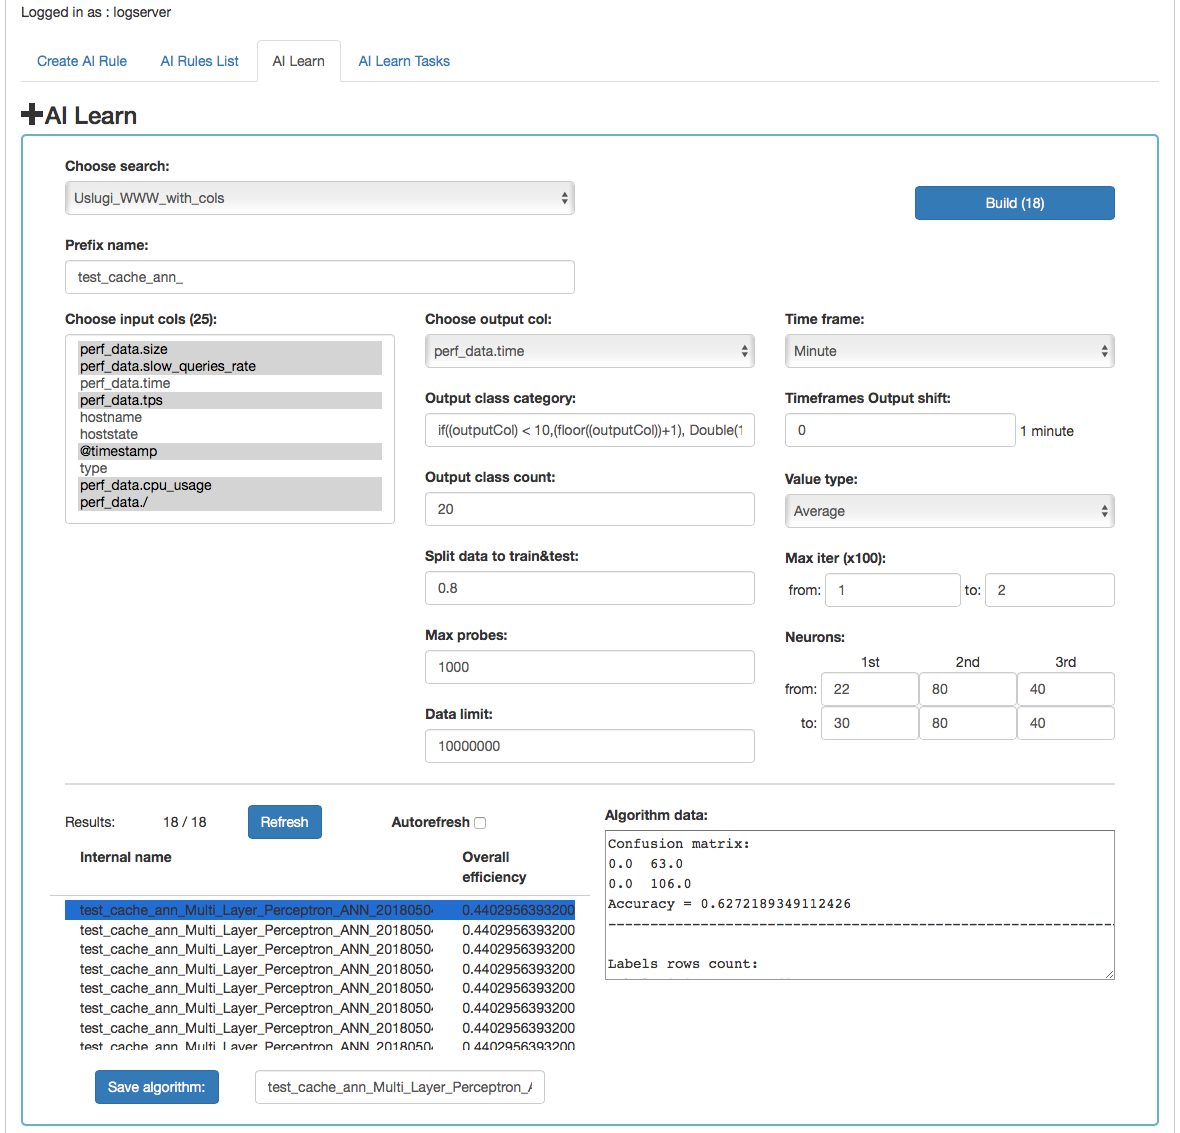
Description of controls:
- Search - a source of data for teaching the network
- prefix name - a prefix added to the id of the learned model that allows the user to recognize the model
- Input cols - list of fields that are analyzed / input features. Here, the column that will be selected in the output col should not be indicated. Only those columns that are related to processing should be selected. **
- Output col - result field, the recognition of which is learned by the network. This field should exist in the learning and testing data, but in the production data is unnecessary and should not occur. This field cannot be on the list of selected fields in “input col”.
- Output class category - here you can enter a condition in SQL
format to limit the number of output categories e.g.
if((outputCol) \< 10,(floor((outputCol))+1), Double(10)). This condition limits the number of output categories to 10. Such conditions are necessary for fields selected in “output col” that have continuous values. They must necessarily by divided into categories. In the Condition, use your own outputCol name instead of the field name from the index that points to the value of the “output col” attribute. - Time frame - a method of aggregation of features to improve their quality (e.g. 1 minute, 5 minutes, 15 minutes, 30 minutes, 1 hour, 1 daily).
- Time frames output shift - indicates how many time frame units to move the output category. This allows teaching the network with current attributes, but for categories for the future.
- Value type - which values to take into account when aggregating for a given time frame (e.g. maximum from time frame, minimum, average)
- Output class count- the expected number of result classes. If during learning the network identifies more classes than the user entered, the process will be interrupted with an error, therefore it is better to set up more classes than less, but you have to keep in mind that this number affects the learning time.
- Neurons in first hidden layer (from, to) - the number of neurons in the first hidden layer. Must have a value > 0. Jump every 1.
- Neurons in second hidden layer (from, to) - the number of neurons in second hidden layer. If = 0, then this layer is missing. Jump every 1.
- Neurons in third hidden layer (from, to) - the number of neurons in third hidden layer. If = 0 then this layer is missing. Jump every 1.
- Max iter (from, to) - maximum number of network teaching repetitions (the same data is used for learning many times in internal processes of the neural network). The slower it is. Jump every 100. The maximum value is 10, the default is 1.
- Split data to train&test - for example, the entered value of 0.8 means that the input data for the network will be divided in the ratio 0.8 to learning, 0.2 for the tests of the network learned.
- Data limit - limits the amount of data downloaded from the source. It speeds up the processing, but reduces its quality.
- Max probes - limits the number of samples taken to learn the network. Samples are already aggregated according to the selected “Time frame” parameter. It speed up teaching but reduces its quality.
- Build - a button to start teaching the network. The button contains the number of required teaching curses. You should be careful and avoid one-time learning for more than 1000 courses. It is better to divide them into several smaller ones. One pass after a full data load take about 1-3 minutes on a 4 core 2.4.GHz server. The module has implemented the best practices related to the number of neurons in individual hidden layers. The values suggested by the system are optimal from the point of view of these practices, but the user can decide on these values himself.
Under the parameters for learning the network there is an area in which teaching results will appear.
After pressing the “Refresh” button, the list of the resulting models will be refreshed.
Autorefresh - selecting the field automatically refreshes the list of learning results every 10s.
The following information will be available in the table on the left:
- Internal name - the model name given by the system, including the user - specified prefix
- Overall efficiency - the network adjustment indicator - allow to see at a glance whether it is worth dealing with the model. The grater the value, the better.
After clicking on the table row, detailed data collected during the learning of the given model will be displayed. This data will be visible in the box on the right.
The selected model can be saved under its own name using the “Save algorithm” button. This saved algorithm will be available in the “Choose AI Rule” list when creating the rule (see Create AI Rule).
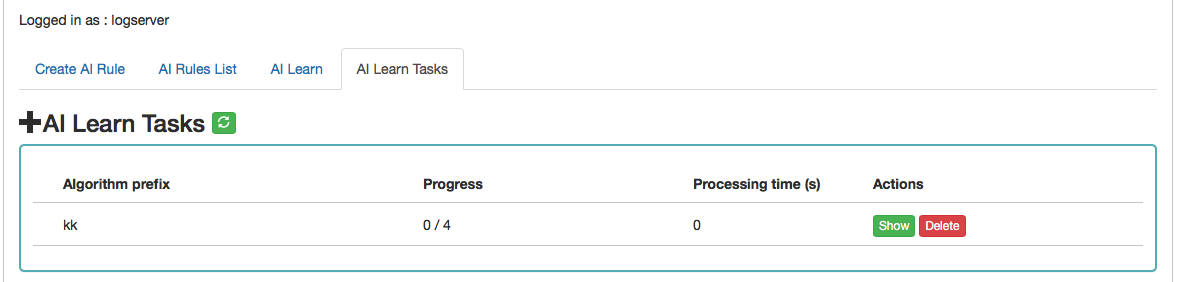
AI Learn Tasks
The “AI Learn Task” tab shows the list of processes initiated teaching the ANN network with the possibility of managing processes.
Each user can see only the process they run. The user in the role of Intelligence sees all running processes.
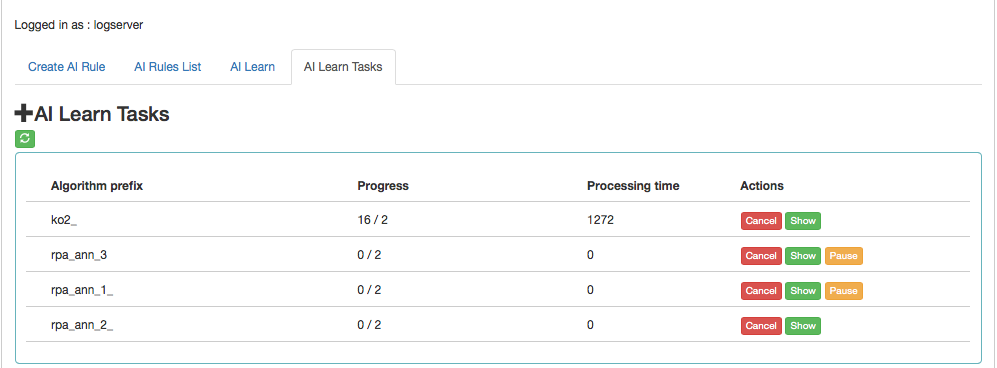
Description of controls:
- Algorithm prefix - this is the value set by the user on the AI Learn screen in the Prefix name field
- Progress - here is the number of algorithms generated / the number of all to be generated
- Processing time - duration of algorithm generation in seconds (or maybe minutes or hours)
- Actions:
- Cancel - deletes the algorithm generation task (user require confirmation of operation)
- Pause / Release - pause / resume algorithm generation process.
AI Learn tab contain the Show in the preview mode of the ANN hyperparameters After completing the learning activity or after the user has interrupted it, the “Delete” button appears in “Action” field. This button allows you to permanently delete the learning results of a specific network.
Scenarios of using algorithms implemented in the Intelligence module
Teaching MLP networks and choosing the algorithm to use:
- Go to the AI Learn tab,
- We introduce the network teaching parameters,
- Enter your own prefix for the names of the algorithms you have learned,
- Press Build.
- We observe the learned networks on the list (we can also stop the observation at any moment and go to other functions of the system. We will return to the learning results by going to the AI Learn Tasks tab and clicking the show action),
- We choose the best model from our point of view and save it under our own name,
- From this moment the algorithm is visible in the Create AI Rule tab.
Starting the MLP network algorithm:
- Go to the Create AI Rule tab and create rules,
- Select the previously saved model of the learned network,
- Specify parameters visible on the screen (specific to MLP),
- Press the Run button.
Starting regression algorithm:
- Go to the Create AI Rule tab and create rules,
- We choose AI Rule, e.g. Simple Moving Average, Linear Regression or Random Forest Regression, etc.,
- Enter your own rule name (specific to regression),
- Set the parameters of the rule ( specific to regression),
- Press the Run button.
Management of available rules:
- Go to the AI Rules List tab,
- A list of AI rules available for our role is displayed,
- We can perform the actions available on the right for each rule.# Results of algorithms #
The results of the “AI algorithms” are saved to the index „intelligence” specially created for this purpose. The index with the prediction result. These following fields are available in the index (where xxx is the name of the attribute being analyzed):
- xxx_pre - estimate value
- xxx_cur - current value at the moment of estimation
- method_name - name of the algorithm used
- rmse - avarage square error for the analysis in which _cur values were available. The smaller the value, the better.
- rmse_normalized - mean square error for the analysis in which _cur values were available, normalized with _pre values. The smaller the value, the better.
- overall_efficiency - efficiency of the model. The greater the value, the better. A value less than 0 may indicate too little data to correctly calculate the indicator
- linear_function_a - directional coefficient of the linear function y = ax + b. Only for the Trend and Linear Regression Trend algorithm
- linear_function_b - the intersection of the line with the Y axis for the linear function y = ax + b. Only for the Trend and Linear Regression Trend algorithm.
Visualization and signals related to the results of data analysis should be created from this index. The index should be available to users of the Intelligence module.
Permission
Permission have been implemented in the following way:
- Only the user in the admin role can create / update rules.
- When creating rules, the roles that will be able to enables / disengage / view the rules will be indicated.
We assume that the Learn process works as an administrator.
We assume that the visibility of Search in AI Learn is preceded by receiving the search permission in the module object permission.
The role of “Intelligence” launches the appropriate tabs.
An ordinary user only sees his models. The administrator sees all models.
Register new algorithm
For register new algorithm:
- Login to the Energy Logserver
- Select Intelligence
- Select Algorithm
- Fill Create algorithm form and press Submit button
Form fields:
| Field   | Description                                                                                                      |
|---------|------------------------------------------------------------------------------------------------------------------|
| Code    | Short name for algorithm                                                                                         |
| Name    | Algorithm name                                                                                                   |
| Command | Command to execute. The command must be in the directory pointed to by the parameter elastscheduler.commandpath. |
Energy Logserver execute command:
<command> <config> <error file> <out file>
Where:
- command - Command from command filed of Create algorithm form.
- config - Full path of json config file. The name of file is id of process status document in index .intelligence_rules
- error file - Unique name for error file. Not used by predefined algorithms.
- out file - Unique name for output file. Not used by predefined algorithms.
Config file:
Json document:
| Field                  | Value                                                                               | Screen field (description)                                           |
|------------------------|-------------------------------------------------------------------------------------|----------------------------------------------------------------------|
| algorithm_type         | GMA, GMAL, LRS, LRST, RFRS, SMAL, SMA, TL                                           | Algorithm. For customs method field Code from Create algorithm form. |
| model_name             | Not empty string.                                                                   | AI Rule Name.                                                        |
| search                 | Search id.                                                                          | Choose search.                                                       |
| label_field.field      |                                                                                     | Feature to analyse.                                                  |
| max_probes             | Integer value                                                                       | Max probes                                                           |
| time_frame             | 1 minute, 5 minutes, 15 minutes, 30 minutes, 1 hour, 1 day, 1 week, 30 day, 365 day | Time frame                                                           |
| value_type             | min, max, avg, count                                                                | Value type                                                           |
| max_predictions        | Integer value                                                                       | Max predictions                                                      |
| threshold              | Integer value                                                                       | Threshold                                                            |
| automatic_cron         | Cron format string                                                                  | Automatic cycle                                                      |
| automatic_enable       | true/false                                                                          | Enable                                                               |
| automatic              | true/false                                                                          | Automatic                                                            |
| start_date             | YYYY-MM-DD HH:mm or now                                                             | Start date                                                           |
| multiply_by_values     | Array of string values                                                              | Multiply by values                                                   |
| multiply_by_field      | None or full field name eg.: system.cpu                                             | Multiply by field                                                    |
| selectedroles          | Array of roles name                                                                 | Role                                                                 |
| last_execute_timestamp |                                                                                     | Last execute                                                         |

| Not screen fields     |                                     |
|-----------------------|-------------------------------------|
| preparation_date      | Document preparation date.          |
| machine_state_uid     | AI rule machine state uid.          |
| path_to_logs          | Path to ai machine logs.            |
| path_to_machine_state | Path to ai machine state files.     |
| searchSourceJSON      | Query string.                       |
| processing_time       | Process operation time.             |
| last_execute_mili     | Last executed time in milliseconds. |
| pid                   | Process pid if ai rule is running.  |
| exit_code             | Last executed process exit code.    |
The command must update the process status document in the system during operation. It is elastic partial document update.
| Process status | Field (POST body) | Description |
|------------------------|----------------------------|------------------------------------------------|
| START | doc.pid | System process id |
| | doc.last_execute_timestamp | Current timestamp. yyyy-MM-dd HH:mm |
| | doc.last_execute_mili | Current timestamp in millisecunds. |
| END PROCESS WITH ERROR | doc.error_description | Error description. |
| | doc.error_message | Error message. |
| | doc.exit_code | System process exit code. |
| | doc.pid | Value 0. |
| | doc.processing_time | Time of execute process in seconds. |
| END PROCESS OK | doc.pid | Value 0. |
| | doc.exit_code | System process exit code. Value 0 for success. |
| | doc.processing_time | Time of execute process in seconds. |
The command must insert data for prediction chart.
| Field             | Value             | Description                                            |
|-------------------|-------------------|--------------------------------------------------------|
| model_name        | Not empty string. | AI Rule Name.                                          |
| preparationUID    | Not empty string. | Unique prediction id                                   |
| machine_state_uid | Not empty string. | AI rule machine state uid.                             |
| model_uid         | Not empty string. | Model uid from config file                             |
| method_name       | Not empty string. | User friendly algorithm name.                          |
| <field>           | Json              | Field calculated. For example: system.cpu.idle.pct_pre |
Document sample:
		{
		  "_index": "intelligence",
		  "_type": "doc",
		  "_id": "emca_TL_20190304_080802_20190531193000",
		  "_version": 2,
		  "_score": null,
		  "_source": {
		    "machine_state_uid": "emca_TL_20190304_080802",
		    "overall_efficiency": 0,
		    "processing_time": 0,
		    "rmse_normalized": 0,
		    "predictionUID": "emca_TL_20190304_080802_20190531193000",
		    "linear_function_b": 0,
		    "@timestamp": "2019-05-31T19:30:00.000+0200",
		    "linear_function_a": 0.006787878787878788,
		    "system": {
		      "cpu": {
		        "idle": {
		          "pct_pre": 0.8213333333333334
		        }
		      }
		    },
		    "model_name": "emca",
		    "method_name": "Trend",
		    "model_uid": "emca_TL_20190304_080802",
		    "rmse": 0,
		    "start_date": "2019-03-04T19:30:01.279+0100"
		  },
		  "fields": {
		    "@timestamp": [
		      "2019-05-31T17:30:00.000Z"
		    ]
		  },
		  "sort": [
		    1559323800000
		  ]
		}
Archive
The Archive module allows you to create compressed data files (zstd) from Elasticsearch indexes. The archive checks the age of each document in the index and if it is older than defined in the job, it is copied to the archive file.
Configuration
Enabling module
To configure module edit kibana.yml configuration file end set path to the archive directory - location where the archive files will be stored:
vim /etc/kibana/kibana.yml
remove the comment from the following line and set the correct path to the archive directory:
archive.archivefolderpath: '/var/lib/elastic_archive_test'
Archive Task
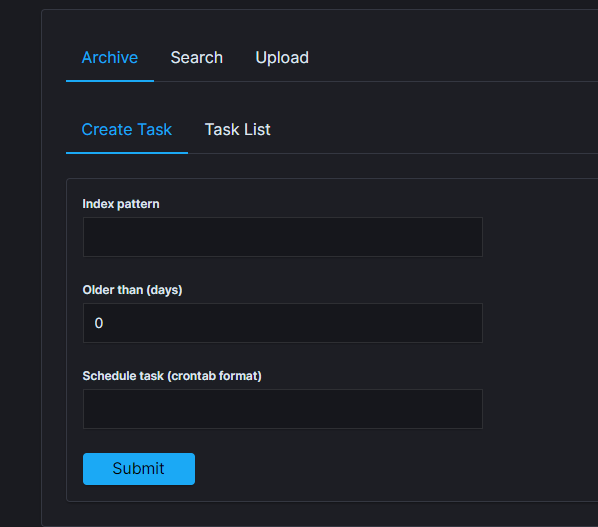
Create Archive task
From the main navigation go to the “Archvie” module.
On the “Archive” tab select “Create Task” and define the following parameters:
Index pattern- for the indexes that will be archive, for examplesyslog*;Older than (days)- number of days after which documents will be archived;Schedule task(crontab format) - the work schedule of the ordered task.
Task List
In the Task List you can follow the current status of ordered tasks. You can modify task scheduler or delete ordered task.
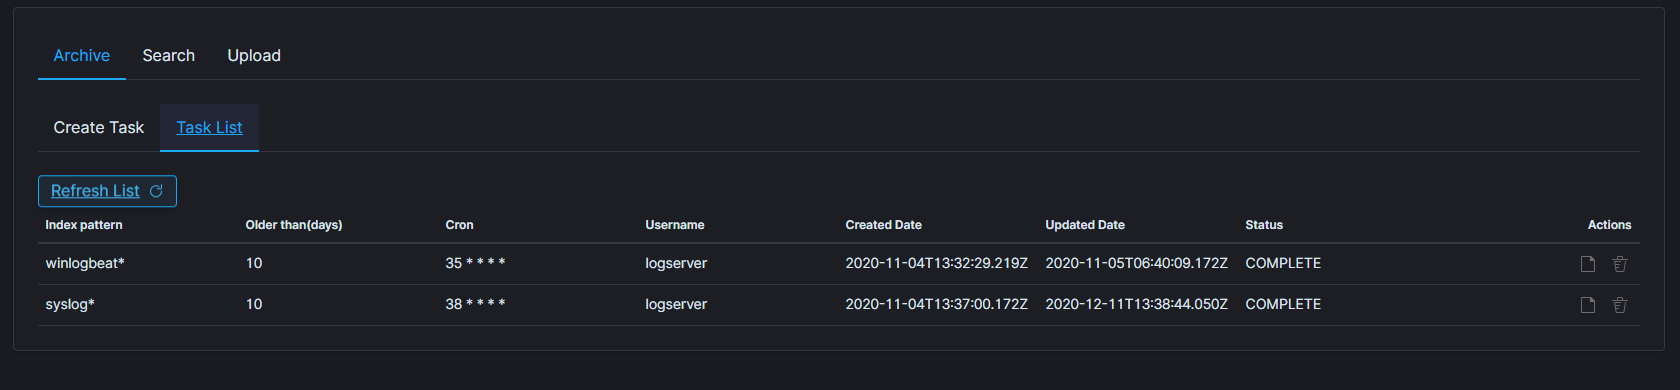
If the archiving task finds an existing archive file that matches the data being archived, it will check the number of documents in the archive and the number of documents in the index. If there is a difference in the number of documents then new documents will be added to the archive file.
Archive Search
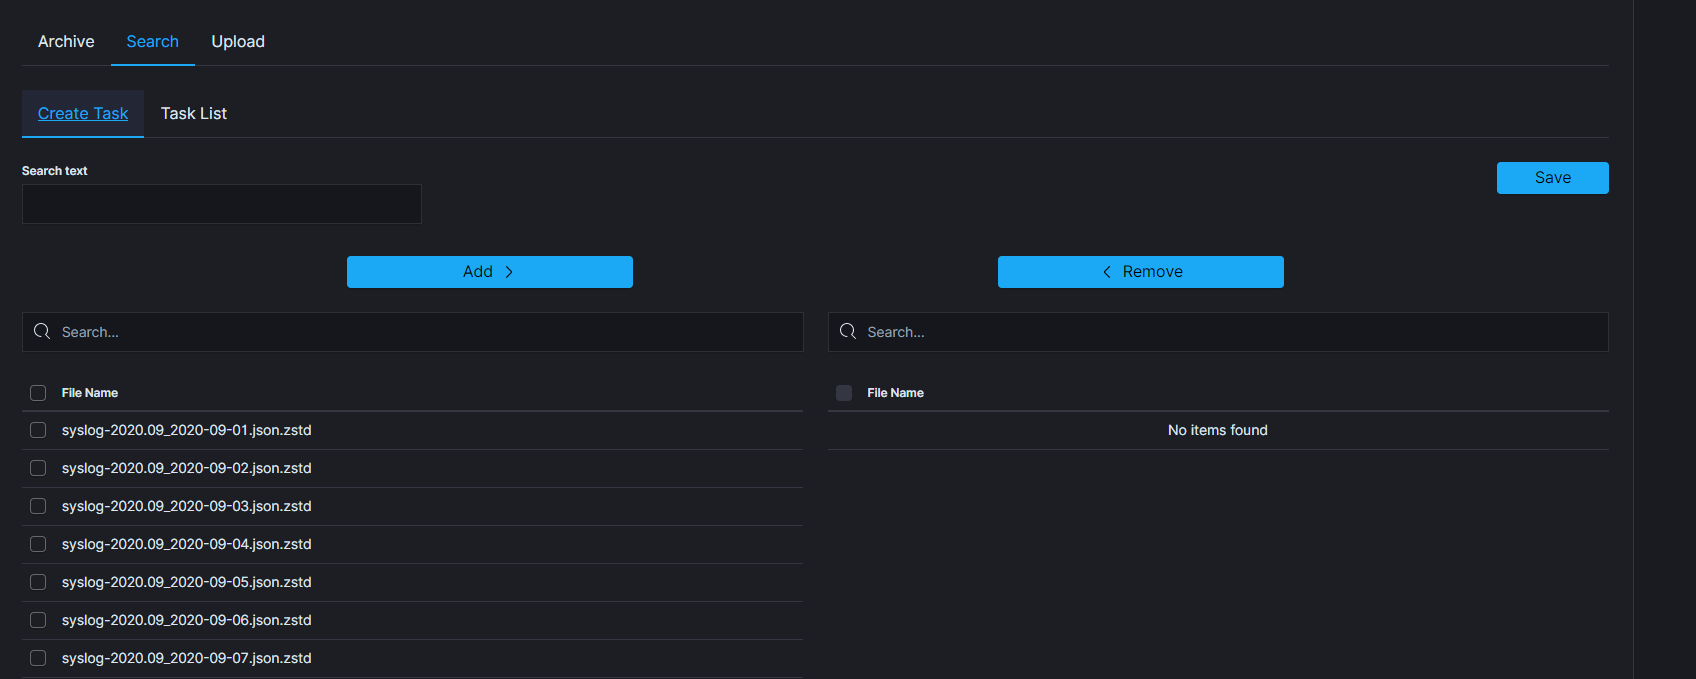
The Archive Search module can search archive files for the specific content and back result in the Task List
Create Search task
- From the main navigation go to the
Archivemodule. - On the
Searchtab selectCreate Taskand define the following parameters:Search text- field for entered the text to be searched.File name- list of archive file that will be searched.
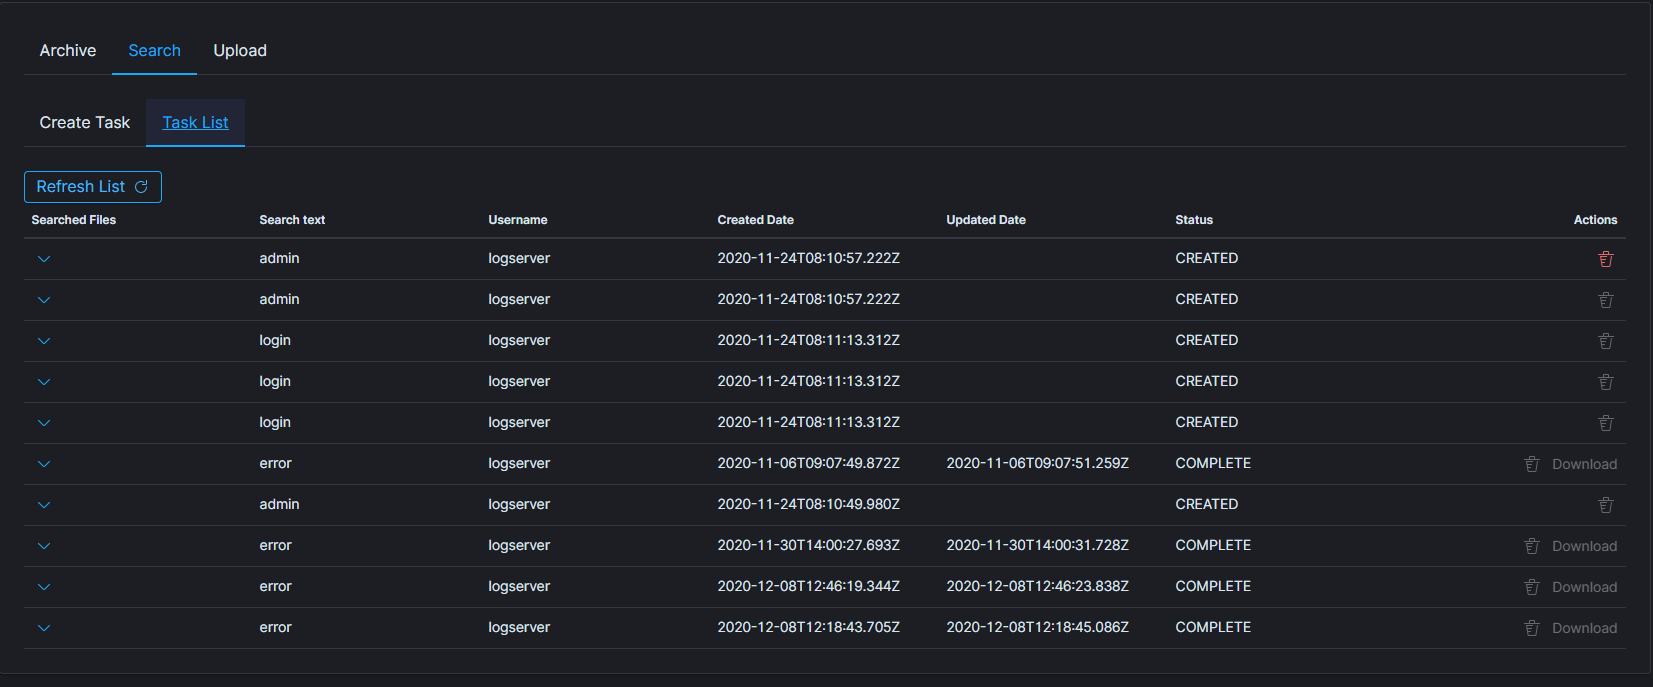
Task list
The searching process will can take long time. On the Task List you can follow the status of the searching process. Also you can view result and delete tasks.
Archive Upload
The Archive Upload module move data from archive to Elasticsearch index and make it online.
Create Upload task
- From the main navigation go to the
Archivemodule. - On the
Uploadtab selectCreate Taskand define the following parameters:Destination index- If destination index does not exist it will be created. If exists data will append.
File name- list of archive file that will be recover to Elasticsearch index.
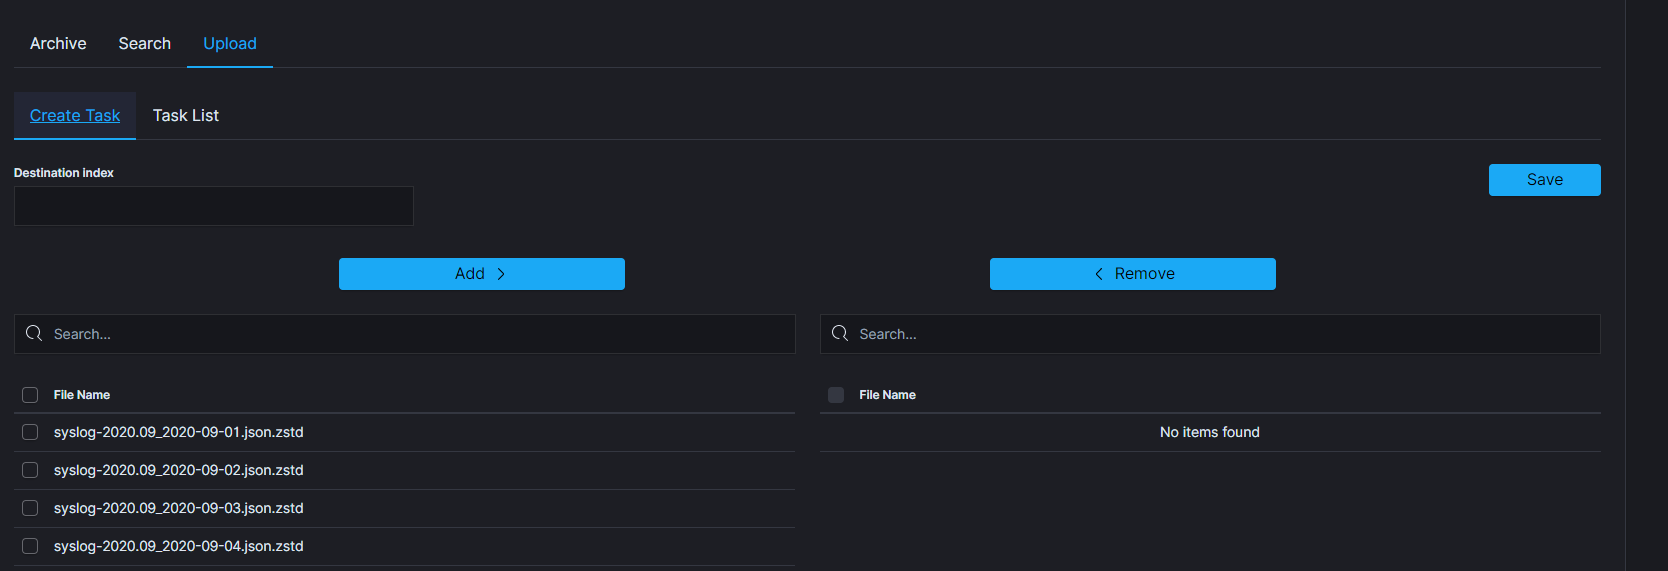
Task List
The process will index data back into Elasticsearch. Depend on archive size the process can take long time. On the Task List you can follow the status of the recovery process. Also you can view result and delete tasks.
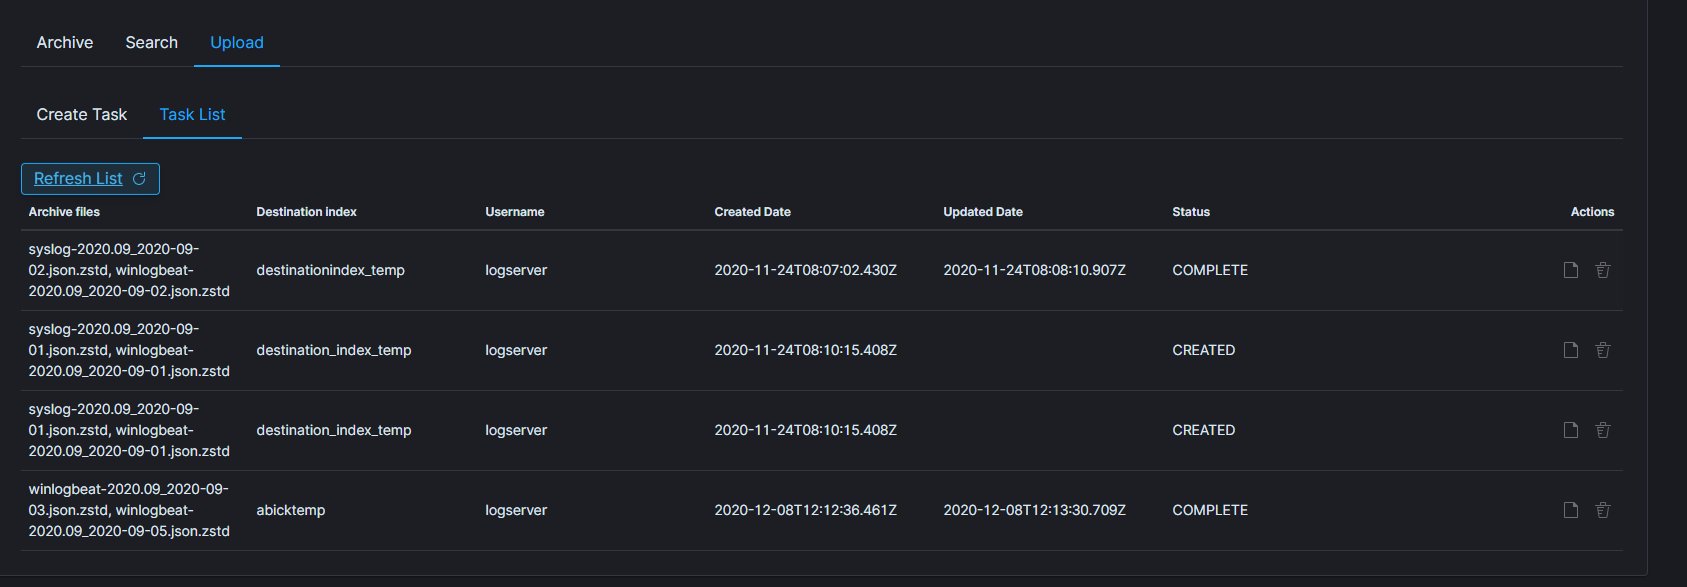
Command Line tools
Archive files can be handled by the following commands zstd, zstdcat, zstdgrep, zstdless, zstdmt.
zstd
The command for decompress *.zstd the Archive files, for example:
zstd -d winlogbeat-2020.10_2020-10-23.json.zstd -o
 winlogbeat-2020.10_2020-10-23.json
zstdcat
The command for concatenate *.zstd Archive files and print content on the standard output, for example:
zstdcat winlogbeat-2020.10_2020-10-23.json.zstd
zstdgrep
The command for print lines matching a pattern from *.zstd Archive files, for example:
zstdgrep "optima" winlogbeat-2020.10_2020-10-23.json.zstd
Above example is searching documents contain the “optima” phrase in winlogbeat-2020.10_2020-10-23.json.zstd archive file.
zstdless
The command for viewing Archive * .zstd files, for example:
zstdless winlogbeat-2020.10_2020-10-23.json.zstd
zstdmt
The command for compress and decompress Archive *.zdtd file useing multiple CPU core (default is 1), for example:
zstdmt -d winlogbeat-2020.10_2020-10-23.json.zstd -o winlogbeat-2020.10_2020-10-23.json
Wiki
Wiki.js
Wiki.js is one of the most powerful and extensible Wiki software. The Energy Logserver have integration plugin with Wiki.js, which allows you to access Wiki.js directly from the Energy Logserver GUI. Additionally, Energy Logserver provides access management to the Wiki content.
Login to Wiki
Access to the Wiki is from the main Energy Logserver GUI window via the Wiki button located at the top of the window:
Creating a public site
There are several ways to create a public site:
- by clicking the New Page icon on the existing page;
- by clicking on a link of a non-existent site;
- by entering the path in the browser’s address bar to a non-existent site;
- by duplicating an existing site;
Create a site by clicking the New Page icon on an existing page
On the opened page, click the New Page button in the menu at the top of the opened website:

A new page location selection window will appear, where in the Virtual Folders panel you can select where the new page will be saved.
In the text field at the bottom of the window, the new-page string is entered by default, specifying the address of the page being created:
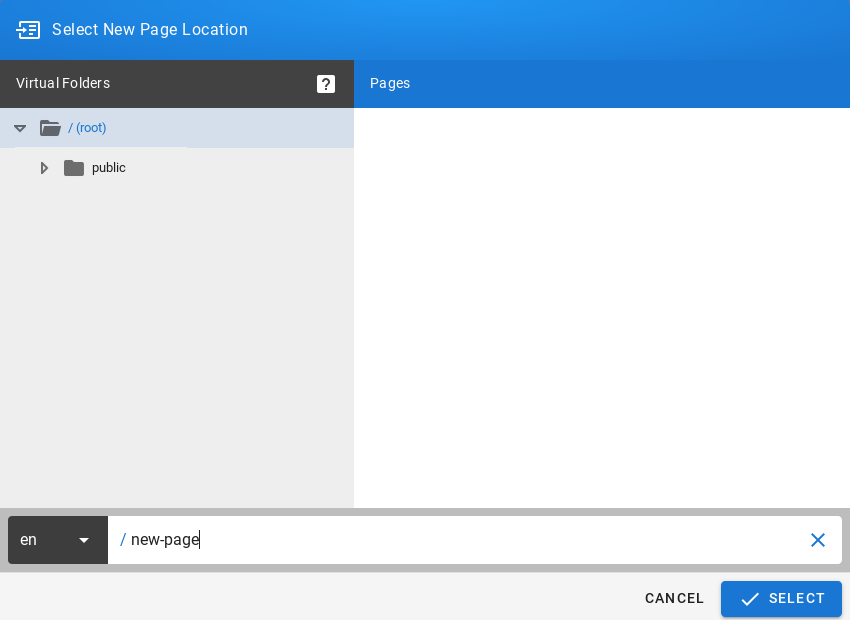
After clicking on the SELECT button at the bottom of the window, a window will appear with the option to select the editor type of the newly created site:

After selecting the site editor (in this case, the Visual Editor editor has been selected), a window with site properties will appear where you can set the site title (change the default page title), set a short site description, change the path to the site and optionally add tags to the site:

A public site should be placed in the path /public which is available for the Guest group and have the public-pages tag assigned. The public-pages tag mark sites are accessible to the “Guest” group.
After completing the site with content, save it by clicking on the Create button located in the menu at the top of the new site editor:

After the site is successfully created, the browser will open the newly created site.
Create a site by typing a nonexistent path into the browser’s address bar
In the address bar of the browser, enter the address of non-existent websites, e.g. by adding /en/public/test-page to the end of the domain name:

The browser will display the information ***This page does not exists yet.***, Below there will be a button to create a CREATE PAGE page (if you have permission to create a site at the given address):

After clicking the CREATE PAGE button, a window with site properties will appear where you can set the site title (change the default page title), set a short site description, change the path to the site and optionally add tags to the site:
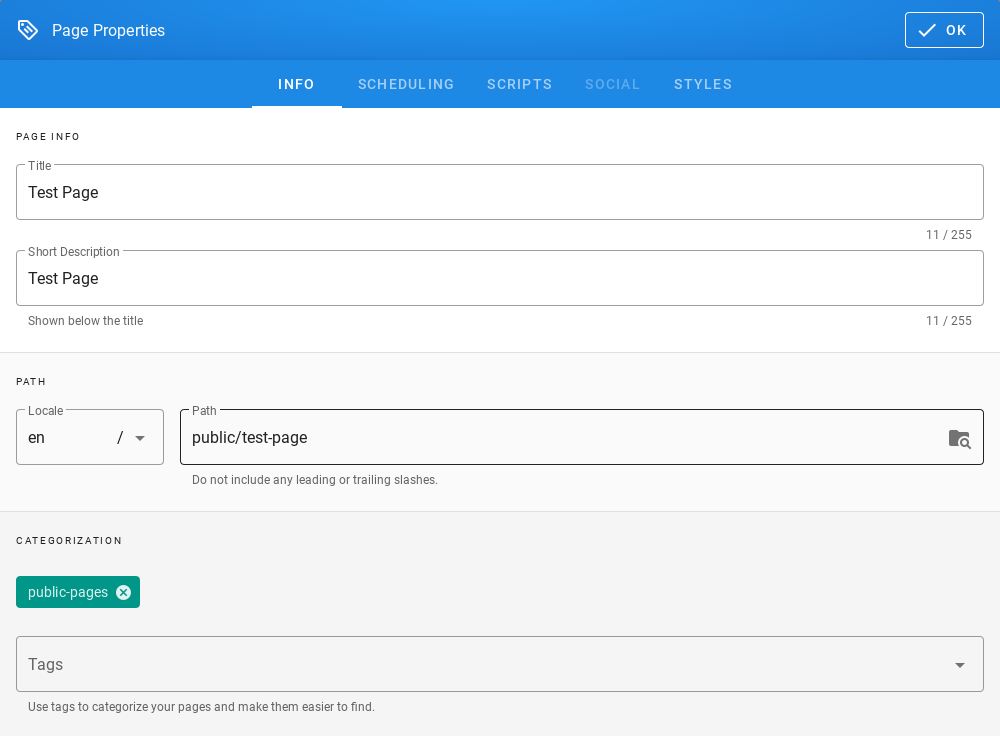
A public site should be placed in the path /public which is available for the Guest group and have the public-pages tag assigned. The public-pages tag mark sites are accessible to the Guest group.
After completing the site with content, save it by clicking on the Create button located in the menu at the top of the new site editor:
After the site is successfully created, the browser will open the newly created site.
Create a site by duplicating an existing site
On the open page, click the Page Actions button in the menu at the top of the open site:

The list of actions that can be performed on the currently open site will appear:
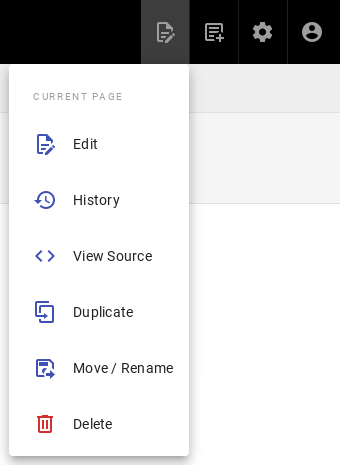
From the expanded list of actions, click on the Duplicate item, then a new page location selection window will appear, where in the Virtual Folders panel you can indicate where the new page will be saved. In the text field at the bottom of the window, the string public/new-page is entered (by default), specifying the address of the page being created:
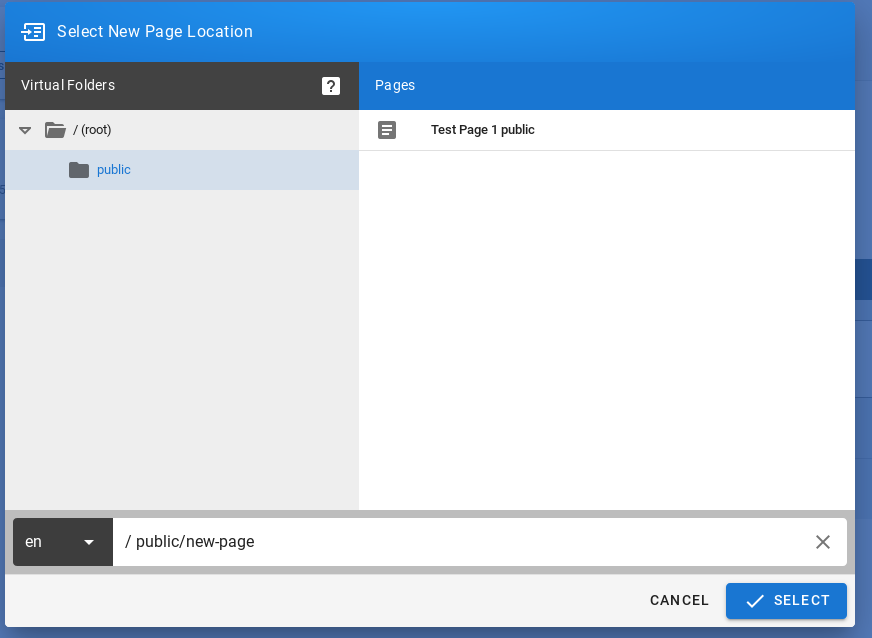
After clicking the SELECT button, a window with site properties will appear where you can set the site title (change the title of the duplicated page), set a short site description (change the description of the duplicated site), change the path to the site and optionally add tags to the site:
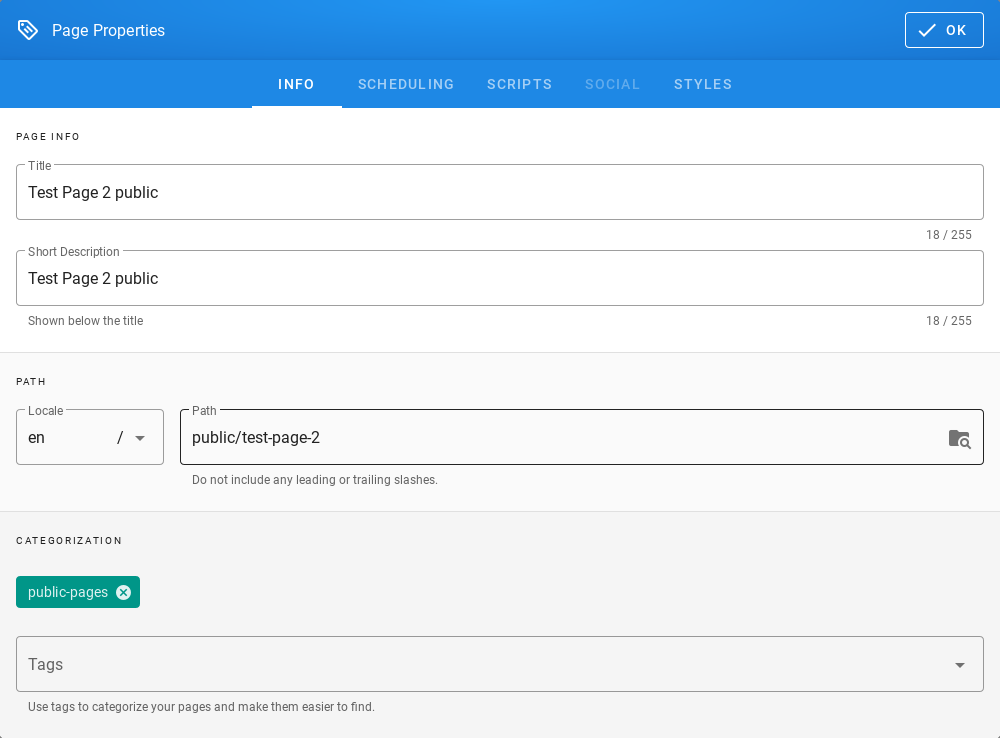
A public site should be placed in the path /public which is available for the Guest group and have the public-pages tag assigned. The public-pages tag mark sites are accessible to the Guest group.
After completing the site with content, save it by clicking on the Create button located in the menu at the top of the new site editor:
After the site is successfully created, the browser will open the newly created site.
Creating a site with the permissions of a given group
To create sites with the permissions of a given group, do the following:
Check the permissions of the group to which the user belongs. To do this, click on the Account button in the top right menu in Wiki.js:

After clicking on the Account button, a menu with a list of actions to be performed on your own account will be displayed:
From the expanded list of actions, click on the Profiles item, then the profile of the currently logged in user will be displayed. The Groups tile will display the groups to which the currently logged in user belongs:
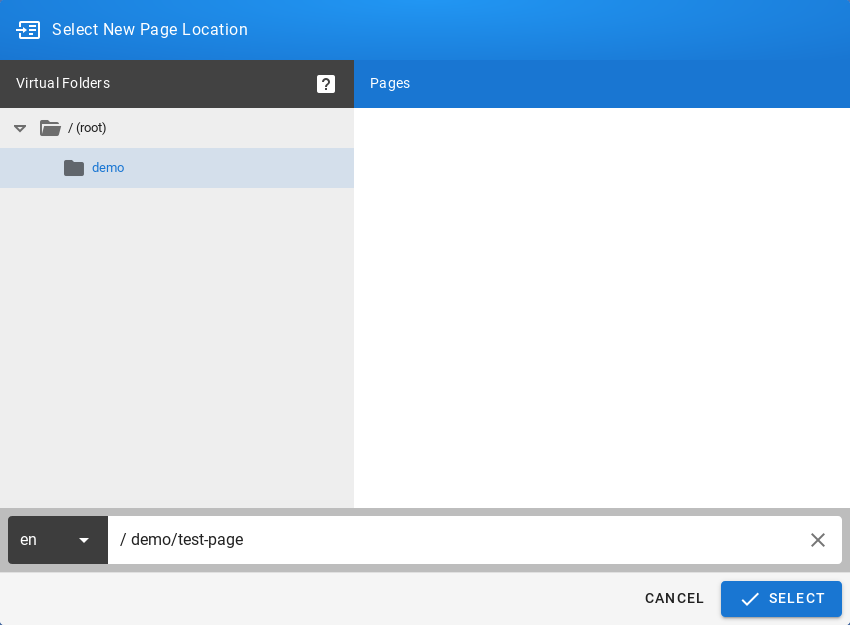
Then create the site in the path, putting the name of the group to which the user belongs. In this case it will be putting your site in the path starting with /demo(preceded by an abbreviation of the language name):

Click the SELECT button at the bottom of the window, a new window will appear with the option to select the editor type for the newly created site:
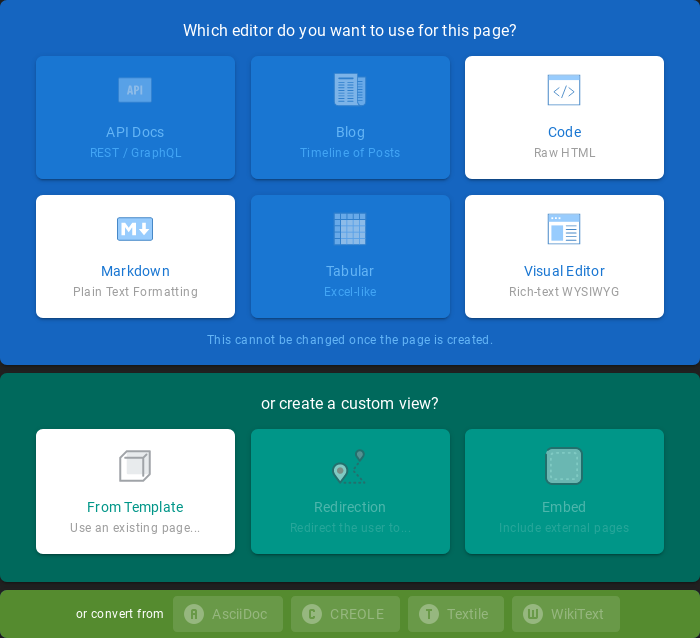
After selecting the site editor (for example Visual Editor), a window with site properties will appear where you can set the site title (change the default page title), set a short site description, change the path to the site and optionally add tags to the site:
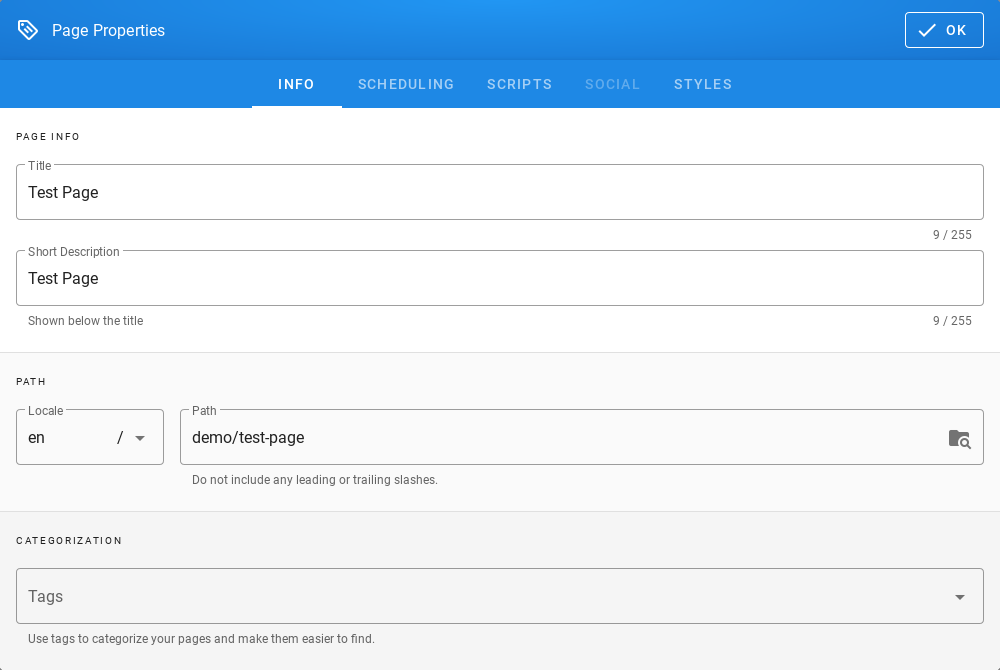
After completing the site with content, save it by clicking the Create button in the menu at the top of the new site editor

After the site is successfully created, the browser will open the newly created site.
Content management
Text formatting features
- change the text size;
- changing the font type;
- bold;
- italics;
- stress;
- strikethrough;
- subscript;
- superscript;
- align (left, right, center, justify);
- numbered list;
- bulleted list;
- to-do list;
- inserting special characters;
- inserting tables;
- inserting text blocks Wiki.js also offers non-text insertion.
Insert Links
- To insert links, click in the site editor on the Link icon on the editor icon bar:
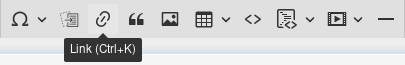
After clicking on the icon, a text field will appear to enter the website address:
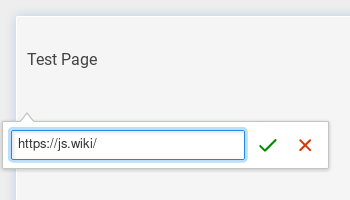
Then click the Save button (green sign next to the text field), then the address to the external site will appear on the current site:
Insert images
To insert images, click in the site editor on the Insert Assets icon on the editor icon bar:
After clicking on the icon, the window for upload images will appear:
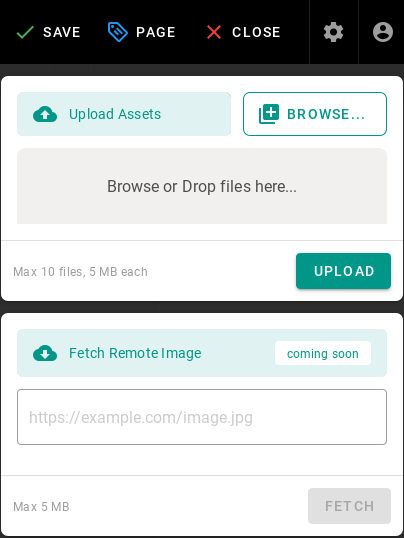
To upload the image, click the Browse button (or from the file manager, drag and drop the file to the Browse or Drop files here … area) then the added file will appear on the list, its name will be on a gray background:
Click the UPLOAD button to send files to the editor, after the upload is completed, you will see information about the status of the operation performed:
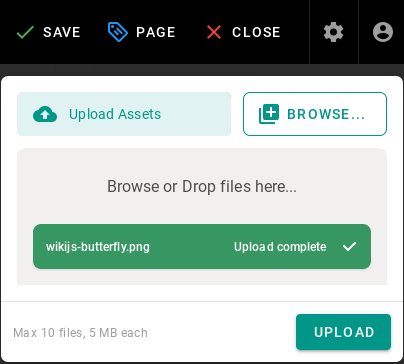
After uploading, the image file will also appear in the window where you can select images to insert:
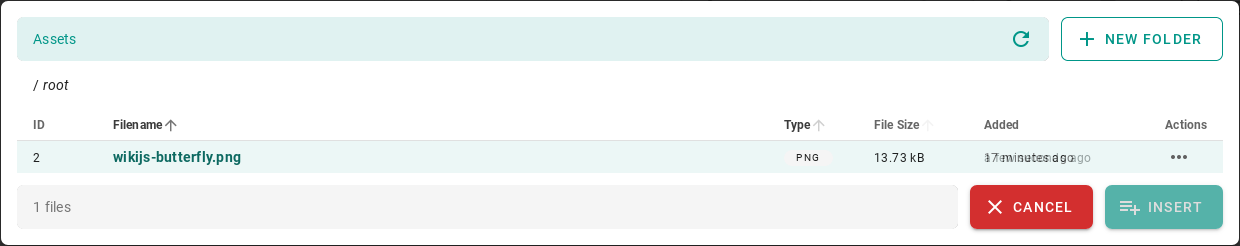
Click on the file name and then the INSERT button to make the image appear on the edited site:
After completing the site with content, save it by clicking the CREATE button in the menu at the top of the editor of the new site:

or the SAVE button in the case of editing an existing site:

After the site is successfully created, the browser will open the newly created site.
Create a “tree” of documents
Wiki.js does not offer a document tree structure directly. Creating a structure (tree) of documents is done automatically by grouping sites according to the paths in which they are available.
To create document structures (trees), create sites with the following paths:
/en/linux/1-introduction
/en/linux/2-installation
/en/linux/3-configuration
/en/linux/4-administration
/en/linux/5-summary
The items in the menu are sorted alphabetically, so the site titles should begin with a number followed by a dot followed by the name of the site, for example:
- for the site in the path /en/linux/1-introduction you should set the title 1.Introduction;
- for the site in the path /en/linux/2-installation you should set the title 2.Installation;
- for the site in the path /en/linux/3-configuration you should set the title 3.Configuration;
- for the site in the path /en/linux/4-administration you should set the title 4.Administration;
- for the site in the path /en/linux/5-summary you should set the title 5.Summary
In this way, you can create a structure (tree) of documents relating to one topic:
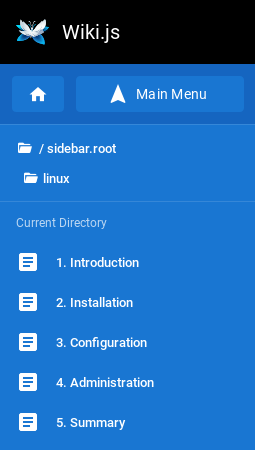
You can create a document with chapters in a similar way. To do this, create sites with the following paths:
/en/elaboration/1-introduction
/en/elaboration/2-chapter-1
/en/elaboration/2-chapter-1
/en/elaboration/2-chapter-1
/en/elaboration/3-summary
The menu items are in alphabetical order. Site titles should begin with a number followed by a period followed by a name that identifies the site’s content:
- for the site in the path /en/elaboration/1-introduction you should set the title 1. Introduction
- for the site in the path /en/elaboration/2-chapter-1 you should set the title 2. Chapter 1
- for the site in the path /en/elaboration/2-chapter-2 you should set the title 2. Chapter 2
- for the site in the path /en/elaboration/2-chapter-3 the title should be set to 2. Chapter 3
- for the site in the path /en/elaboration/3-summary you should set the title 3. Summary
In this way, you can create a structure (tree) of documents related to one document: