Configuration
Changing default users for services
Change Kibana User
Edit file /etc/systemd/system/kibana.service
	User=newuser
	Group= newuser
Edit /etc/default/kibana
	user=" newuser "
	group=" newuser "
Add appropriate permission:
chown newuser: /usr/share/kibana/ /etc/kibana/ -R
Change Elasticsearch User
Edit /usr/lib/tmpfiles.d/elasticsearch.conf and change user name and group:
d /var/run/elasticsearch 0755 newuser newuser –
Create directory:
mkdir /etc/systemd/system/elasticsearch.service.d/
Edit /etc/systemd/system/elasticsearch.service.d/01-user.conf
	[Service]
	User=newuser
	Group= newuser
Add appropriate permission:
chown -R newuser: /var/lib/elasticsearch /usr/share/elasticsearch /etc/elasticsearch /var/log/elasticsearch
Change Logstash User
Create directory:
mkdir /etc/systemd/system/logstash.service.d
Edit /etc/systemd/system/logstash.service.d/01-user.conf
	[Service]
	User=newuser
	Group=newuser
Add appropriate permission:
chown -R newuser: /etc/logstash /var/log/logstash
Plugins management
Base installation of the Energy Logserver contains the elasticsearch-auth plugin. You can extend the basic Elasticsearch functionality by installing the custom plugins.
Plugins contain JAR files, but may also contain scripts and config files, and must be installed on every node in the cluster.
After installation, each node must be restarted before the plugin becomes visible.
The Elasticsearch provides two categories of plugins:
- Core Plugins - it is plugins that are part of the Elasticsearch project.
- Community contributed - it is plugins that are external to the Elasticsearch project
Installing Plugins
Core Elasticsearch plugins can be installed as follows:
cd /usr/share/elasticsearch/
bin/elasticsearch-plugin install [plugin_name]
Example:
bin/elasticsearch-plugin install ingest-geoip

-> Downloading ingest-geoip from elastic
[=================================================] 100%
@@@@@@@@@@@@@@@@@@@@@@@@@@@@@@@@@@@@@@@@@@@@@@@@@@@@@@@@@@@
@ WARNING: plugin requires additional permissions @
@@@@@@@@@@@@@@@@@@@@@@@@@@@@@@@@@@@@@@@@@@@@@@@@@@@@@@@@@@@
* java.lang.RuntimePermission accessDeclaredMembers
* java.lang.reflect.ReflectPermission suppressAccessChecks
See http://docs.oracle.com/javase/8/docs/technotes/guides/security/permissions.html
for descriptions of what these permissions allow and the associated risks.

Continue with installation? [y/N]y
-> Installed ingest-geoip
Plugins from custom link or filesystem can be installed as follow:
cd /usr/share/elasticsearch/
sudo bin/elasticsearch-plugin install [url]
Example:
sudo bin/elasticsearch-plugin install file:///path/to/plugin.zip
bin\elasticsearch-plugin install file:///C:/path/to/plugin.zip
sudo bin/elasticsearch-plugin install http://some.domain/path/to/plugin.zip
Listing plugins
Listing currently loaded plugins
sudo bin/elasticsearch-plugin list
listing currently available core plugins:
sudo bin/elasticsearch-plugin list --help
Removing plugins
sudo bin/elasticsearch-plugin remove [pluginname]
Updating plugins
sudo bin/elasticsearch-plugin remove [pluginname]
sudo bin/elasticsearch-plugin install [pluginname]
Transport layer encryption
Generating Certificates
Requirements for certificate configuration:
- To encrypt traffic (HTTP and transport layer) of Elasticsearch you have to generate certificate authority which will be used to sign each node certificate of a cluster.
- Elasticsearch certificate has to be generated in pkcs8 RSA format.
Example certificate configuration (Certificates will be valid for 10 years based on this example):
# To make this process easier prepare some variables:
DOMAIN=mylocal.domain
DOMAIN_IP=10.4.3.185 # This is required if certificate validation is used on trasport layer
COUNTRYNAME=PL
STATE=Poland
COMPANY=LOGTEST

# Generate CA key:
openssl genrsa -out rootCA.key 4096

# Create and sign root certificate:
echo -e "${COUNTRYNAME}\n${STATE}\n\n${COMPANY}\n\n\n\n" | openssl req -x509 -new -nodes -key rootCA.key -sha256 -days 3650 -out rootCA.crt

# Crete RSA key for domain:
openssl genrsa -out ${DOMAIN}.pre 2048

# Convert generated key to pkcs8 RSA key for domain hostname
# (if you do not want to encrypt the key add "-nocrypt" at the end of the command; otherwise it will be necessary to add this password later in every config file):
openssl pkcs8 -topk8 -inform pem -in ${DOMAIN}.pre -outform pem -out ${DOMAIN}.key

# Create a Certificate Signing Request (openssl.cnf can be in a different location; this is the default for CentOS 7.7):
openssl req -new -sha256 -key ${DOMAIN}.key -subj "/C=PL/ST=Poland/O=EMCA/CN=${DOMAIN}" -reqexts SAN -config <(cat /etc/pki/tls/openssl.cnf <(printf "[SAN] \nsubjectAltName=DNS:${DOMAIN},IP:${DOMAIN_IP}")) -out ${DOMAIN}.csr

# Generate Domain Certificate
openssl x509 -req -in ${DOMAIN}.csr -CA rootCA.crt -CAkey rootCA.key -CAcreateserial -out ${DOMAIN}.crt -sha256 -extfile <(printf "[req]  \ndefault_bits=2048\ndistinguished_name=req_distinguished_name\nreq_extensions=req_ext\n[req_distinguished_name]\ncountryName=${COUNTRYNAME}\nstateOrProvinceName=${STATE}  \norganizationName=${COMPANY}\ncommonName=${DOMAIN}\n[req_ext]\nsubjectAltName=@alt_names\n[alt_names]\nDNS.1=${DOMAIN}\nIP=${DOMAIN_IP}\n") -days 3650 -extensions req_ext

# Verify the validity of the generated certificate
openssl x509 -in ${DOMAIN}.crt -text -noout
Right now you should have these files:
$ ls -1 | sort
mylocal.domain.test.crt
mylocal.domain.test.csr
mylocal.domain.test.key
mylocal.domain.test.pre
rootCA.crt
rootCA.key
rootCA.srl
Create a directory to store required files (users: elasticsearch, kibana and logstash have to be able to read these files):
mkdir /etc/elasticsearch/ssl
cp {mylocal.domain.test.crt,mylocal.domain.test.key,rootCA.crt} /etc/elasticsearch/ssl
chown -R elasticsearch:elasticsearch /etc/elasticsearch/ssl
chmod 755 /etc/elasticsearch/ssl
chmod 644 /etc/elasticsearch/ssl/*
Setting up configuration files
- Append or uncomment below lines in
/etc/elasticsearch/elasticsearch.ymland change paths to proper values (based on past steps):
Transport layer encryption
logserverguard.ssl.transport.enabled: true
logserverguard.ssl.transport.pemcert_filepath: "/etc/elasticsearch/ssl/mylocal.domain.test.crt"
logserverguard.ssl.transport.pemkey_filepath: "/etc/elasticsearch/ssl/mylocal.domain.test.key"
logserverguard.ssl.transport.pemkey_password: "password_for_pemkey" # if there is no password leve ""
logserverguard.ssl.transport.pemtrustedcas_filepath: "/etc/elasticsearch/ssl/rootCA.crt"

logserverguard.ssl.transport.enforce_hostname_verification: true
logserverguard.ssl.transport.resolve_hostname: true

logserverguard.ssl.transport.enabled_ciphers:
 - "TLS_DHE_RSA_WITH_AES_128_GCM_SHA256"
 - "TLS_ECDHE_RSA_WITH_AES_128_GCM_SHA256"

logserverguard.ssl.transport.enabled_protocols:
 - "TLSv1.2"
HTTP layer encryption
logserverguard.ssl.http.enabled: true
logserverguard.ssl.http.pemcert_filepath: "/etc/elasticsearch/ssl/mylocal.domain.test.crt"
logserverguard.ssl.http.pemkey_filepath: "/etc/elasticsearch/ssl/mylocal.domain.test.key"
logserverguard.ssl.http.pemkey_password: "password_for_pemkey" # if there is no password leve ""
logserverguard.ssl.http.pemtrustedcas_filepath: "/etc/elasticsearch/ssl/rootCA.crt"

logserverguard.ssl.http.clientauth_mode: OPTIONAL
logserverguard.ssl.http.enabled_ciphers:
 - "TLS_DHE_RSA_WITH_AES_128_GCM_SHA256"
 - "TLS_ECDHE_RSA_WITH_AES_128_GCM_SHA256"

logserverguard.ssl.http.enabled_protocols:
 - "TLSv1.2"
Append or uncomment below lines in
/etc/kibana/kibana.ymland change paths to proper values:elasticsearch.hosts: ["https://127.0.0.1:8000"] --- # Elasticsearch trafic encryption # There is also an option to use "127.0.0.1/localhost" and to not supply path to CA. Verification Mode should be then changed to "none". elasticsearch.ssl.verificationMode: full elasticsearch.ssl.certificate: "/etc/elasticsearch/ssl/mylocal.domain.test.crt" elasticsearch.ssl.key: "/etc/elasticsearch/ssl/mylocal.domain.test.key" elasticsearch.ssl.keyPassphrase: "password_for_pemkey" # this line is not required if there is no password elasticsearch.ssl.certificateAuthorities: "/etc/elasticsearch/ssl/rootCA.crt"
Append or uncomment below lines in
/opt/alert/config.yamland change paths to proper values:# Connect with TLS to Elasticsearch use_ssl: True # Verify TLS certificates verify_certs: True # Client certificate client_cert: /etc/elasticsearch/ssl/mylocal.domain.test.crt client_key: /etc/elasticsearch/ssl/mylocal.domain.test.key ca_certs: /etc/elasticsearch/ssl/rootCA.crt
For CSV/HTML export to work properly rootCA.crt generated in first step has to be “installed” on the server. Below example for CentOS 7:
# Copy rootCA.crt and update CA trust store
cp /etc/elasticsearch/ssl/rootCA.crt /etc/pki/ca-trust/source/anchors/rootCA.crt
update-ca-trust
Intelligence module. Generate pkcs12 keystore/cert:
DOMAIN=mylocal.domain.test
keytool -import -file /etc/elasticsearch/ssl/rootCA.crt -alias root -keystore root.jks
openssl pkcs12 -export -in /etc/elasticsearch/ssl/${DOMAIN}.crt -inkey /etc/elasticsearch/ssl/${DOMAIN}.key -out ${DOMAIN}.p12 -name "${DOMAIN}" -certfile /etc/elasticsearch/ssl/rootCA.crt
# Configure /opt/ai/bin/conf.cfg
https_keystore=/path/to/pk12/mylocal.domain.test.p12
https_truststore=/path/to/root.jks
https_keystore_pass=bla123
https_truststore_pass=bla123
Logstash/Beats
You can eather install CA to allow Logstash and Beats traffic or you can supply required certificates in config:
Logstash:
output {
  elasticsearch {
    hosts => "https://mylocal.domain.test:9200"
    ssl => true
    index => "winlogbeat-%{+YYYY.MM}"
    user => "logstash"
    password => "logstash"
    cacert => "/path/to/cacert/rootCA.crt"
  }
}
Beats:
output.elasticsearch.hosts: ["https://mylocal.domain.test:9200"]
output.elasticsearch.protocol: "https"
output.elasticsearch.ssl.enabled: true
output.elasticsearch.ssl.certificate_authorities: ["/path/to/cacert/rootCA.crt"]
Additionally, for any beats program to be able to write to elasticsearch, you will have to make changes to “enabled_ciphers” directive in “/etc/elasticsearch/elasticsearch.yml”. This is done by commenting:
logserverguard.ssl.http.enabled_ciphers:
- "TLS_DHE_RSA_WITH_AES_256_GCM_SHA384"
Otherwise, the beat will not be able to send documents directly and if you want to avoid it you can send a document with Logstash first.
Browser layer encryption
Secure Sockets Layer (SSL) and Transport Layer Security (TLS) provide encryption for data-in-transit. While these terms are often used interchangeably, Energy Logserver GUI supports only TLS, which supersedes the old SSL protocols. Browsers send traffic to Energy Logserver GUI and Energy Logserver GUI sends traffic to Elasticsearch database. These communication channels are configured separately to use TLS. TLS requires X.509 certificates to authenticate the communicating parties and perform encryption of data-in-transit. Each certificate contains a public key and has an associated — but separate — private key; these keys are used for cryptographic operations. Energy Logserver GUI supports certificates and private keys in PEM format and support TLS 1.3 version.
Configuration steps
Obtain a server certificate and private key for Energy Logserver GUI.
Kibana will need to use this “server certificate” and corresponding private key when receiving connections from web browsers.
When you obtain a server certificate, you must set its subject alternative name (SAN) correctly to ensure that modern web browsers with hostname verification will trust it. You can set one or more SANs to the Energy Logserver GUI server’s fully-qualified domain name (FQDN), hostname, or IP address. When choosing the SAN, you should pick whichever attribute you will be using to connect to Kibana in your browser, which is likely the FQDN in a production environment.
Configure Energy Logserver GUI to access the server certificate and private key.
vi /etc/kibana/kibana.ymlserver.ssl.enabled: true server.ssl.supportedProtocols: ["TLSv1.3"] server.ssl.certificate: "/path/to/kibana-server.crt" server.ssl.key: "/path/to/kibana-server.key"
Set HTTPS in configuration file for the License server:
vi /opt/license-service/license-service.conf
elasticsearch_connection:
  hosts: ["els_host_IP:9200"]

  username: logserver
  password: "logserver_password"

  https: true
Building a cluster
Node roles
Every instance of Elasticsearch server is called a node. A collection of connected nodes is called a cluster. All nodes know about all the other nodes in the cluster and can forward client requests to the appropriate node.
Besides that, each node serves one or more purpose:
- Master-eligible node - A node that has node.master set to true (default), which makes it eligible to be elected as the master node, which controls the cluster
- Data node - A node that has node.data set to true (default). Data nodes hold data and perform data related operations such as CRUD, search, and aggregations
- Client node - A client node has both node.master and node.data set to false. It can neither hold data nor become the master node. It behaves as a “smart router” and is used to forward cluster-level requests to the master node and data-related requests (such as search) to the appropriate data nodes
- Tribe node - A tribe node, configured via the tribe.* settings, is a special type of client node that can connect to multiple clusters and perform search and other operations across all connected clusters.
Naming convention
Elasticsearch require little configuration before before going into work.
The following settings must be considered before going to production:
- path.data and path.logs - default locations of these files are:
/var/lib/elasticsearchand/var/log/elasticsearch. - cluster.name - A node can only join a cluster when it shares its
cluster.namewith all the other nodes in the cluster. The default name is “elasticsearch”, but you should change it to an appropriate name which describes the purpose of the cluster. You can do this in/etc/elasticsearch/elasticsearch.ymlfile. - node.name - By default, Elasticsearch will use the first seven characters of the randomly
generated UUID as the node id. Node id is persisted and does not change when a node restarts.
It is worth configuring a more human readable name:
node.name: prod-data-2in file/etc/elstaicsearch/elasticsearch.yml - network.host - parametr specifying network interfaces to which Elasticsearch can bind.
Default is
network.host: ["_local_","_site_"]. - discovery - Elasticsearch uses a custom discovery implementation called “Zen Discovery”.
There are two important settings:
discovery.zen.ping.unicast.hosts- specify list of other nodes in the cluster that are likely to be live and contactable;discovery.zen.minimum_master_nodes- to prevent data loss, you can configure this setting so that each master-eligible node knows the minimum number of master-eligible nodes that must be visible in order to form a cluster.
- heap size - By default, Elasticsearch tells the JVM to use a heap with a minimum (Xms) and maximum (Xmx) size of 1 GB. When moving to production, it is important to configure heap size to ensure that Elasticsearch has enough heap available
Config files
To configure the Elasticsearch cluster you must specify some parameters in the following configuration files on every node that will be connected to the cluster:
/etc/elsticsearch/elasticserach.yml:cluster.name:name_of_the_cluster- same for every node;node.name:name_of_the_node- uniq for every node;node.master:true_or_falsenode.data:true_or_falsenetwork.host:["_local_","_site_"]discovery.zen.ping.multicast.enableddiscovery.zen.ping.unicast.hosts
/etc/elsticsearch/log4j2.properties:logger: action: DEBUG- for easier debugging.
Example setup
Example of the Elasticsearch cluster configuration:
file
/etc/elasticsearch/elasticsearch.yml:cluster.name: tm-lab node.name: "elk01" node.master: true node.data: true network.host: 127.0.0.1,10.0.0.4 http.port: 9200 discovery.zen.ping.multicast.enabled: false discovery.zen.ping.unicast.hosts: ["10.0.0.4:9300","10.0.0.5:9300","10.0.0.6:9300"]
to start the Elasticsearch cluster execute command:
# systemctl restart elasticsearchto check status of the Elstaicsearch cluster execute command:
check of the Elasticsearch cluster nodes status via tcp port:
  # curl -XGET '127.0.0.1:9200/_cat/nodes?v'

  host         	  ip           heap.percent ram.percent load node.role master name
  10.0.0.4 	 10.0.0.4     18           91 		   0.00 -         -      elk01
  10.0.0.5 	 10.0.0.5     66           91 		   0.00 d        *      elk02
  10.0.0.6 	 10.0.0.6     43           86         	   0.65 d        m     elk03
  10.0.0.7 	 10.0.0.7     45           77         	   0.26 d        m     elk04
check status of the Elasticsearch cluster via log file:
# tail -f /var/log/elasticsearch/tm-lab.log (cluster.name)
Adding a new node to existing cluster
Install the new Energy Logserver instance. The description of the installation can be found in the chapter “First configuration steps”
Change the following parameters in the configuration file:
cluster.name:name_of_the_cluster same for every node;node.name:name_of_the_node uniq for every node;node.master:true_or_falsenode.data:true_or_falsediscovery.zen.ping.unicast.hosts:[”10.0.0.4:9300”,”10.0.0.5:9300”,”10.0.0.6:9300”] - IP addresses and instances of nodes in the cluster.
If you add a node with the role data, delete the contents of the path.data directory, by default in /var/lib/elasticsearch
Restart the Elasticsearch instance of the new node:
systemctl restart elasticsearch
Authentication with Active Directory
The AD configuration should be done in the /etc/elasticsearch/properties.yml
file.
Below is a list of settings to be made in the properties.yml file
(the commented section in the file in order for the AD settings to
start working, this fragment should be uncommented):
|**Direcitve**                          		| **Description**               							|
| ------------------------------------------------------|---------------------------------------------------------------------------------------|
| # LDAP                                		|                              								|
| #ldaps:                               		|                               							|
| # - name: \"example.com\"             		|# domain that is configured    							|
| # host: \"127.0.0.1,127.0.0.2\"       		|# list of server for this domain							|
| # port: 389                           		|# optional, default 389 for unencrypted session or 636 for encrypted sessions		|
|# ssl\_enabled: false                  		|# optional, default true       							|
|# ssl\_trust\_all\_certs: true         		|# optional, default false      							|
|# ssl.keystore.file: \"path\"          		|# path to the truststore store 							|
|# ssl.keystore.password: \"path\"      		|# password to the trusted certificate store  						|
|# bind\_dn: [[admin\@example.com]      		|# account name administrator   							|
|# bind\_password: \"password\"         		|# password for the administrator account 						|
|# search\_user\_base\_DN: \"OU=lab,DC=example,DC=com\" |# search for the DN user tree database 						|
|# user\_id\_attribute: \"uid           		|# search for a user attribute optional, by default \"uid\"            			|
|# search\_groups\_base\_DN:\"OU=lab,DC=example,DC=com\"|# group database search. This is a catalog main, after which the groups will be sought.|
|# unique\_member\_attribute: \"uniqueMember\" 		|# optional, default\"uniqueMember\"							|
|# connection\_pool\_size: 10                  		|# optional, default 30									|
|# connection\_timeout\_in\_sec: 10                  	|# optional, default 1									|
|# request\_timeout\_in\_sec: 10                     	|# optional, default 1									|
|# cache\_ttl\_in\_sec: 60                           	|# optional, default 0 - cache disabled							|
If we want to configure multiple domains, then in this configuration file we copy the # LDAP section below and configure it for the next domain.
Below is an example of how an entry for 2 domains should look like. (It is important to take the interpreter to read these values correctly).
ldaps:
        - name: "example1.com"
          host: "127.0.0.1,127.0.0.2"
          port: 389 # optional, default 389
          ssl_enabled: false # optional, default true
          ssl_trust_all_certs: true # optional, default false
          bind_dn: "admin@example1.com"
          bind_password: "password" # generate encrypted password with /usr/share/elasticsearch/pass-encrypter/pass-encrypter.sh
          search_user_base_DN: "OU=lab,DC=example1,DC=com"
          user_id_attribute: "uid" # optional, default "uid"
          search_groups_base_DN: "OU=lab,DC=example1,DC=com"
          unique_member_attribute: "uniqueMember" # optional, default "uniqueMember"
          connection_pool_size: 10 # optional, default 30
          connection_timeout_in_sec: 10 # optional, default 1
          request_timeout_in_sec: 10 # optional, default 1
          cache_ttl_in_sec: 60 # optional, default 0 - cache disabled
          service_principal_name: "esauth@example1.com" # optional, for sso
          service_principal_name_password : "password" # optional, for sso
        - name: "example2.com" #DOMAIN 2
          host: "127.0.0.1,127.0.0.2"
          port: 389 # optional, default 389
          ssl_enabled: false # optional, default true
          ssl_trust_all_certs: true # optional, default false
          bind_dn: "admin@example2.com"
          bind_password: "password" # generate encrypted password with /usr/share/elasticsearch/pass-encrypter/pass-encrypter.sh
          search_user_base_DN: "OU=lab,DC=example2,DC=com"
          user_id_attribute: "uid" # optional, default "uid"
          search_groups_base_DN: "OU=lab,DC=example2,DC=com"
          unique_member_attribute: "uniqueMember" # optional, default "uniqueMember"
          connection_pool_size: 10 # optional, default 30
          connection_timeout_in_sec: 10 # optional, default 1
          request_timeout_in_sec: 10 # optional, default 1
          cache_ttl_in_sec: 60 # optional, default 0 - cache disabled
          service_principal_name: "esauth@example2.com" # optional, for sso
          service_principal_name_password : "password" # optional, for ssl
After completing the LDAP section entry in the properties.yml file,
save the changes and restart the service with the command:
# systemctl restart elasticsearch
Configure SSL suport for AD authentication
Open the certificate manager on the AD server.
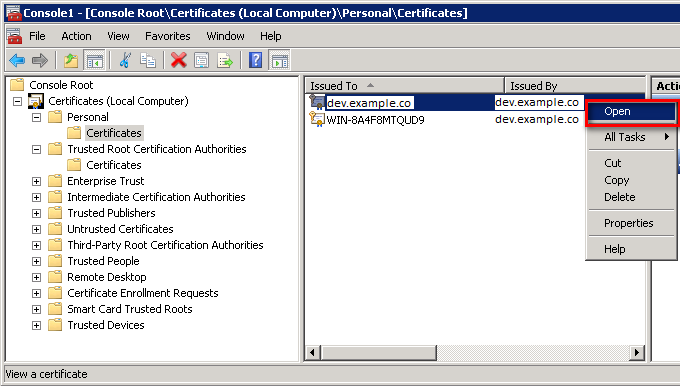
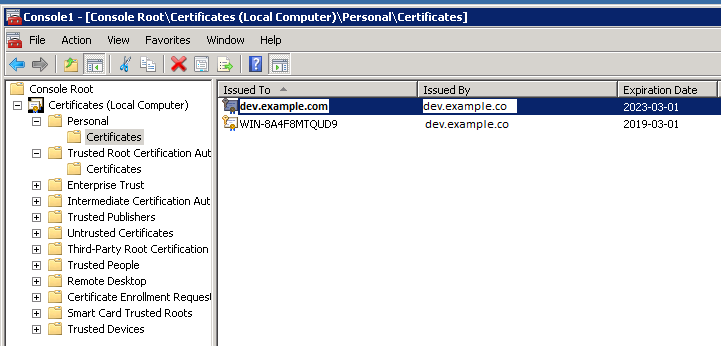 Select the certificate and open it
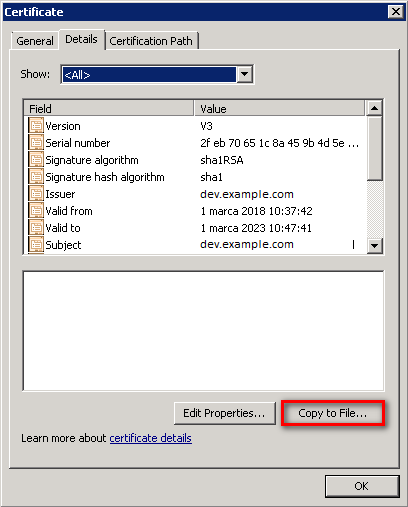
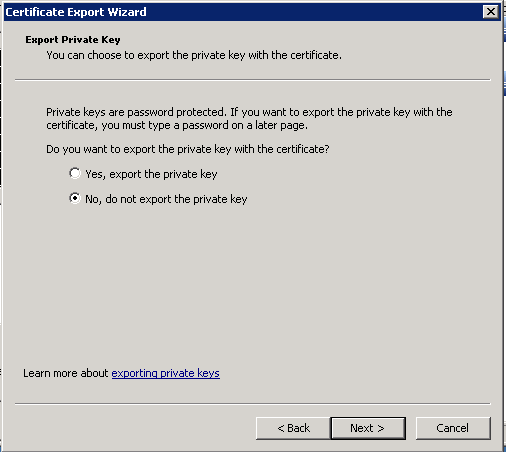
Select the option of copying to a file in the Details tab
Click the Next button
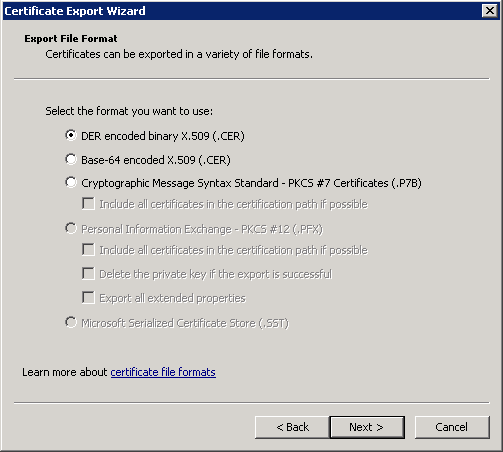
Keep the setting as shown below and click Next
Keep the setting as shown below and click Next.
Give the name a certificate
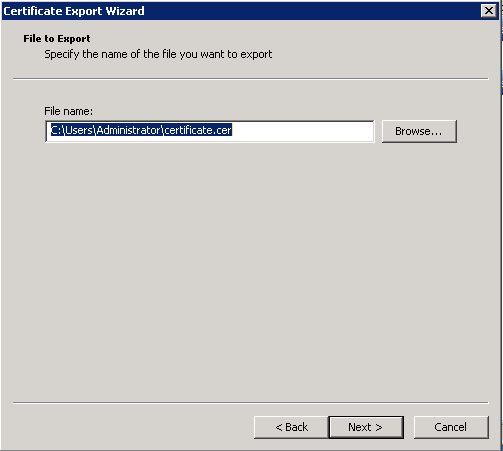
After the certificate is exported, this certificate should be imported into a trusted certificate file that will be used by the Elasticsearch plugin.
To import a certificate into a trusted certificate file, a tool called „keytool.exe” is located in the JDK installation directory.
Use the following command to import a certificate file:
keytool -import -alias adding_certificate_keystore -file certificate.cer -keystore certificatestore
The values for RED should be changed accordingly.
By doing this, he will ask you to set a password for the trusted
certificate store. Remember this password, because it must be set in
the configuration of the Elasticsearch plugin. The following settings
must be set in the properties.yml configuration for
SSL:
ssl.keystore.file: "<path to the trust certificate store>"
ssl.keystore.password: "< password to the trust certificate store>"
Role mapping
In the /etc/elasticsearch/properties.yml configuration file you can find
a section for configuring role mapping:
# LDAP ROLE MAPPING FILE`
# rolemapping.file.path: /etc/elasticsearch/role-mappings.yml
This variable points to the file /etc/elasticsearch/role-mappings.yml
Below is the sample content for this file:
admin:
"CN=Admins,OU=lab,DC=dev,DC=it,DC=example,DC=com"
bank:
"CN=security,OU=lab,DC=dev,DC=it,DC=example,DC=com"
Attention. The role you define in the role.mapping file must be created in the Energy Logserver.
How to the mapping mechanism works ? An AD user log in to Energy Logserver. In the application there is a admin role, which through the file role-mapping .yml binds to the name of the admin role to which the Admins container from AD is assigned. It is enough for the user from the AD account to log in to the application with the privileges that are assigned to admin role in the Energy Logserver. At the same time, if it is the first login in the Energy Logserver, an account is created with an entry that informs the application administrator that is was created by logging in with AD.
Similar, the mechanism will work if we have a role with an arbitrary name created in Energy Logserver Logistics and connected to the name of the role-mappings.yml and existing in AD any container.
Below a screenshot of the console on which are marked accounts that were created by uesrs logging in from AD
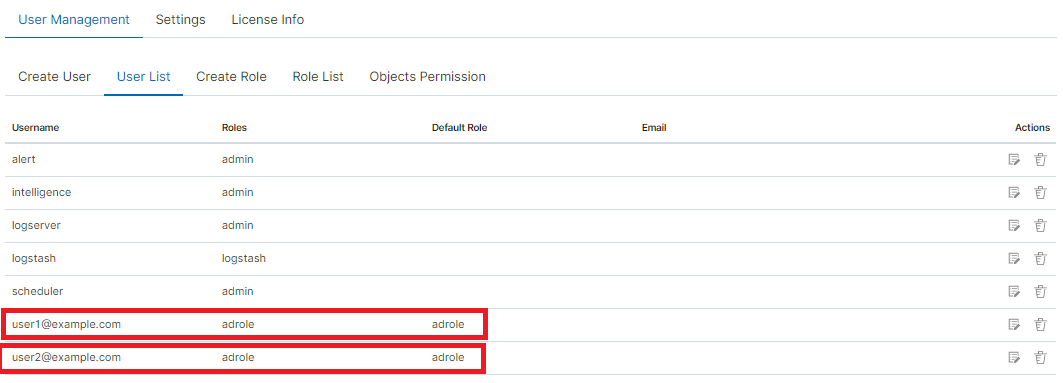
If you map roles with from several domains, for example dev.examloe1.com, dev.example2.com then in User List we will see which user from which domain with which role logged in Energy Logserver.
Password encryption
For security reason you can provide the encrypted password for Active Directory integration. To do this use pass-encrypter.sh script that is located in the Utils directory in installation folder.
Installation of pass-encrypter
cp -pr /instalation_folder/elasticsearch/pass-en00
000crypter /usr/share/elasticsearch/
Use pass-encrypter
 # /usr/share/elasticsearch/utils/pass-encrypter/pass-encrypter.sh
 Enter the string for encryption :
 new_password
 Encrypted string : MTU1MTEwMDcxMzQzMg==1GEG8KUOgyJko0PuT2C4uw==
Authentication with Radius
To use the Radius protocol, install the latest available version of Energy Logserver.
Configuration
The default configuration file is located at /etc/elasticsearch/properties.yml:
	# Radius opts
	#radius.host: "10.4.3.184"
	#radius.secret: "querty1q2ww2q1"
	#radius.port: 1812
Use appropriate secret based on config file in Radius server. The secret is configured on clients.conf in Radius server.
In this case, since the plugin will try to do Radius auth then client IP address should be the IP address where the Elasticsearch is deployed.
Every user by default at present get the admin role
Authentication with LDAP
To use OpenLDAP authorization, install or update Energy Logserver 7.0.2.
Configuration
The default configuration file is located at /etc/elasticsearch/properties.yml:
ldap_groups_search - Enable Open LDAP authorization. The
ldap_groups_searchswitch with true / false values.search filter - you can define
search_filterfor each domain. When polling the LDAP / AD server, the placeholder is changed touserId(everything before @domain) of the user who is trying to login. Sample search_filter:search_filter: "(&(objectClass=inetOrgPerson)(cn=%s))"If no search_filter is given, the default will be used:
(&(&(objectCategory=Person)(objectClass=User))(samaccountname=%s))
max_connections - for each domain (must be> = 1), this is the maximum number of connections that will be created with the LDAP / AD server for a given domain. Initially, one connection is created, if necessary another, up to the maximum number of connections set. If max_connections is not given, the default value = 10 will be used.
ldap_groups_search - filter will be used to search groups on the AD / LDAP server of which the user is trying to login. An example of groups_search_filter that works quite universally is:
groups_search_filter: "(|(uniqueMember=%s)(member=%s))"Sample configuration:
licenseFilePath: /usr/share/elasticsearch/

ldaps:

    - name: "dev.it.example.com"
      host: "192.168.0.1"
      port: 389                                                  # optional, default 389
      #ssl_enabled: false                                        # optional, default true
      #ssl_trust_all_certs: true                                 # optional, default false
      bind_dn: "Administrator@dev2.it.example.com"
      bind_password: "Buspa#mexaj1"
      search_user_base_DN: "OU=lab,DC=dev,DC=it,DC=example,DC=pl"
      search_filter: "(&(objectClass=inetOrgperson)(cn=%s))"     # optional, default "(&(&(objectCategory=Person)(objectClass=User))(samaccountname=%s))"
      user_id_attribute: "uid"                                   # optional, default "uid"
      search_groups_base_DN: "OU=lab,DC=dev,DC=it,DC=example,DC=pl" # base DN, which will be used for searching user's groups in LDAP tree
      groups_search_filter: "(member=%s)"                        # optional, default (member=%s), if ldap_groups_search is set to true, this filter will be used for searching user's membership of LDAP groups
      ldap_groups_search: false                                  # optional, default false - user groups will be determined basing on user's memberOf attribute
      unique_member_attribute: "uniqueMember"                    # optional, default "uniqueMember"
      max_connections: 10                                        # optional, default 10
      connection_timeout_in_sec: 10                              # optional, default 1
      request_timeout_in_sec: 10                                 # optional, default 1
      cache_ttl_in_sec: 60                                       # optional, default 0 - cache disabled
When the password is longer than 20 characters, we recommend using our pass-encrypter, otherwise backslash must be escaped with another backslash. Endpoint
role-mapping/_reloadhas been changed to_role-mapping/reload. This is a unification of API conventions, in accordance with Elasticsearch conventions.
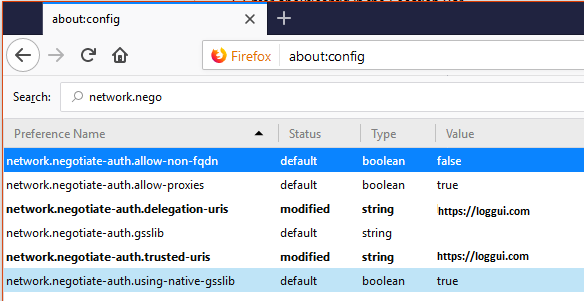
Configuring Single Sign On (SSO)
In order to configure SSO, the system should be accessible by domain name URL, not IP address nor localhost.
Ok :https://loggui.com:5601/login. Wrong : https://localhost:5601/login, https://10.0.10.120:5601/login
In order to enable SSO on your system follow below steps. The configuration is made for AD: dev.example.com, GUI URL: loggui.com
Configuration steps
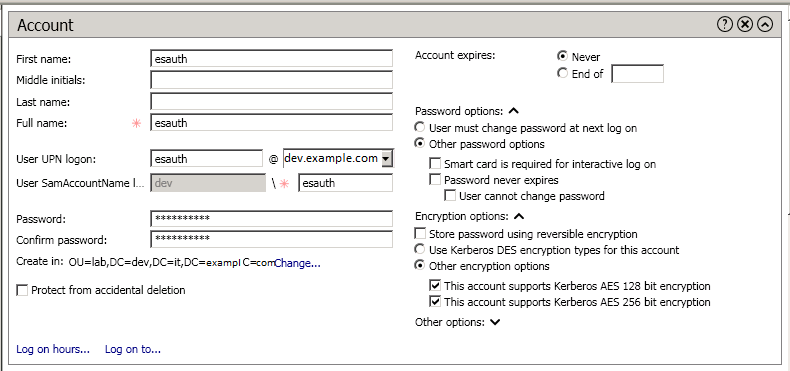
Create an User Account for Elasticsearch auth plugin
In this step, a Kerberos Principal representing Elasticsearch auth plugin is created on the Active Directory. The principal name would be
name@DEV.EXAMPLE.COM, while theDEV.EXAMPLE.COMis the administrative name of the realm. In our case, the principal name will beesauth@DEV.EXAMPLE.COM.Create User in AD. Set “Password never expires” and “Other encryption options” as shown below:
Define Service Principal Name (SPN) and Create a Keytab file for it
Use the following command to create the keytab file and SPN:
C:> ktpass -out c:\Users\Administrator\esauth.keytab -princ HTTP/loggui.com@DEV.EXAMPLE.COM -mapUser esauth -mapOp set -pass 'Sprint$123' -crypto ALL -pType KRB5_NT_PRINCIPAL
Values highlighted in bold should be adjusted for your system. The
esauth.keytabfile should be placed on your elasticsearch node - preferably/etc/elasticsearch/with read permissions for elasticsearch user:chmod 640 /etc/elasticsearch/esauth.keytabchown elasticsearch: /etc/elasticsearch/esauth.keytabCreate a file named krb5Login.conf:
com.sun.security.jgss.initiate{
    com.sun.security.auth.module.Krb5LoginModule required
    principal="esauth@DEV.EXAMPLE.COM" useKeyTab=true
    keyTab=/etc/elasticsearch/esauth.keytab storeKey=true debug=true;
    };
com.sun.security.jgss.krb5.accept {
    com.sun.security.auth.module.Krb5LoginModule required
    principal="esauth@DEV.EXAMPLE.COM" useKeyTab=true
    keyTab=/etc/elasticsearch/esauth.keytab storeKey=true debug=true;
    };
Principal user and keyTab location should be changed as per the values created in the step 2. Make sure the domain is in UPPERCASE as shown above. The
krb5Login.conffile should be placed on your elasticsearch node, for instance/etc/elasticsearch/with read permissions for elasticsearch user:Ssudo chmod 640 /etc/elasticsearch/krb5Login.conf sudo chown elasticsearch: /etc/elasticsearch/krb5Login.conf
Append the following JVM arguments (on Elasticsearch node in /etc/sysconfig/elasticsearch)
> -Dsun.security.krb5.debug=true -Djava.security.krb5.realm=**DEV.EXAMPLE.COM** -Djava.security.krb5.kdc=**AD_HOST_IP_ADDRESS** -Djava.security.auth.login.config=**/etc/elasticsearch/krb5Login.conf** -Djavax.security.auth.useSubjectCredsOnly=false
Change the appropriate values in the bold. This JVM arguments has to be set for Elasticsearch server.
Add the following additional (sso.domain, service_principal_name, service_principal_name_password) settings for ldap in elasticsearch.yml or properties.yml file wherever the ldap settings are configured:
sso.domain: "dev.example.com"
ldaps:
- name: "dev.example.com"
    host: "IP_address"
    port: 389                                                 # optional, default 389
    ssl_enabled: false                                        # optional, default    true
    ssl_trust_all_certs: false                                 # optional, default false
    bind_dn: "Administrator@dev.example.com"                     # optional, skip for anonymous bind
    bind_password: "administrator_password"                                 # optional, skip for anonymous bind
    search_user_base_DN: "OU=lab,DC=dev,DC=it,DC=example,DC=com"
    user_id_attribute: "uid"                                  # optional, default "uid"
    search_groups_base_DN: "OU=lab,DC=dev,DC=it,DC=example,DC=com"
    unique_member_attribute: "uniqueMember"                   # optional, default "uniqueMember"
    service_principal_name: "esauth@DEV.EXAMPLE.COM"
    service_principal_name_password : "Sprint$123"
Note: At this moment, SSO works for only single domain. So you have to mention for what domain SSO should work in the above property
sso.domainTo apply the changes restart Elasticsearch service
sudo systemctl restart elasticsearch.service
Enable SSO feature in
kibana.ymlfile:kibana.sso_enabled: trueAfter that Kibana has to be restarted:
sudo systemctl restart kibana.service
Client (Browser) Configuration##
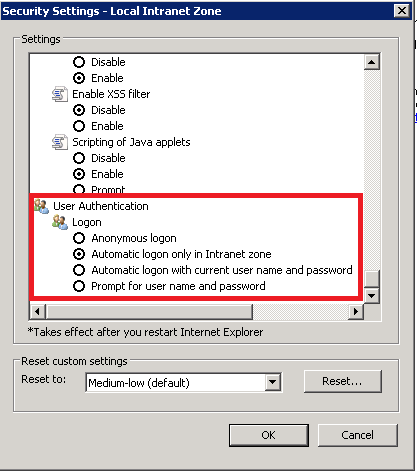
Internet Explorer configuration
- Goto
Internet OptionsfromToolsmenu and click onSecurityTab:
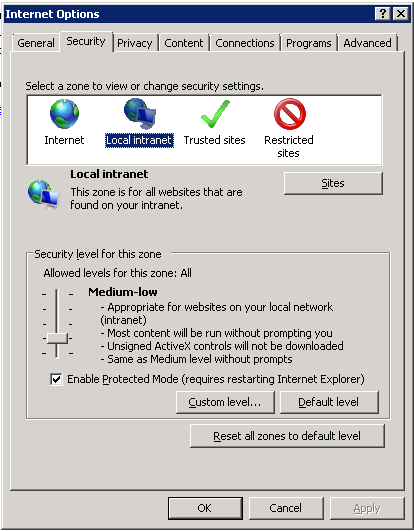
- Select
Local intranet, click onSite->Advanced->Addthe url:
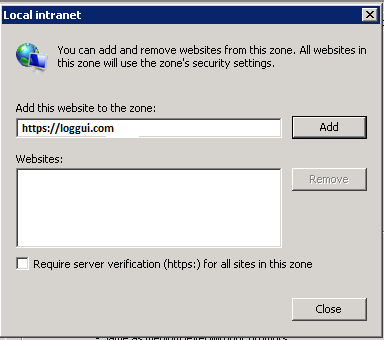
After adding the site click close.
- Click on custom level and select the option as shown below:
Chrome configuration
For Chrome, the settings are taken from IE browser.
Default home page
To set the default application for the GUI home page, please do the following:
edit
/etc/kibana/kibana.ymlconfiguration file:vi /etc/kibana/kibana.yml
change the following directives:
# Home Page settings
#kibana.defaultAppId: "home"
example:
# Home Page settings
kibana.defaultAppId: "alerts"
Configure email delivery
Configure email delivery for sending PDF reports in Scheduler.
The default e-mail client that installs with the Linux CentOS system, which is used by Energy Logserver to send reports (Section 5.3 of the Reports chapter), is postfix.# Configuration file for postfix mail client #
The postfix configuration directory for CentOS is /etc/postfix. It contains files:
main.cf - the main configuration file for the program specifying the basics parameters
Some of its directives:
 |**Directive**            |       **Description**                                                                                    |
 | ------------------------| ---------------------------------------------------------------------------------------------------------|
 |queue\_directory         |       The postfix queue location.
 |command\_directory       |      The location of Postfix commands.
 |daemon\_directory        |       Location of Postfix daemons.
 |mail\_owner              |       The owner of Postfix domain name of the server
 |myhostname               |       The fully qualified domain name of the server.
 |mydomain                 |       Server domain
 |myorigin                 |       Host or domain to be displayed as origin on email leaving the server.
 |inet\_interfaces         |       Network interface to be used for incoming email.
 |mydestination            |       Domains from which the server accepts mail.
 |mynetworks               |       The IP address of trusted networks.
 |relayhost                |       Host or other mail server through which mail will be sent. This server will act as an outbound gateway.
 |alias\_maps              |       Database of asliases used by the local delivery agent.
 |alias\_database          |       Alias database generated by the new aliases command.
 |mail\_spool\_directory   |       The location where user boxes will be stored.
master.cf - defines the configuration settings for the master daemon and the way it should work with other agents to deliver mail. For each service installed in the master.cf file there are seven columns that define how the service should be used.
 |Column           |     Description
 |---------------- | --------------------------------------------------------------------------------------------
 |service          |    The name of the service
 |type             |    The transport mechanism to be user.
 |private          |    Is the service only for user by Postfix.
 |unpriv           |    Can the service be run by ordinary users
 |chroot           |    Whether the service is to change the main directory (chroot) for the mail. Queue.
 |wakeup           |    Wake up interval for the service.
 |maxproc          |    The maximum number of processes on which the service can be forked (to divide in branches)
 |command + args   |   A command associated with the service plus any argument
access - can be used to control access based on e-mail address, host address, domain or network address.
Examples of entries in the file
 |Description                                     | Example
 |------------------------------------------------|--------------------
 |To allow access for specific IP address:        | 192.168.122.20 OK
 |To allow access for a specific domain:          | example.com OK
 |To deny access from the 192.168.3.0/24 network: | 192.168.3 REJECT
After making changes to the access file, you must convert its contents to the access.db database with the postmap command:
 	# postmap /etc/postfix/access
 	# ll /etc/postfix/access*

 	-rw-r\--r\--. 1 root root 20876 Jan 26 2014 /etc/postfix/access
 	-rw-r\--r\--. 1 root root 12288 Feb 12 07:47 /etc/postfix/access.db
canonical - mapping incoming e-mails to local users.
Examples of entries in the file:
To forward emails to user1 to the [[user1@yahoo.com] mailbox:
user1 user1\@yahoo.com
To forward all emails for example.org to another example.com domain:
@example.org @example.com
After making changes to the canonical file, you must convert its contents to the canonical.db database with the postmap command:
# postmap /etc/postfix/canonical
# ll /etc/postfix/canonical*

-rw-r\--r\--. 1 root root 11681 2014-06-10 /etc/postfix/canonical
-rw-r\--r\--. 1 root root 12288 07-31 20:56 /etc/postfix/canonical.db
generic - mapping of outgoing e-mails to local users. The syntax is the same as a canonical file. After you make change to this file, you must also run the postmap command.
# postmap /etc/postfix/generic
# ll /etc/postfix/generic*

-rw-r\--r\--. 1 root root 9904 2014-06-10 /etc/postfix/generic
-rw-r\--r\--. 1 root root 12288 07-31 21:15 /etc/postfix/generic.db
reloceted – information about users who have been transferred. The syntax of the file is the same as canonical and generic files.
Assuming tha user1 was moved from example.com to example.net, you can forward all emails received on the old address to the new address:
Example of an entry in the file:
user1@example.com user1@example.net
After you make change to this file, you must also run the postmap command.
# postmap /etc/postfix/relocated
# ll /etc/postfix/relocated*

-rw-r\--r\--. 1 root root 6816 2014-06-10 /etc/postfix/relocated
-rw-r\--r\--. 1 root root 12288 07-31 21:26 /etc/postfix/relocated.d
transport – mapping between e-mail addresses and server through which these e-mails are to be sent (next hops) int the transport format: nexthop.
Example of an entry in the file:
user1@example.com smtp:host1.example.com
After you make changes to this file, you must also run the postmap command.
# postmap /etc/postfix/transport
[root@server1 postfix]# ll /etc/postfix/transport*

-rw-r\--r\--. 1 root root 12549 2014-06-10 /etc/postfix/transport
-rw-r\--r\--. 1 root root 12288 07-31 21:32 /etc/postfix/transport.db
virtual - user to redirect e-mails intended for a certain user to the account of another user or multiple users. It can also be used to implement the domain alias mechanism.
Examples of the entry in the file:
Redirecting email for user1, to root users and user3:
user1 root, user3
Redirecting email for user 1 in the example.com domain to the root user:
user1@example.com root
After you make change to this file, you must also run the postmap command:
# postmap /etc/postfix/virtual
# ll /etc/postfix/virtual

-rw-r\--r\--. 1 root root 12494 2014-06-10 /etc/postfix/virtual
-rw-r\--r\--. 1 root root 12288 07-31 21:58 /etc/postfix/virtual.db
Basic postfix configuration
Base configuration of postfix application you can make in
/etc/postfix/main.cfg configuration file, which must complete
with the following entry:
section # RECEIVING MAIL
  inet_interfaces = all
  inet_protocols = ipv4
section # INTERNET OR INTRANET
relayhost = [IP mail server]:25 (port number)
I the netxt step you must complete the canonical file of postfix
At the end you should restart the postfix:
systemctl restart postfix
Example of postfix configuration with SSL encryption enabled
To configure email delivery with SSL encryption you need to make the following changes in the postfix configuration files:
/etc/postfix/main.cf- file should contain the following entries in addition to standard (unchecked entries):mydestination = $myhostname, localhost.$mydomain, localhost myhostname = example.com relayhost = [smtp.example.com]:587 smtp_sasl_auth_enable = yes smtp_sasl_password_maps = hash:/etc/postfix/sasl_passwd smtp_sasl_security_options = noanonymous smtp_tls_CAfile = /root/certs/cacert.cer smtp_use_tls = yes smtp_sasl_mechanism_filter = plain, login smtp_sasl_tls_security_options = noanonymous canonical_maps = hash:/etc/postfix/canonical smtp_generic_maps = hash:/etc/postfix/generic smtpd_recipient_restrictions = permit_sasl_authenticated
/etc/postfix/sasl/passwd- file should define the data for authorized[smtp.example.com\]:587 [[USER@example.com:PASS]](mailto:USER@example.com:PASS)
You need to give appropriate permissions:
chmod 400 /etc/postfix/sasl_passwd
and map configuration to database:
postmap /etc/postfix/sasl_passwd
next you need to generate a ca cert file:
cat /etc/ssl/certs/Example\_Server\_CA.pem | tee -a etc/postfix/cacert.pem
And finally, you need to restart postfix
/etc/init.d/postfix restart
Custom notification on workstation
The mechanism of personalization of notification at the workstation will be implemented by combining alerting mechanisms, triggering integrated commands and triggering interaction scripts allowing for the transfer of a personalized notification to the workstation. The notifications will use the specific script, which has the ability to inform all logged in users or the selected one about the detection of individual incidents.
Configuration steps
Create a new alert rule or edit an existing one according to the instruction: Creating Alerts,
In
Alert Methodfield select theCommandmethod,Add the following scritp name to
Path to script/commandfiled:notifyworkstation.py
Agents module
Before use ensure that you have all required files
Script for creating necessary certificates: ./agents/masteragent/certificates/generate_certs.sh;
Logstash utilites:
  ./integrations/masteragent/conf.d/masteragent {01-input-agents.conf, 050-filter-agents.conf, 100-output-agents.conf}
  ./integrations/masteragent/masteragent.yml.off.
Linux Agent files:
./agents/masteragent/agents/linux/masteragent:
Executable: MasterBeatAgent.jar
Configuration File for MasterAgent (server): MasterBeatAgent.conf
Configuration File for Agent (client): agent.conf
Service file: masteragent.service
Preparations
EVERY COMMAND HAVE TO BE EXECUTED FROM /INSTALL DIRECTORY.
- Generate the certificates using generate_certs.sh script from
./agents/masteragent/certificates directory.
- Fill DOMAIN, DOMAIN_IP, COUNTRYNAME, STATE, COMPANY directives at the beggining of the script. Note that DOMAIN_IP represents IP of host running logstash.
- Generate certs:
# bash ./agents/masteragent/certificates/generate_certs.sh
- Set KeyStore password of your choice that is utilised to securely store certificates.
- Type ‘yes’ when “Trust this certificate?” monit will be shown.
- Set TrusStore password of your choice that is used to secure CAs. Remember entered passwords - they’ll be used later!
- Configure firewall to enable communication on used ports (defaults: TCP 8080 -> logstash, TCP 8081 -> agent’s server).
- These ports can be changed, but must reflect “port” and “logstash” directives from agent.conf file to ensure connection with agent.
- Commands for default ports:
# firewall-cmd --permanent --zone public --add-port 8080/tcp
# firewall-cmd --permanent --zone public --add-port 8081/tcp
- Configure Logstash:
- Copy files:
# cp -rf ./integrations/masteragent/conf.d/* /etc/logstash/conf.d/
- Copy pipeline configuration:
# cp -rf ./integrations/masteragent/*.yml.off /etc/logstash/pipelines.d/masteragent.yml
# cat ./integrations/masteragent/masteragent.yml.off >> /etc/logstash/pipelines.yml`
- Configure SSL connection, by copying previously generated certificates:
# mkdir -p /etc/logstash/conf.d/masteragent/ssl
# /bin/cp -rf ./agents/masteragent/certificates/localhost.* ./agents/masteragent/certificates/rootCA.crt /etc/logstash/conf.d/masteragent/ssl/
- Set permissions:
# chown -R logstash:logstash /etc/logstash/conf.d/masteragent
- Restart service:
# systemctl restart logstash
Installation of MasterAgent - Server Side
- Copy executable and config:
# mkdir -p /opt/agents
# /bin/cp -rf ./agents/masteragent/agents/linux/masteragent/MasterBeatAgent.jar /opt/agents
# /bin/cp -rf ./agents/masteragent/agents/linux/masteragent/MasterBeatAgent.conf /opt/agents/agent.conf
- Copy certificates:
# /bin/cp -rf ./agents/masteragent/certificates/node_name.p12 ./agents/masteragent/certificates/root.jks /opt/agents/
- Set permissions:
# chown -R kibana:kibana /opt/agents
- Update configuration file with KeyStore/TrustStore paths and passwords. Use your preferred editor eg. vim:
# vim /opt/agents/agent.conf
Installation of Agent - Client Side
FOR WINDOWS AND LINUX: `Client requires at least Java 1.8+.
Linux Agent - software installed on clients running on Linux OS:
- Install net-tools package to use Agent on Linux RH / Centos:
# yum install net-tools
- Copy executable and config:
# mkdir -p /opt/masteragent
# /bin/cp -rf ./agents/masteragent/agents/linux/masteragent/agent.conf ./agents/masteragent/agents/linux/masteragent/MasterBeatAgent.jar /opt/masteragent
# /bin/cp -rf ./agents/masteragent/agents/linux/masteragent/masteragent.service /usr/lib/systemd/system/masteragent.service
- Copy certificates:
# /bin/cp -rf ./certificates/node_name.p12 ./certificates/root.jks /opt/masteragent/
- Update configuration file with KeyStore/TrustStore paths and passwords. Also update IP and port (by default 8080 is used) of the logstash host that agent will connect to with ‘logstash’ directive. Use your preferred editor eg. vim:
# vim /opt/masteragent/agent.conf
- Enable masteragent service:
# systemctl daemon-reload
# systemctl enable masteragent
# systemctl start masteragent
- Finally verify in Kibana ‘Agents’ plugin if newly added agent is present. Check masteragent logs executing:
# journalctl -fu masteragent
Windows Agent - software installed on clients running on Windows OS:
FOR WINDOWS AND LINUX: `Client requires at least Java 1.8+.
- Ensure that you have all required files (
./install/agents/masteragent/agents/windows/masteragent):
- Installer and manifest:
agents.exe,agents.xml - Client:
Agents.jar - Configuration File:
agent.conf
- Configure firewall:
Add an exception to the firewall to listen on TCP port 8081.
Add an exception to the firewall to allow outgoing connection to TCP port masteragent:8080 (reasonable only with configured “http_enabled = true”)
- Create
C:\Program Files\MasterAgentdirectory. - Copy the contents of the
./install/agents/masteragent/agents/windows/masteragentdirectory to theC:\Program Files\MasterAgent. - Copy node_name.p12 and root.jks files from the
./install/agents/masteragent/certificatesto desired directory. - Update “
C:\Program Files\MasterAgent\agent.conf” file with KeyStore/TrustStore paths from previous step and passwords. Also update IP and port (by default 8080 is used) of the logstash host that agent will connect to with ‘logstash’ directive. - Start PowerShell as an administrator:
To install agent you can use interchangeably the following methods:
- Method 1 - use installer:
# cd "C:\Program Files\MasterAgent"
# .\agents.exe install
# .\agents.exe start
- Method 2 - manually creating service:
# New-Service -name masteragent -displayName masteragent -binaryPathName "C:\Program Files\MasterAgent\agents.exe"
- Finally verify in Kibana ‘
Agents’ plugin if newly added agent is present. To check out logs and errors, look for ‘agents.out.log’ and ‘agents.err.log’ files inC:\Program Files\MasterAgentdirectory after service start. Also check the service status:
# .\agents.exe status
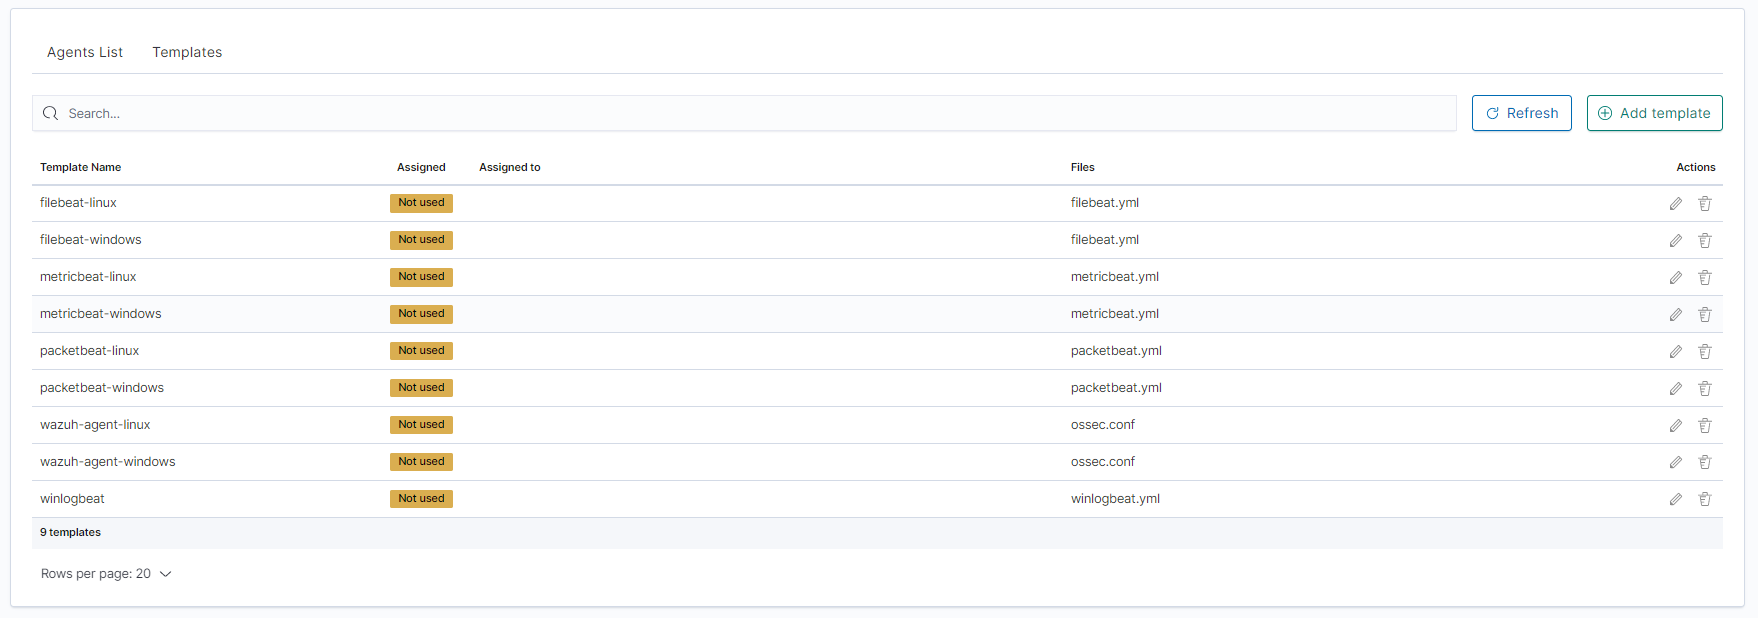
Beats - configuration templates
- Go to the
Agentsthat is located in main manu. Then go toTemplatesand clickAdd templatebutton.
- Click
Create newfile button at the bottom.
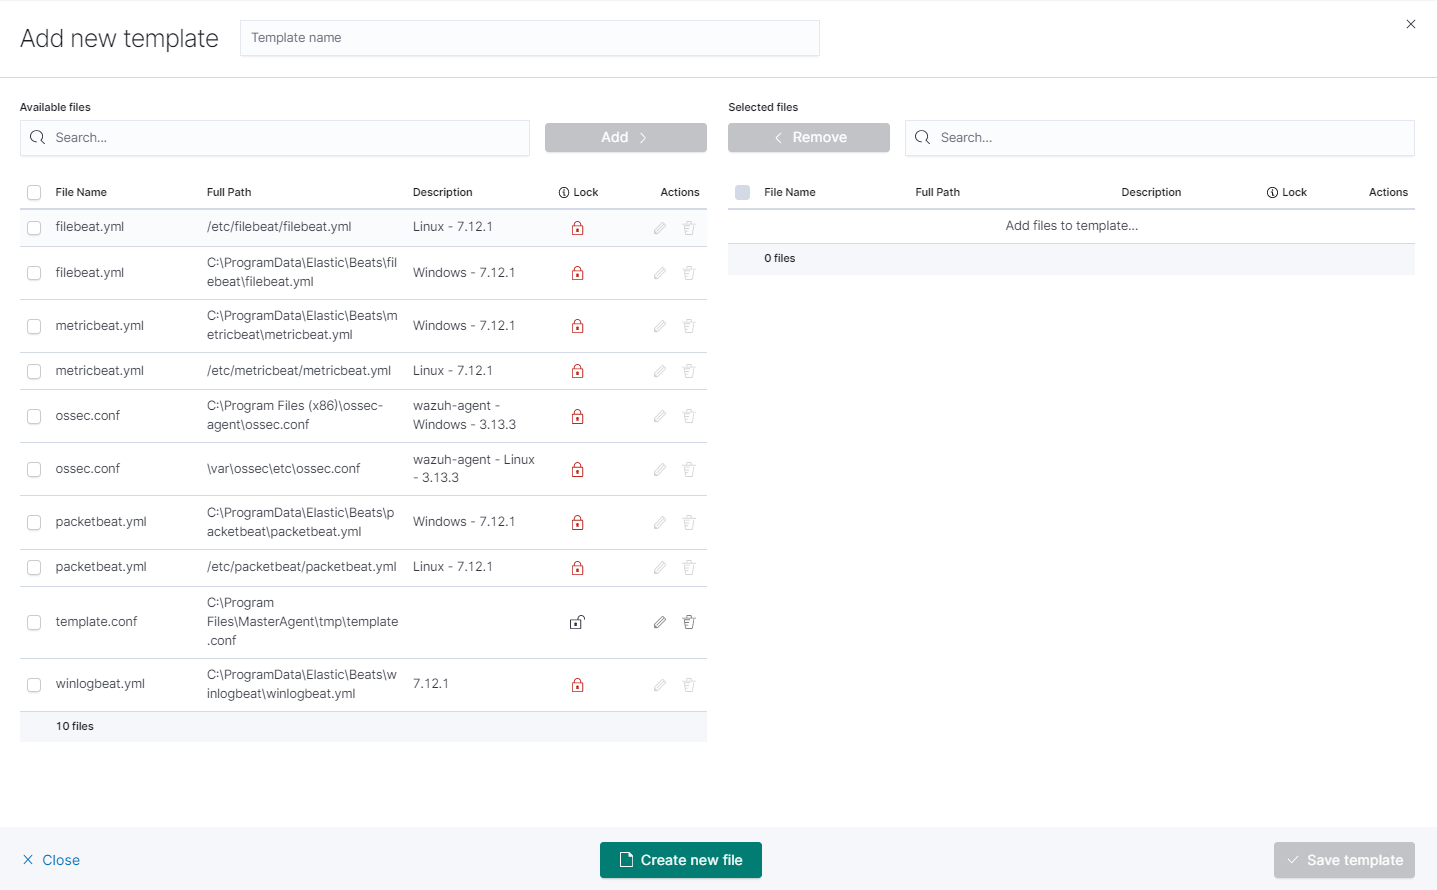
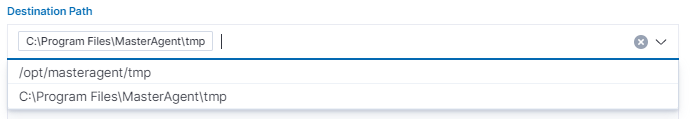
- you will see form to create file that will be on client system. There are inputs such as:
- Destination Path,
- File name,
- Description,
- Upload file,
- Content.
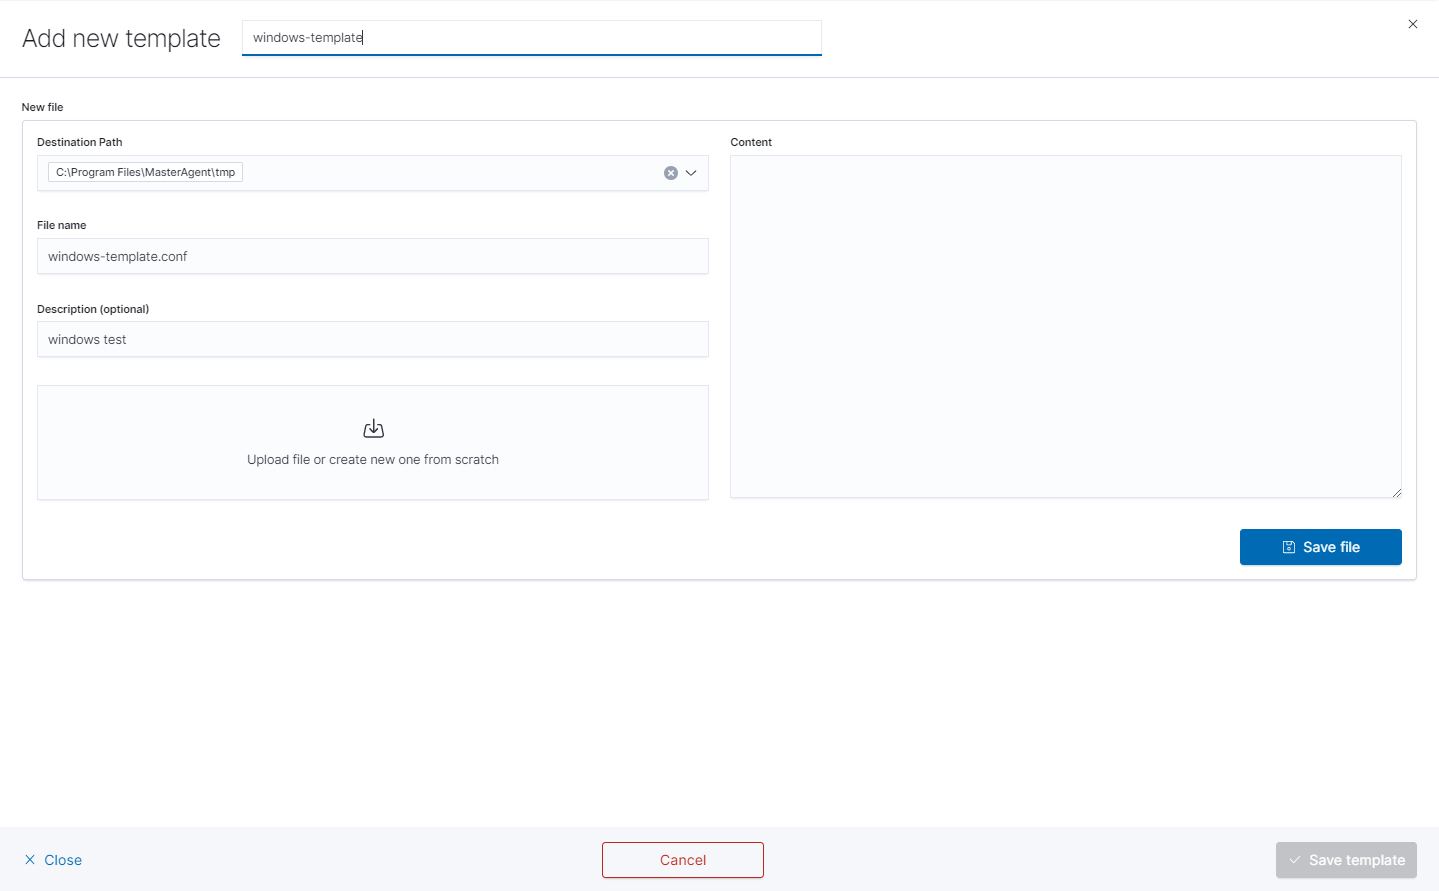
- Remember that you must provide the exact path to your directory in Destination Path field
- After that add your file to template by checking it from
Available fileslist and clickingAddand thenCreate new file.
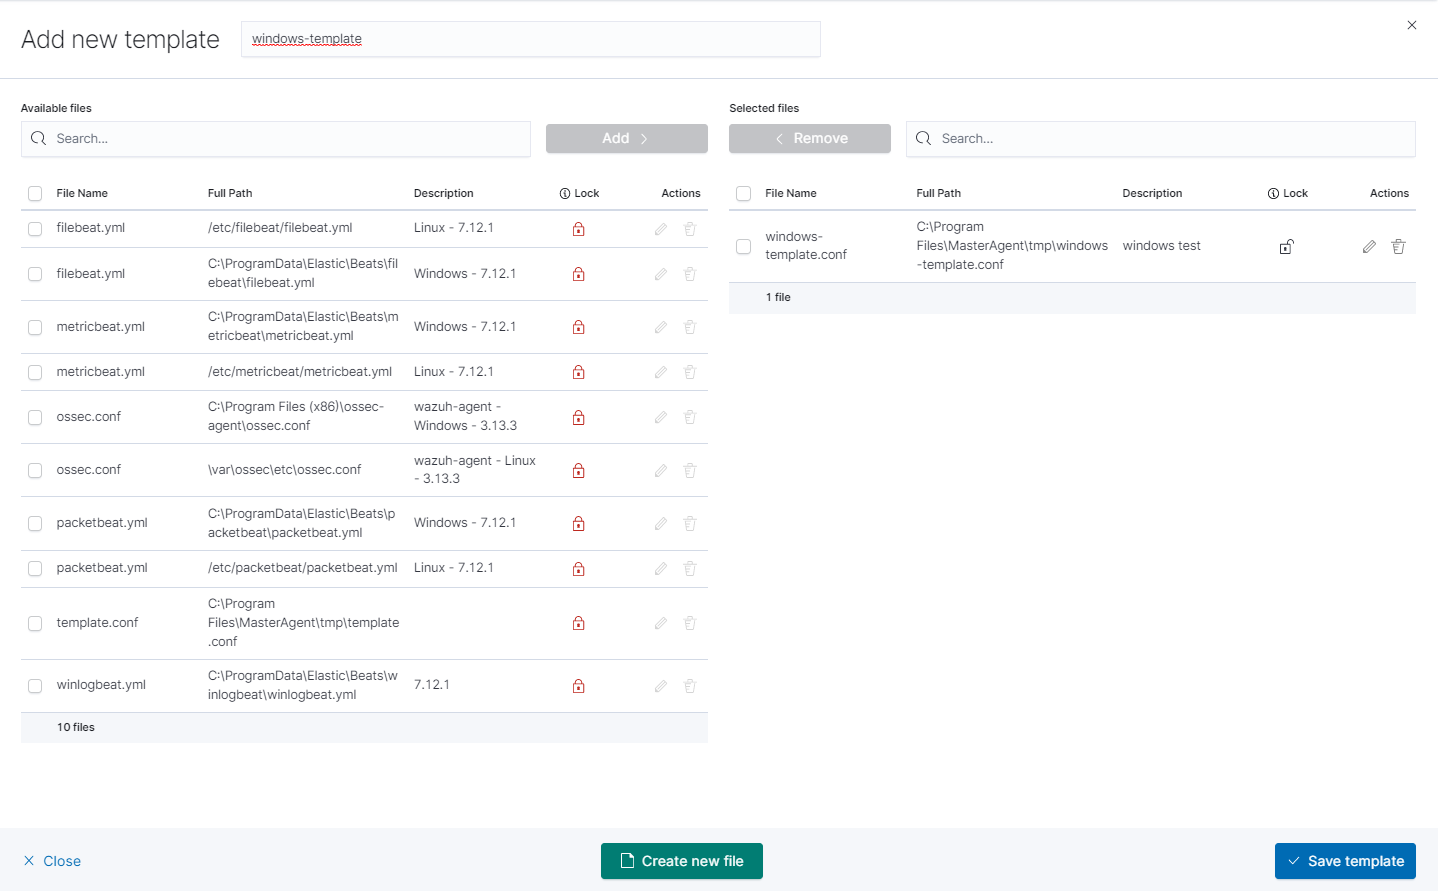
- You can now see your template in the
Templatetab
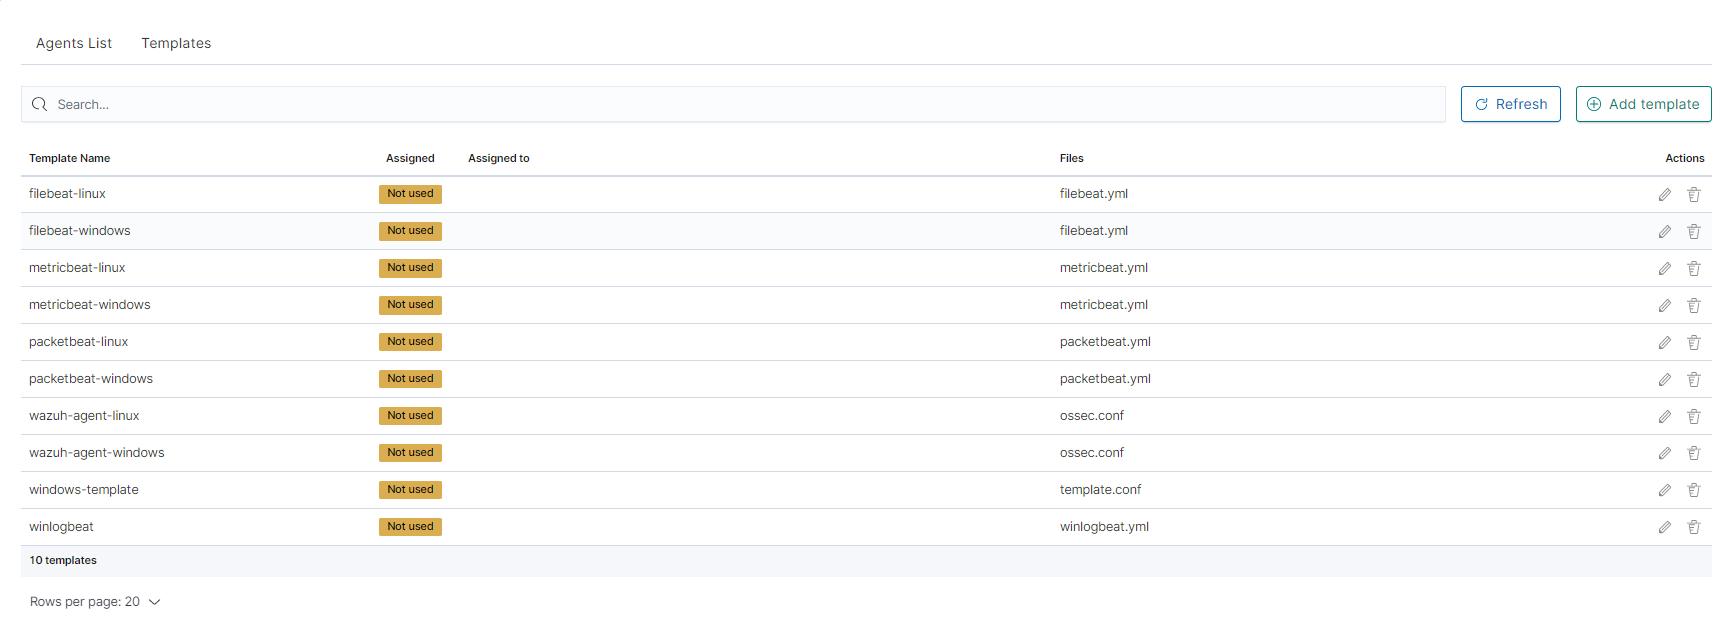
- The next step will be to add the template to the agent by checking the agent’s form list and clicking
Apply Template.
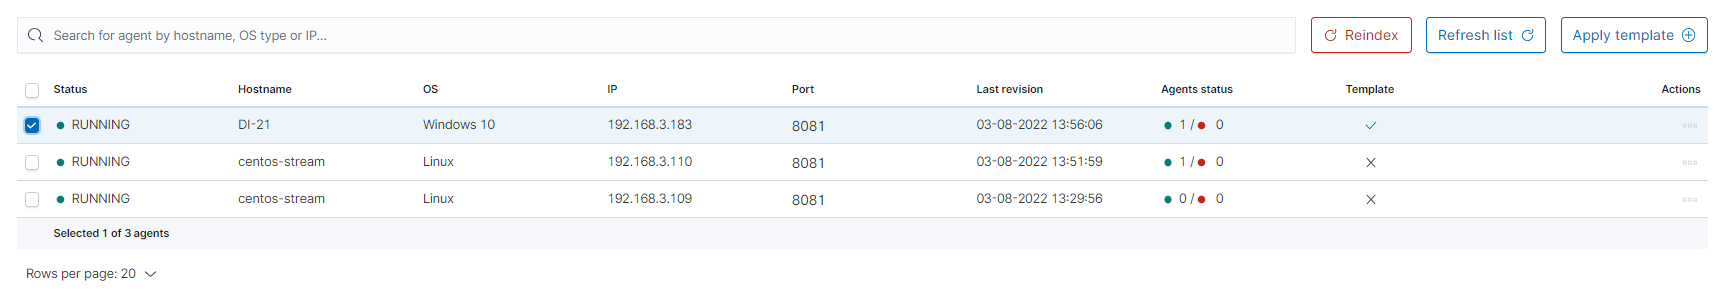
- Last step is apply template by checking it from list and clicking
Applybutton.
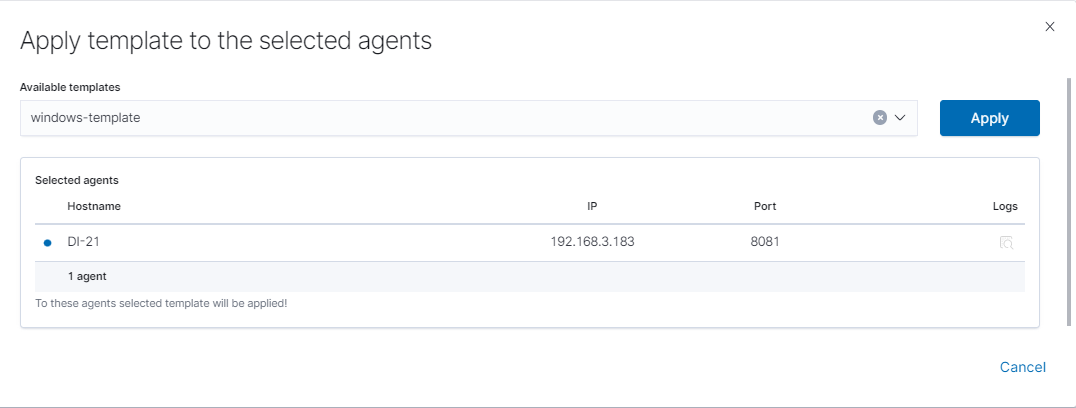
You can also select multiple agents. Remember, if your file path is Windows type You can only select Windows agents.
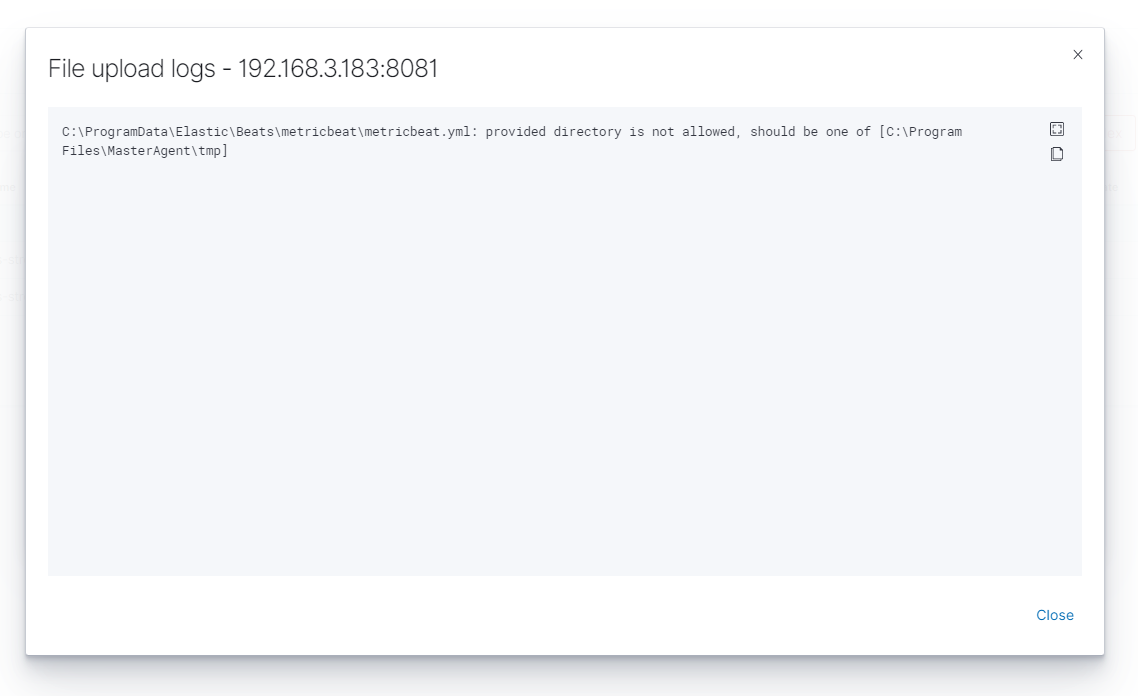
You can check the Logs by clicking the icon in the logs column.
Windows Agent installation
Add an exception to the firewall to listen on TCP port 8081.
Add an exception to the firewall enabling connection on TCP LOGSTASH_IP:8080 port.
Copy content of the ./agents/windows from installation directory to “C:\Program Files\MasterAgnet”
Change IP address of the Kibana GUI server and Logstash server in “C:\Program Files\MasterAgnet\agent.conf” file.
In order to install the service, start the console as an administrator and execute the following commands:
cd "C:\Program Files\MasterAgent"
agents.exe install
agents.exe start
An alternative method of installing the service, run the PowerShell console as administrator and execute the following commands:
New-Service -name masteragent -displayName masteragent - binaryPathName "C:\Program Files\MasterAgent\agents.exe"Check status of service via services.msc (if stoped, try start it agian).
In the GUI, in the Agents tab, you can check the status of the newly connected host.
Agent module compatibility
The Agents module works with Beats agents in the following versions:
| Nr | Agent Name | Beats Version | Link to download |
|---|---|---|---|
1 |
Filebeat |
OSS 6.8.14 |
https://www.elastic.co/downloads/past-releases/filebeat-oss-6-8-13 |
2 |
Packetbeat |
OSS 6.8.14 |
https://www.elastic.co/downloads/past-releases/packetbeat-oss-6-8-13 |
3 |
Winlogbeat |
OSS 6.8.14 |
https://www.elastic.co/downloads/past-releases/winlogbeat-oss-6-8-13 |
4 |
Metricbeat |
OSS 6.8.14 |
https://www.elastic.co/downloads/past-releases/metricbeat-oss-6-8-13 |
5 |
Heartbeat |
OSS 6.8.14 |
https://www.elastic.co/downloads/past-releases/heartbeat-oss-6-8-13 |
6 |
Auditbeat |
OSS 6.8.14 |
https://www.elastic.co/downloads/past-releases/auditbeat-oss-6-8-13 |
7 |
Logstash |
OSS 6.8.14 |
https://www.elastic.co/downloads/past-releases/logstash-oss-6-8-13 |
Beats agents installation
Windows
Winlogbeat
Installation
- Copy the Winlogbeat installer from the installation directory
install/Agents/beats/windows/winlogbeat-oss-6.8.14-windows-x86_64.zipand unpack - Copy the installation files to the
C:\Program Files\Winlogbeatdirectory
Configuration
Editing the file: C:\Program Files\Winlogbeat\winlogbeat.yml:
In section:
winlogbeat.event_logs:
  - name: Application
    ignore_older: 72h
  - name: Security
  - name: System
change to:
winlogbeat.event_logs:
  - name: Application
    ignore_older: 72h
  - name: Security
    ignore_older: 72h
  - name: System
    ignore_older: 72h
In section:
setup.template.settings:
  index.number_of_shards: 1
change to:
#setup.template.settings:
  #index.number_of_shards: 1
In section:
setup.kibana:
change to:
#setup.kibana:
In section:
output.elasticsearch:
  # Array of hosts to connect to.
  hosts: ["localhost:9200"]
change to:
#output.elasticsearch:
  # Array of hosts to connect to.
  #hosts: ["localhost:9200"]
In section:
#output.logstash:
  # The Logstash hosts
  #hosts: ["localhost:5044"]
change to:
output.logstash:
  # The Logstash hosts
  hosts: ["LOGSTASH_IP:5044"]
In section:
#tags: ["service-X", "web-tier"]
change to:
tags: ["winlogbeat"]
Run the PowerShell console as Administrator and execute the following commands:
cd 'C:\Program Files\Winlogbeat'
.\install-service-winlogbeat.ps1

Security warning
Run only scripts that you trust. While scripts from the internet can be useful,
this script can potentially harm your computer. If you trust this script, use
the Unblock-File cmdlet to allow the script to run without this warning message.
Do you want to run C:\Program Files\Winlogbeat\install-service-winlogbeat.ps1?
[D] Do not run  [R] Run once  [S] Suspend  [?] Help (default is "D"): R
Output:
Status   Name               DisplayName
------   ----               -----------
Stopped    Winlogbeat      Winlogbeat
Start Winlogbeat service:
sc start Winlogbeat
Test configuration:
cd 'C:\Program Files\Winlogbeat'
winlogbeat.exe test config
winlogbeat.exe test output
Filebeat
Installation
- Copy the Filebeat installer from the installation directory
install/Agents/beats/windows/filebeat-oss-6.8.14-windows-x86_64.zipand unpack - Copy the installation files to the
C:\Program Files\Filebeatdirectory
Configuration
Editing the file: C:\Program Files\Filebeat\filebeat.yml:
In section:
- type: log

  # Change to true to enable this input configuration.
  enabled: false
change to:
- type: log

  # Change to true to enable this input configuration.
  enabled: true
In section:
    paths:
    - /var/log/*.log
    #- c:\programdata\elasticsearch\logs\*
change to:
paths:
    #- /var/log/*.log
    #- c:\programdata\elasticsearch\logs\*
    - "C:\Program Files\Microsoft SQL Server\*\MSSQL\Log\*"
    - "C:\inetpub\logs\*""
In section:
setup.template.settings:
  index.number_of_shards: 1
change to:
#setup.template.settings:
  #index.number_of_shards: 1
In section:
setup.kibana:
change to:
#setup.kibana:
In section:
output.elasticsearch:
  # Array of hosts to connect to.
  hosts: ["localhost:9200"]
change to:
#output.elasticsearch:
  # Array of hosts to connect to.
  #hosts: ["localhost:9200"]
In section:
#output.logstash:
  # The Logstash hosts
  #hosts: ["localhost:5044"]
change to:
output.logstash:
  # The Logstash hosts
  hosts: ["LOGSTASH_IP:5044"]
In section:
#tags: ["service-X", "web-tier"]
change to:
tags: ["filebeat"]
Run the PowerShell console as Administrator and execute the following commands:
cd 'C:\Program Files\Filebeat'
.\install-service-filebeat.ps1

Security warning
Run only scripts that you trust. While scripts from the internet can be useful,
this script can potentially harm your computer. If you trust this script, use
the Unblock-File cmdlet to allow the script to run without this warning message.
Do you want to run C:\Program Files\Filebeat\install-service-filebeat.ps1?
[D] Do not run  [R] Run once  [S] Suspend  [?] Help (default is "D"): R
Output:
Status   Name               DisplayName
------   ----               -----------
Stopped  Filebeat        Filebeat
Start Filebeat service:
sc start filebeat
You can enable, disable and list Filebeat modules using the following command:
cd 'C:\Program Files\Filebeat'
filebeat.exe modules list
filebeat.exe modules apache enable
filebeat.exe modules apache disable
Test configuration:
cd 'C:\Program Files\Filebeat'
filebeat.exe test config
filebeat.exe test output
Merticbeat
Installation
- Copy the Merticbeat installer from the installation directory
install/Agents/beats/windows/merticbeat-oss-6.8.14-windows-x86_64.zipand unpack - Copy the installation files to the
C:\Program Files\Merticbeatdirectory
Configuration
Editing the file: C:\Program Files\Merticbeat\metricbeat.yml:
In section:
setup.template.settings:
  index.number_of_shards: 1
  index.codec: best_compression
change to:
#setup.template.settings:
  #index.number_of_shards: 1
  #index.codec: best_compression
In section:
setup.kibana:
change to:
#setup.kibana:
In section:
output.elasticsearch:
  # Array of hosts to connect to.
  hosts: ["localhost:9200"]
change to:
#output.elasticsearch:
  # Array of hosts to connect to.
  #hosts: ["localhost:9200"]
In section:
#output.logstash:
  # The Logstash hosts
  #hosts: ["localhost:5044"]
change to:
output.logstash:
  # The Logstash hosts
  hosts: ["LOGSTASH_IP:5044"]
In section:
#tags: ["service-X", "web-tier"]
change to:
tags: ["metricbeat"]
Run the PowerShell console as Administrator and execute the following commands:
cd 'C:\Program Files\Metricbeat'
.\install-service-metricbeat.ps1

Security warning
Run only scripts that you trust. While scripts from the internet can be useful,
this script can potentially harm your computer. If you trust this script, use
the Unblock-File cmdlet to allow the script to run without this warning message.
Do you want to run C:\Program Files\Metricbeat\install-service-metricbeat.ps1?
[D] Do not run  [R] Run once  [S] Suspend  [?] Help (default is "D"): R
Output:
Status   Name               DisplayName
------   ----               -----------
Stopped  Metricbeat        Metricbeat
Start Filebeat service:
sc start metricbeat
You can enable, disable and list Metricbeat modules using the following command:
cd 'C:\Program Files\Metricbeat'
metricbeat.exe modules list
metricbeat.exe modules apache enable
metricbeat.exe modules apache disable
Test configuration:
cd 'C:\Program Files\Metricbeat'
metricbeat.exe test config
metricbeat.exe test output
Packetbeat
Installation
- Copy the Packetbeatinstaller from the installation directory
install/Agents/beats/windows/packetbeat-oss-6.8.14-windows-x86_64.zipand unpack - Copy the installation files to the
C:\Program Files\Packetbeatdirectory
Configuration
Editing the file: C:\Program Files\Packetbeat\packetbeat.yml:
In section:
setup.template.settings:
  index.number_of_shards: 3
change to:
#setup.template.settings:
  #index.number_of_shards: 3
In section:
setup.kibana:
change to:
#setup.kibana:
In section:
output.elasticsearch:
  # Array of hosts to connect to.
  hosts: ["localhost:9200"]
change to:
#output.elasticsearch:
  # Array of hosts to connect to.
  #hosts: ["localhost:9200"]
In section:
#output.logstash:
  # The Logstash hosts
  #hosts: ["localhost:5044"]
change to:
output.logstash:
  # The Logstash hosts
  hosts: ["LOGSTASH_IP:5044"]
In section:
#tags: ["service-X", "web-tier"]
change to:
tags: ["packetbeat"]
Run the PowerShell console as Administrator and execute the following commands:
cd 'C:\Program Files\\Packetbeat'
.\install-service-packetbeat.ps1

Security warning
Run only scripts that you trust. While scripts from the internet can be useful,
this script can potentially harm your computer. If you trust this script, use
the Unblock-File cmdlet to allow the script to run without this warning message.
Do you want to run C:\Program Files\Packetbeat\install-service-packetbeat.ps1?
[D] Do not run  [R] Run once  [S] Suspend  [?] Help (default is "D"): R
Output:
Status   Name               DisplayName
------   ----               -----------
Stopped  Packetbeat        Packetbeat
Start Packetbeat service:
sc start packetbeat
Test configuration:
cd 'C:\Program Files\Packetbeat'
packetbeat.exe test config
packetbeat.exe test output
Linux
Filebeat
Installation
Copy the Filebeat installer from the installation directory
install/Agents/beats/linux/filebeat-oss-6.8.14-x86_64.rpmInstall filebeat with following commadn:
yum install -y filebeat-oss-6.8.14-x86_64.rpm
Configuration
Editing the file: /etc/filebeat/filebeat.yml:
In section:
- type: log

  # Change to true to enable this input configuration.
  enabled: false
change to:
- type: log

  # Change to true to enable this input configuration.
  enabled: true
In section:
setup.template.settings:
  index.number_of_shards: 1
change to:
#setup.template.settings:
  #index.number_of_shards: 1
In section:
setup.kibana:
change to:
#setup.kibana:
In section:
output.elasticsearch:
  # Array of hosts to connect to.
  hosts: ["localhost:9200"]
change to:
#output.elasticsearch:
  # Array of hosts to connect to.
  #hosts: ["localhost:9200"]
In section:
#output.logstash:
  # The Logstash hosts
  #hosts: ["localhost:5044"]
change to:
output.logstash:
  # The Logstash hosts
  hosts: ["LOGSTASH_IP:5044"]
In section:
#tags: ["service-X", "web-tier"]
change to:
tags: ["filebeat"]
Start Filebeat service:
systemctl start filebeat
You can enable, disable and list Filebeat modules using the following command:
filebeat modules list
filebeat modules apache enable
filebeat modules apache disable
Test configuration:
filebeat test config
filebeat test output
Merticbeat
Installation
Copy the Merticbeatinstaller from the installation directory
install/Agents/beats/linux/metricbeat-oss-6.8.14-x86_64.rpmInstall Merticbeat with following command:
yum install -y metricbeat-oss-6.8.14-x86_64.rpm
Configuration
Editing the file: /etc/metricbeat/metricbeat.yml:
In section:
setup.template.settings:
  index.number_of_shards: 1
  index.codec: best_compression
change to:
#setup.template.settings:
  #index.number_of_shards: 1
  #index.codec: best_compression
In section:
setup.kibana:
change to:
#setup.kibana:
In section:
output.elasticsearch:
  # Array of hosts to connect to.
  hosts: ["localhost:9200"]
change to:
#output.elasticsearch:
  # Array of hosts to connect to.
  #hosts: ["localhost:9200"]
In section:
#output.logstash:
  # The Logstash hosts
  #hosts: ["localhost:5044"]
change to:
output.logstash:
  # The Logstash hosts
  hosts: ["LOGSTASH_IP:5044"]
In section:
#tags: ["service-X", "web-tier"]
change to:
tags: ["metricbeat"]
Start Filebeat service:
systemctl start metricbeat
You can enable, disable and list Metricbeat modules using the following command:
metricbeat modules list
metricbeat modules apache enable
metricbeat modules apache disable
Test configuration:
metricbeat test config
metricbeat test output
Packetbeat
Installation
Copy the Packetbeat installer from the installation directory
install/Agents/beats/linux/packetbeat-oss-6.8.14-x86_64.rpmInstall Packetbeatwith following command:
yum install -y packetbeat-oss-6.8.14-x86_64.rpm
Configuration
Editing the file: /etc/packetbeat/packetbeat.yml:
In section:
setup.template.settings:
  index.number_of_shards: 3
change to:
#setup.template.settings:
  #index.number_of_shards: 3
In section:
setup.kibana:
change to:
#setup.kibana:
In section:
output.elasticsearch:
  # Array of hosts to connect to.
  hosts: ["localhost:9200"]
change to:
#output.elasticsearch:
  # Array of hosts to connect to.
  #hosts: ["localhost:9200"]
In section:
#output.logstash:
  # The Logstash hosts
  #hosts: ["localhost:5044"]
change to:
output.logstash:
  # The Logstash hosts
  hosts: ["LOGSTASH_IP:5044"]
In section:
#tags: ["service-X", "web-tier"]
change to:
tags: ["packetbeat"]
Start Packetbeat service:
servicectl start packetbeat
Test configuration:
packetbeat test config
packetbeat test output
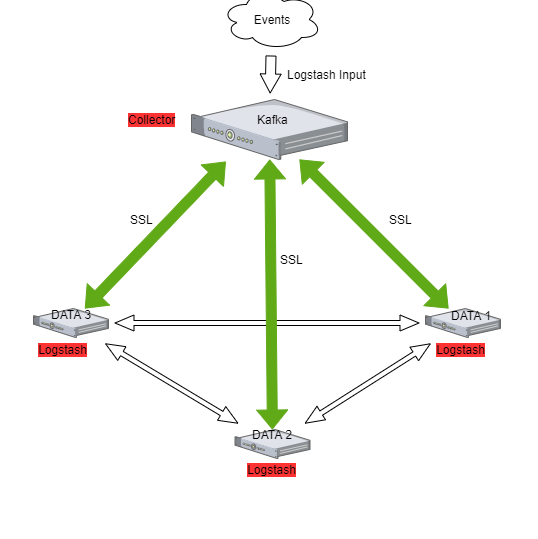
Kafka
Kafka allows you to distribute the load between nodes receiving data and encrypts communication.
Architecture example:
The Kafka installation
To install the Kafka, follow the steps below:
Java installation
yum install java-11-openjdk-headless.x86_64
Create users for Kafka
useradd kafka -m -d /opt/kafka -s /sbin/nologin
Download the installation package::
https://www.apache.org/dyn/closer.cgi?path=/kafka/3.2.0/kafka_2.13-3.2.0.tgzUnpack installation files to
/opt/kafkadirectory:tar -xzvf kafka_2.13-3.2.0.tgz -C /opt/ mv /opt/kafka_2.13-3.2.0 /opt/kafka
Set the necessary permissions
chown -R kafka:kafka /opt/kafka
Edit configs and set the data and log directory:
vim /opt/kafka/config/server.properties
log.dirs=/tmp/kafka-logsSet the necessary firewall rules:
firewall-cmd --permanent --add-port=2181/tcp
firewall-cmd --permanent --add-port=2888/tcp
firewall-cmd --permanent --add-port=3888/tcp
firewall-cmd --permanent --add-port=9092/tcp
firewall-cmd --reload
Create service files:
vim /usr/lib/systemd/system/zookeeper.service[Unit] Requires=network.target remote-fs.target After=network.target remote-fs.target [Service] Type=simple User=kafka ExecStart=/opt/kafka/bin/zookeeper-server-start.sh /opt/kafka/config/zookeeper.properties ExecStop=/opt/kafka/bin/zookeeper-server-stop.sh Restart=on-abnormal [Install] WantedBy=multi-user.target
vim create /usr/lib/systemd/system/kafka.service[Unit] Requires=zookeeper.service After=zookeeper.service [Service] Type=simple User=kafka ExecStart=/bin/sh -c '/opt/kafka/bin/kafka-server-start.sh /opt/kafka/config/server.properties > /opt/kafka/kafka.log 2>&1' ExecStop=/opt/kafka/bin/kafka-server-stop.sh Restart=on-abnormal [Install] WantedBy=multi-user.target
Reload
systemctldaemon and the Kafka services:systemctl daemon-reload systemctl enable zookeeper kafka systemctl start zookeeper kafkaTo test add the Kafka topic:
/opt/kafka/bin/kafka-topics.sh --bootstrap-server localhost:9092 --create --partitions 1 --replication-factor 1 --topic test
List existing topics:
/opt/kafka/bin/kafka-topics.sh --bootstrap-server localhost:9092 --list
Generate test messages
/opt/kafka/bin/kafka-console-producer.sh --topic test --bootstrap-server localhost:9092
   message 1
   message 2
   ...
Read test messages
/opt/kafka/bin/kafka-console-consumer.sh --topic test --from-beginning --bootstrap-server localhost:9092
Kafka encryption
Generate server keystore with certificate pair.
Complete:
- Certificate validity period;
- The name of the alias;
- The FQDN of the server;
- Server IP;
keytool -keystore server.keystore.jks -alias {alias_name} -validity {validity} -genkey -keyalg RSA -ext SAN=DNS:{FQDN},IP:{server_IP}
Creating your own CA
openssl req -new -x509 -keyout rootCA.key -out rootCA.crt -days 365Import CA to server keystore and client keystore:
keytool -keystore server.truststore.jks -alias CARoot -import -file rootCA.crt
keytool -keystore client.truststore.jks -alias CARoot -import -file rootCA.crt
Create a certificate signing request:
Complete:
- The name of the alias;
- The FQDN of the server;
- Server IP;
keytool -keystore server.keystore.jks -alias {alias_name} -certreq -file cert-file -ext SAN=DNS:{FQDN},IP:{server_IP}
Sing in certificate
Complete:
- The name of the alias;
- The FQDN of the server;
- Server IP;
- Password
openssl x509 -req -extfile <(printf"subjectAltName = DNS:{FQDN},IP:{server_IP}") -CA rootCA.crt -CAkey rootCA.key -in cert-file -out cert-signed -days 3650 -CAcreateserial -passin pass:{password}
Import rootCA and cert-signed to server keystore
keytool -keystore server.keystore.jks -alias CARoot -import -file rootCA.crt
keytool -keystore server.keystore.jks -alias els710 -import -file cert-signed
If you have trusted certificates, you must import them into the JKS keystore as follows:
Create a keystore:
Complete:
- Certificate validity period;
- The name of the alias;
- The FQDN of the server;
- Server IP;
keytool -keystore client.keystore.jks -alias {alias_name} -validity {validity} -keyalg RSA -genkey
Combine the certificate and key file into a certificate in p12 format:
Complete:
- your cert name;
- your key name;
- friendly name;
- CA cert file;
openssl pkcs12 -export -in {your_cert_name} -inkey {your_key_name} -out {your_pair_name}.p12 -name {friendly_name} -CAfile ca.crt -caname root
Import the CA certificate into a truststore:
Complete:
- CA cert file;
keytool -keystore client.truststore.jks -alias CARoot -import -file {CAfile}
Import the CA certificate into a keystore:
Complete:
- CA cert file.
keytool -keystore client.keystore.jks -alias CARoot -import -file {CAfile}
Import the p12 certificate into a keystore:
Complete:
- Your p12 pair;
- Keystore password;
keytool -importkeystore -deststorepass {keystore_password} -destkeystore client.keystore.jks -srckeystore {your_pair_name}.p12 -srcstoretype PKCS12
Configuring Kafka Brokers
In
/opt/kafka/server.propertiesfile set the following options:Complete:
- Path to server keystore;
- Keystore password;
- Password for certificate key;
- Path to server truststore;
- Truststore password.
listeners=PLAINTEXT://localhost:9092,SSL://{FQDN}:9093
ssl.keystore.location={path_to_server_keystore}/server.keystore.jks
ssl.keystore.password={keysotre_passowrd}
ssl.key.password={key_password}
ssl.truststore.location={path_to_server_truststore}/server.truststore.jks
ssl.truststore.password={truststore_passowrd}
ssl.enabled.protocols=TLSv1.2
ssl.client.auth=required
security.inter.broker.protocol=SSL
Restart the Kafka service
systemctl restart kafka
Configuring Kafka Clients
Configure the output section in Logstash based on the following example:
Complete:
- Server FQDN;
- Path to client truststore;
- Truststore password.
output {
  kafka {
    bootstrap_servers => "{FQDN}:9093"
    security_protocol => "SSL"
    ssl_truststore_type => "JKS"
    ssl_truststore_location => "{path_to_client_truststore}/client.truststore.jks"
    ssl_truststore_password => "{password_to_client_truststore}"
    client_id => "host.name"
    topic_id => "Topic-1"
    codec => json
  }
}
Configure the input section in Logstash based on the following example:
Complete:
- Server FQDN;
- Path to client truststore;
- Truststore password.
input {
  kafka {
    bootstrap_servers => "{}:port"
    security_protocol => "SSL"
    ssl_truststore_type => "JKS"
    ssl_truststore_location => "{path_to_client_truststore}/client.truststore.jks"
    ssl_truststore_password => "{password_to_client_truststore}"
    consumer_threads => 4
    topics => [ "Topic-1" ]
    codec => json
    tags => ["kafka"]
   }
}
Log retention for Kafka topic
The Kafka durably persists all published records—whether or not they have been consumed—using a configurable retention period. For example, if the retention policy is set to two days, then for the two days after a record is published, it is available for consumption, after which it will be discarded to free up space. Kafka’s performance is effectively constant with respect to data size so storing data for a long time is not a problem.
Event Collector
The Event Collector allows to get events from remote Windows computers and store them in the Energy Logserver indexes. The destination log path for the events is a property of the subscription. The Energy Logserver Event Collector allows to define an event subscription on an Energy Logserver collector without defining the event source computers. Multiple remote event source computers can then be set up (using for example a group policy setting) to forward events to the Energy Logserver. The Event Collector don’t require installation of any additional applications/agents on Windows source hosts.
Configuration steps
Installation of Event Collector
tar zxf wec_7x-master.tar.gz -C /opt/
mkdir /opt/wec
mv /opt/wec_7x-master/ /opt/wec/
mkdir /etc/wec
cp /opt/wec/sub_manager/config.yaml /etc/wec/config.yaml
Generate certificate
mkdir /opt/wec/certgen
cd /opt/wec/certgen
vim server-certopts.cnf
Set
DNS.1andIP.1for WEC server:[req] default_bits = 4096 default_md = sha256 req_extensions = req_ext keyUsage = keyEncipherment,dataEncipherment basicConstraints = CA:FALSE distinguished_name = dn [ req_ext ] subjectAltName = @alt_names extendedKeyUsage = serverAuth,clientAuth [ alt_names ] DNS.1 = wec.local.domain IP.1 = 192.168.13.163 [dn]
Set
DNS.1andIP.1for client certificate:vim client-certopts.cnf
[req]
default_bits = 4096
default_md = sha256
req_extensions = req_ext
keyUsage = keyEncipherment,dataEncipherment
basicConstraints = CA:FALSE
distinguished_name = dn

[ req_ext ]
subjectAltName = @alt_names
extendedKeyUsage = serverAuth,clientAuth

[ alt_names ]
DNS.1 = *local.domain

[dn]
Generate the CA certificate and private key, next check fingerprint:
openssl genrsa -out ca.key 4096
openssl req -x509 -new -nodes -key ca.key -days 3650 -out ca.crt -subj '/CN=wec.local.domain/O=example.com/C=CA/ST=QC/L=Montreal'
openssl x509 -in ca.crt -fingerprint -sha1 -noout | sed -e 's/\://g' > ca.fingerprint
Generate the client certificate and export it together with the CA in PFX format to be imported into the Windows certificate store:
openssl req -new -newkey rsa:4096 -nodes -out server.csr -keyout server.key -subj '/CN=wec.local.domain/O=example.com/C=CA/ST=QC/L=Montreal'
openssl x509 -req -in server.csr -out server.crt -CA ca.crt -CAkey ca.key -CAcreateserial -extfile server-certopts.cnf -extensions req_ext -days 365
Generate the server certificate to be used by the WEC:
openssl req -new -newkey rsa:4096 -nodes -out client.csr -keyout client.key -subj '/CN=wec.local.domain/O=example.com/C=CA/ST=QC/L=Montreal'
openssl x509 -req -in client.csr -out client.crt -CA ca.crt -CAkey ca.key -CAcreateserial -extfile client-certopts.cnf -extensions req_ext -days 365
openssl pkcs12 -export  -inkey client.key -in client.crt -certfile ca.crt -out client.p12
Event Collector Configuration
Copy server certificate and server key to Event Collector installation directory:
cp server.crt server.key /opt/wec/sub_manager/certificates/
Edit configuration file
config.yamlvim /etc/wec/config.yaml
- set the following options:
external_host: wec.local.domain #check ca.fingerprint file ca_fingerprint: 97DDCD6F3AFA511EED5D3312BC50D194A9C9FA9A certificate: /opt/wec/sub_manager/certificates/server.crt key: /opt/wec/sub_manager/certificates/server.key- set the output for Event Collector to Logstash forwarding:
remote_syslog: # forward events to remote syslog server address: 192.168.13.170 port: 5614- set the output to saving events to local file:
outputfile: /var/log/wec/events-{:%Y-%d-%m}.log
- disable local syslog output:
local_syslog: false- set the filter section:
filters:
          # source list

		- source: 'Security'
          filter: '*[System[(Level=1 or Level=2 or Level=3 or Level=4 or Level=0 or Level=5) and (EventID=4672 or EventID=4624 or EventID=4634)]]'

	    - source: 'Application'
          filter: '*[System[(Level=1 or Level=2 or Level=3 or Level=4 or Level=0 or Level=5)]]'

        - source: 'System'
          filter: '*[System[(Level=1 or Level=2 or Level=3 or Level=4 or Level=0 or Level=5)]]'
Install dependencies
Python 3.8 installation:
sudo yum -y update
sudo yum -y groupinstall "Development Tools"
sudo yum -y install openssl-devel bzip2-devel libffi-devel
sudo yum -y install wget
wget https://www.python.org/ftp/python/3.8.3/Python-3.8.3.tgz
tar xvf Python-3.8.3.tgz
cd Python-3.8*/
./configure --enable-optimizations
sudo make altinstall
python3.8 --version
Python requirements installation:
pip3.8 install PyYAML
pip3.8 install sslkeylog
Running Event Collector service
vim /etc/systemd/system/wec.service
[Unit]
Description=WEC Service
After=network.target

[Service]
Type=simple
ExecStart=/usr/local/bin/python3.8 /opt/wec/sub_manager/run.py -c /etc/wec/config.yaml
Restart=on-failure
RestartSec=42s
StandardOutput=syslog
StandardError=syslog
SyslogIdentifier=wecservice

[Install]
WantedBy=multi-user.target
systemctl daemon-reload
systemctl start wc
Windows host configuration
Open the
Microsoft Management Console (mmc.exe), selectFile -> Add/Remove Snap-ins, and add theCertificatessnap-in.Select
Computer Account.Right-click the
Personalnode, and selectAll Tasks > Import.Find and select the client certificate (client.p12) and import this file.
The
PKCS #12archive contains the CA certificate as well.Move the CA certificate to the
Trusted Root Certification Authoritiesnode after the import.Give
NetworkServiceaccess to the private key file of the client authentication certificate:To forward security logs:
- In
CompMgmt.msc, underLocal Users and Groups, clickGroups > Event Log Readersto openEvent Log Readers Properties. - Add the “NETWORK SERVICE” account to the
Event Log Readers group.
8.1. For domain controller use “Group Policy Manger Editor” and edit: “Default Domain Controller Policy”:
- From
Computer Configuration>Policy, expandWindows Settings>Security Settings>Restricted Groups; - From contest menu add:
Add Group - Add the following configuration:
- Group =
BUILTIN\Event Log Readers- Members =
NT Authority\NETWORK SERVICE
- Members =
- Group =
- In
Make sure collector server is reachable from windows machine
Run
winrm qcand accept changes on windows machineRun
winrm set winrm/config/client/auth @{Certificate="true"}on windows machint to enable certificate authenticationOpen
gpedit.mscUnder the
Computer Configuration node, expand theAdministrative Templatesnode, then expand theWindows Componentsnode, and then select theEvent Forwardingnode.Select the SubscriptionManagers setting and enable it. Click the Show button to add a subscription (use the CA thumbprint you saved earlier):
Server=https://<FQDN of the collector>:5986/wsman/SubscriptionManager/WEC,Refresh=<Refresh interval in seconds>,IssuerCA=<Thumbprint of the root CA>
For example:
Server=HTTPS://logserver.diplux.com:5986/wsman/SubscriptionManager/WEC,Refresh=60,IssuerCA=549A72B56560A5CAA392078D9C38B52458616D2
5
NOTE: If you wish to set up multiple subscriptions because you want to forward Windows events to multiple event collectors (such as WEC), then you can do that here.
Run the
cmdconsole with administrative privileges and make following commandgpupdate /force
Logstash pipeline configuration
Create directory for Event Collector pipeline configuration files:
mkdir /etc/logstash/conf.d/syslog_wec
Copy the following Logstash configuration files to pipeline directory:
cp 001-input-wec.conf /etc/logstash/conf.d/syslog_wec/
cp 050-filter-wec.conf /etc/logstash/conf.d/syslog_wec/
cp 060-filter-wec-siem.conf /etc/logstash/conf.d/syslog_wec/
cp 100-output-wec.conf /etc/logstash/conf.d/syslog_wec/
Enabling Logstash pipeline
To enable the syslog_wec Logstash pipeline edit the pipelie.yml file:
vim /etc/logstash/pipeline.yml
Add the following section:
- pipeline.id: syslog_wec
  path.config: "/etc/logstash/conf.d/syslog_wec/*.conf"
And restart Logstash:
systemctl restart logstash
Elasticsearch template
Install the Elasticsearch template for Event Collector data index:
curl -ulogserver:logserver -X PUT "http://localhost:9200/_template/syslog_wec?pretty" -H 'Content-Type: application/json' -d@template_wec.json
Building the subscription filter
Browse to Event Viewer
Right click Subscriptions and create subscription
Click on Select Events and choose the type of logs that you want, for example: Event Level, Event Logs, Include Exclude Event ID, Keyword, etc.
Switch to XML view tab;
Copy the value of the
Select Pathkey, for example:<QueryList> <Query Id="0" Path="Security"> <Select Path="Security">*[System[(Level=1 or Level=2 or Level=3) and (EventID=4672 or EventID=4624 or EventID=4634)]]</Select> </Query> </QueryList>
string to copy:
*[System[(Level=1 or Level=2 or Level=3) and (EventID=4672 or EventID=4624 or EventID=4634)]]
Paste the above definition into the Event Collector configuration file in
filterssection:vim /etc/wec/config.yaml
      filters:
        - source: 'Security'
          filter: '*[System[(Level=1  or Level=2 or Level=3) and (EventID=4672 or EventID=4624 or EventID=4634)]]'
Restart Event Collector service
systemctl restart wec
Cerebro Configuration
Configuration file: /opt/cerebro/conf/application.conf
Authentication
 		auth = {
 		  type: basic
 		    settings: {
 		      username = "logserver"
 		      password = "logserver"
 		    }
 		}
A list of known Elasticsearch hosts
 		hosts = [
 		  {
 		    host = "https://localhost:9200"
 		    name = "energy-logserver"
 		    auth = {
 		      username = "logserver"
 		      password = "logserver"
 		    }
 		  }
 		]

 		play.ws.ssl {
 		  trustManager = {
 		    stores = [
 		      { type = "PEM", path = "/etc/elasticsearch/ssl/rootCA.crt" }
 		    ]
 		  }
 		}
 		play.ws.ssl.loose.acceptAnyCertificate=true
SSL access to cerebro
   http = {
     port = "disabled"
   }
   https = {
     port = "5602"
   }

   # SSL access to cerebro - no self signed certificates
   #play.server.https {
   #  keyStore = {
   #    path = "keystore.jks",
   #    password = "SuperSecretKeystorePassword"
   #  }
   #}

   #play.ws.ssl {
   #  trustManager = {
   #    stores = [
   #      { type = "JKS", path = "truststore.jks", password =       SuperSecretTruststorePassword"  }
   #    ]
   #  }
   #}
service restart
systemctl start cerebro
register backup/snapshot repository for Elasticsearch
   curl -k -XPUT "https://127.0.0.1:9200/_snapshot/backup?pretty" -H 'Content-Type: plication/      json' -d'
   {
     "type": "fs",
     "settings": {
       "location": "/var/lib/elasticsearch/backup/"
     }
   }' -u logserver:logserver
login using curl/kibana
   curl -k -XPOST 'https://192.168.3.11:5602/auth/login' -H 'mimeType: application/      -www-form-urlencoded' -d 'user=logserver&password=logserver' -c cookie.txt
   curl -k -XGET 'https://192.168.3.11:5602' -b cookie.txt
Field level security
You can restrict access to specific fields in documents for a user role. For example: the user can only view specific fields in the Discovery module, other fields will be inaccessible to the user. You can do this by:
- You can do this by adding the index to the
field includesorfield excludesin theCreate Roletab.
- Includes are only fields that will be visible to the user.
- Excludes are fields that the user cannot see.
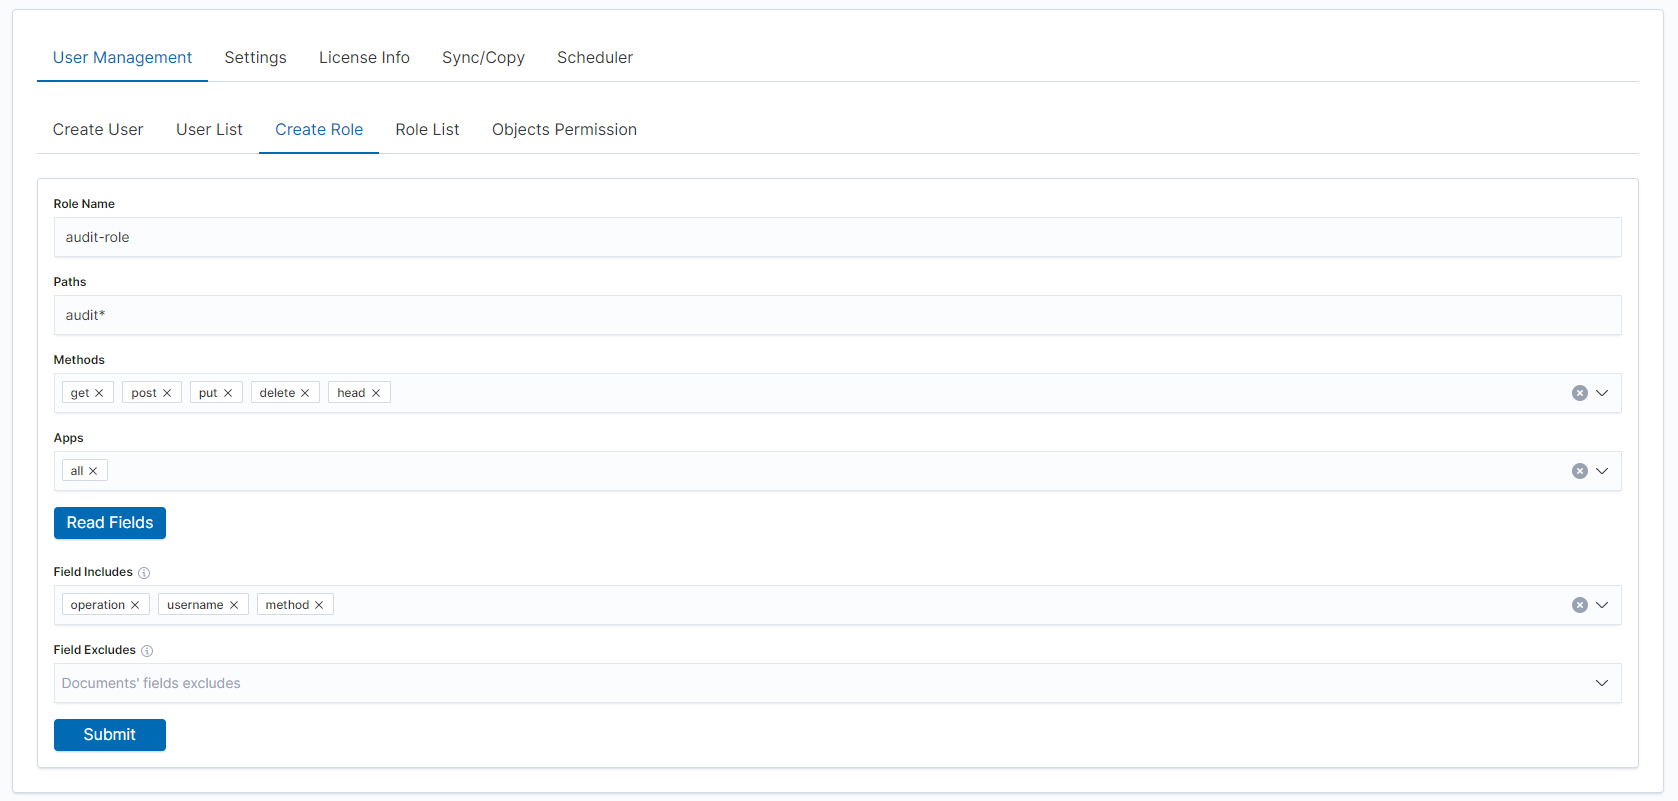
- After that you will see new role in
Role listtab.
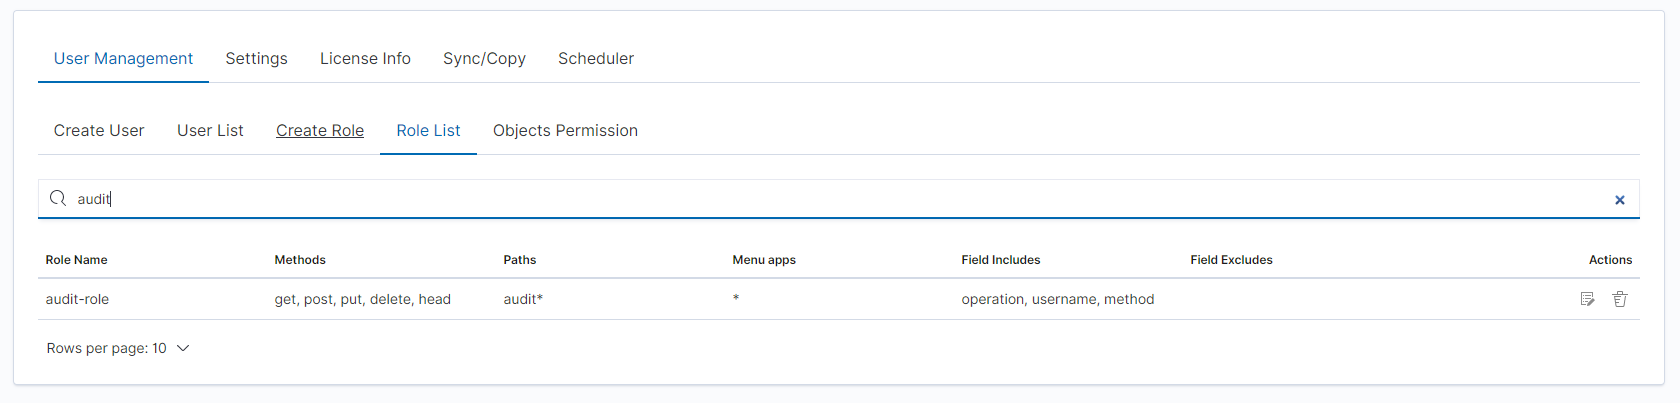
- Add your user to new
Role
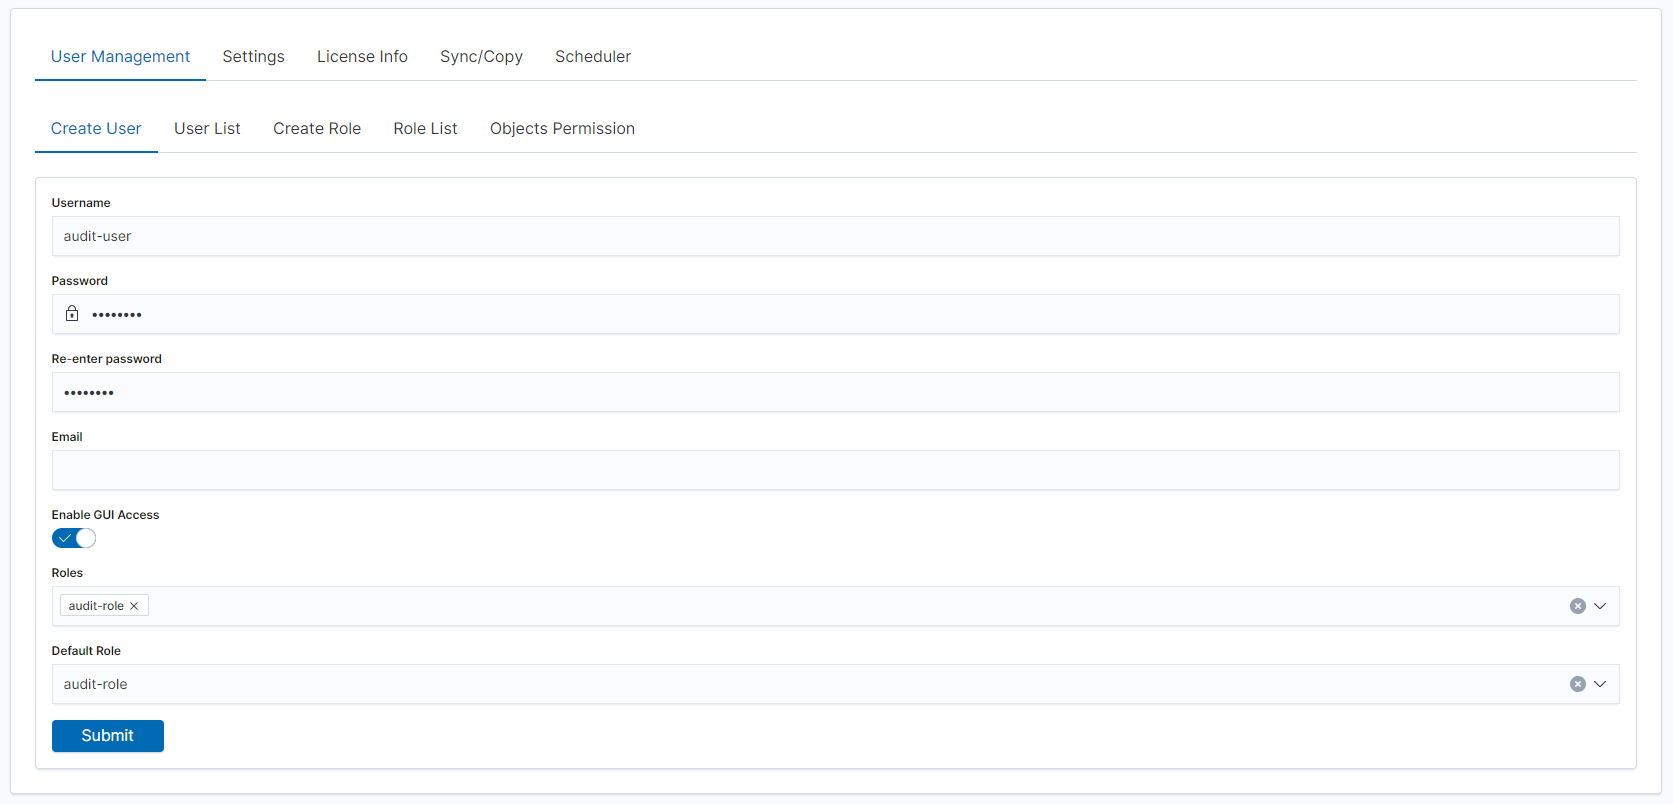
You can now log in as a user with a new role, the user in the Discovery module should only see selected fields.
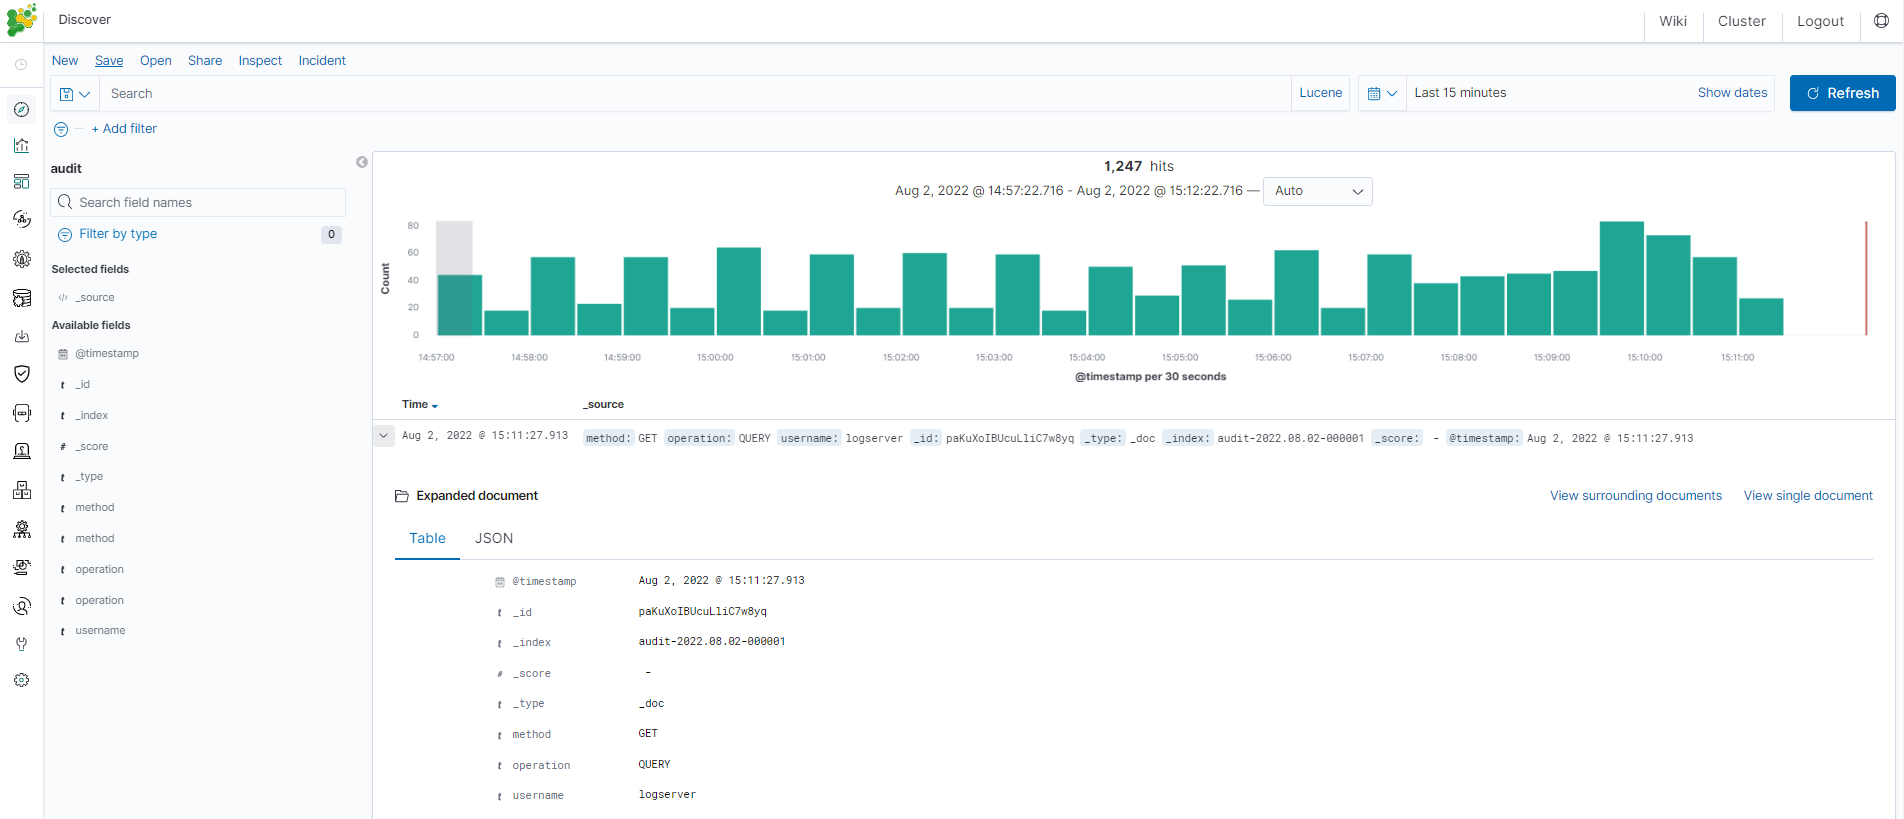
Changing default language for GUI
The GUI language can be changed as follows:
- Add
.i18nrc.jsonto/usr/share/kibana/directory:
{
    "translations": ["translations/ja-JP.json"]
}
- Upload a translation to /usr/share/kibana/translations/ja-JP.json directory
- Set the permission:
# chown -R kibana:kibana /usr/share/kibana/translations/
- Set in
kibana.ymlfile:
i18n.locale: "ja-JP"
- Restart:
# systemctl restart kibana
- Finally the result should be as shown in the picture: