Troubleshooting
Diagnostic tools, common issues, and resolution procedures.
Too many open files
If you have a problem with too many open files by the Energy Logserver process, check the values in the following configuration files:
/usr/lib/systemd/system/logserver.service,LimitNOFILE=262144/etc/security/limits.d/30-logserver.conf,logserver - nofile 262144/etc/sysconfig/logserver,MAX_OPEN_FILES=262144
If you need to increase these values, edit the files and then reload systemd:
systemctl daemon-reload
systemctl restart logserver
The Logserver-GUI status code 500
If the login page is displayed in Logserver-GUI, but after the attempt to login, the browser displays “error: 500”, and the logs will show entries:
Error: Failed to encode cookie (sid-auth) value: Password string too short (min 32 characters required).
Generate a new login.ironsecret with the following command:
echo "login.ironsecret: \"$(</dev/urandom tr -dc _A-Z-a-z-0-9 | head -c32)\"" >> /etc/logserver-gui/logserver-gui.yml
Support tool
Energy Logserver includes a support tool (formerly diagnostic tool) that collects system data necessary for problem analysis by the support team.
The tool is located at: /usr/share/logserver/utils/support-tool.sh (a diagnostic-tool.sh symlink is also available for backward compatibility).
The support tool collects the following information:
Configuration files: Data Node (
/etc/logserver/), GUI (/etc/logserver-gui/), Network Probe (/etc/logserver-probe/conf.d/), Alert (/opt/alert/config.yaml), Cerebro (/opt/cerebro/), Skimmer (/opt/skimmer/skimmer.conf), E-Doc (/opt/e-doc/config.yml), SIEM/Endpoint Security (/var/ossec/etc/)Service logs (via journalctl):
logserver,logserver-gui,logserver-probe,alert,cerebro,skimmer,e-docCluster information: cluster health, cluster settings, indices summary, shard details
Passwords and IP addresses are automatically removed from collected files.
Running the support tool
The tool reads credentials automatically from /etc/logserver-gui/logserver-gui.yml. No command-line arguments are needed:
/usr/share/logserver/utils/support-tool.sh
Warning
If you have changed the default password or protocol, edit the script and update the credentials manually (see the read_config section), or disable read_config and set esUsername, esPass, and protocol variables directly.
The tool saves the results as an AES-256-CBC encrypted archive at /root/diagnostics-logs-<hostname>-<date>.tar.gz.enc.
To decrypt the archive:
openssl enc -aes-256-cbc -md sha512 -base64 -d -in diagnostics-logs-*.tar.gz.enc -out diagnostics-logs.tar.gz
Verification steps and logs
Verification of Energy Logserver service
To verify the Energy Logserver service you can use the following commands:
Control of the Energy Logserver system service via systemd:
systemctl status logserver
output:
* logserver.service - Logserver
   Loaded: loaded (/usr/lib/systemd/system/logserver.service; enabled; vendor preset: disabled)
   Active: active (running) since Tue 2023-11-14 15:17:16 CET; 5 days ago
 Main PID: 58816 (java)
   CGroup: /system.slice/logserver.service
           └─58816 /etc/alternatives/jre/bin/java -Xshare:auto -Dopensearch.networkaddress.cache.ttl=60 -Dopensearch.networkaddress.cache.n.
Control of Logserver instance via tcp port:
curl -XGET '127.0.0.1:9200/'
output:
{
  "name" : "node-1",
  "cluster_name" : "logserver",
  "cluster_uuid" : "B5SDCaaKQU2JdJpsKy6quQ",
  "version" : {
    "distribution" : "opensearch",
    "number" : "3.3.2",
    "build_type" : "tar",
    "build_snapshot" : false
  },
  "tagline" : "The OpenSearch Project: https://opensearch.org/"
}
The version.number field reports the search engine build, 3.3.2 on Energy Logserver 8.0, not the
product version. The response also carries build_hash, build_date, and the Lucene and
compatibility versions, omitted above.
Control of Logserver instance via log file:
tail -f /var/log/logserver/logserver.log
other control commands via curl application:
  curl -XGET "http://localhost:9200/_cat/health?v"
  curl -XGET "http://localhost:9200/_cat/nodes?v"
  curl -XGET "http://localhost:9200/_cat/indices"
Verification of Logserver-Probe service
To verify the Logserver-Probe service you can use the following command:
control Logserver-Probe service via systemd:
systemctl status logserver-probe
output:
    logserver-probe.service - logserver-probe
       Loaded: loaded (/usr/lib/systemd/system/logserver-probe.service; enabled; vendor preset: disabled)
       Active: active (running) since Mon 2025-01-06 09:15:32 CET; 2 months ago
     Main PID: 87818 (java)
       CGroup: /system.slice/logserver-probe.service
              └─87818 /usr/bin/java -Xms1g -Xmx1g
control Logserver-Probe service via port tcp:
curl -XGET '127.0.0.1:9600'
output:
  {
     "host": "logserver-node",
     "version": "7.17.29",
     "http_address": "127.0.0.1:9600"
  }
The
versionfield reports the pipeline engine bundled with the probe, not the Energy Logserver release.control Logserver-Probe service via log file:
tail -f /var/log/logserver-probe/logserver-probe-plain.log
Debugging
dynamically update logging levels through the logging API (service restart not needed):
   curl -XPUT 'localhost:9600/_node/logging?pretty' -H 'Content-Type: application/json' -d'
   {
       "logger.logserver-probe.outputs.logserver" : "DEBUG"
   }
   '
permanent change of logging level (service need to be restarted):
edit file
/etc/logserver-probe/logserver-probe.ymland set the following parameter:log.level: debug
restart logserver-probe service:
systemctl restart logserver-probe
checking correct syntax of configuration files:
/usr/share/logserver-probe/bin/logstash -tf /etc/logserver-probe/conf.d
get information about load of the Logserver-Probe:
curl -XGET '127.0.0.1:9600/_node/jvm?pretty=true'
output:
 {
  "host" : "logserver-node",
  "version" : "7.17.29",
  "http_address" : "127.0.0.1:9600",
  "id" : "5a440edc-1298-4205-a524-68d0d212cd55",
  "name" : "logserver-node",
  "jvm" : {
    "pid" : 14705,
    "version" : "21",
    "vm_version" : "21",
    "vm_vendor" : "Eclipse Adoptium",
    "vm_name" : "OpenJDK 64-Bit Server VM",
    "start_time_in_millis" : 1736150132000,
    "mem" : {
      "heap_init_in_bytes" : 268435456,
      "heap_max_in_bytes" : 1056309248,
      "non_heap_init_in_bytes" : 2555904,
      "non_heap_max_in_bytes" : 0
    },
    "gc_collectors" : [ "G1 Young Generation", "G1 Old Generation" ]
  }
 }
Verification of Energy Logserver GUI service
To verify the Energy Logserver GUI service you can use the following commands:
Control the Energy Logserver GUI service via systemd:
systemctl status logserver-gui
output:
    * logserver-gui.service - Logserver-GUI
       Loaded: loaded (/usr/lib/systemd/system/logserver-gui.service; enabled; vendor preset: disabled)
       Active: active (running) since Mon 2025-01-06 09:16:45 CET; 2 months ago
     Main PID: 1330 (node)
       CGroup: /system.slice/logserver-gui.service
               └─1330 /usr/share/logserver-gui/bin/../node/bin/node --no-warnings /usr/share/logserver-gui/bin/../src/cli -c /etc/logserver-gui/logserver-gui.yml
Control the Energy Logserver GUI via port tcp/http:
curl -XGET '127.0.0.1:5601/'
output:
      <script>var hashRoute = '/app/logserver-gui';
      var defaultRoute = '/app/logserver-gui';
      var hash = window.location.hash;
      if (hash.length) {
        window.location = hashRoute + hash;
      } else {
        window.location = defaultRoute;
      }</script>
Control the Energy Logserver GUI via log file:
journalctl -fu logserver-gui
SIEM Agent - Windows CP1250 decoding problem
If the SIEM Agent works on an operating system which uses a non-Latin-script alphabet, the encoding could cause dropping documents by logserver-probe. In the logserver-probe log you can notice lines like the one below.
[2023-06-01T15:36:02,091][WARN ][logserver-probe.codecs.json ] Received an event that has a different character encoding than you configured. {:text=>"{\\\"timestamp\\\":\\\"2023-06-01T15:36:01.214+0000\\\",\\\"agent\\\":{\\\"id\\\":\\\"002\\\",\\\"name\\\":\\\"win10_laptop\\\"},\\\"manager\\\":{\\\"name\\\":\\\"SiemPlan.local\\\"},\\\"id\\\":\\\"1549035361.0\\\",\\\"full_log\\\":\\\"{\\\\\\\"type\\\\\\\":\\\\\\\"program\\\\\\\",\\\\\\\"ID\\\\\\\":78741874,\\\\\\\"timestamp\\\\\\\":\\\\\\\"2023/06/01 15:36:00\\\\\\\",\\\\\\\"program\\\\\\\":{\\\\\\\"format\\\\\\\":\\\\\\\"win\\\\\\\",\\\\\\\"name\\\\\\\":\\\\\\\"Skype\\x99 7.34\\\\\\\",\\\\\\\"architecture\\\\\\\":\\\\\\\"i686\\\\\\\",\\\\\\\"version\\\\\\\":\\\\\\\"7.34.102\\\\\\\",\\\\\\\"vendor\\\\\\\":\\\\\\\"Skype Technologies S.A.\\\\\\\",\\\\\\\"install_time\\\\\\\":\\\\\\\"20180212\\\\\\\",\\\\\\\"location\\\\\\\":\\\\\\\"C:\\\\\\\\\\\\\\\\Program Files (x86)\\\\\\\\\\\\\\\\Skype\\\\\\\\\\\\\\\\\\\\\\\"}}\\\",\\\"decoder\\\":{\\\"name\\\":\\\"syscollector\\\"},\\\"location\\\":\\\"syscollector\\\"}", :expected_charset=>"UTF-8"}
This is caused by default Windows encoding CP1250. You can change default encoding to UTF-8 by following this steps:
Go to Language settings
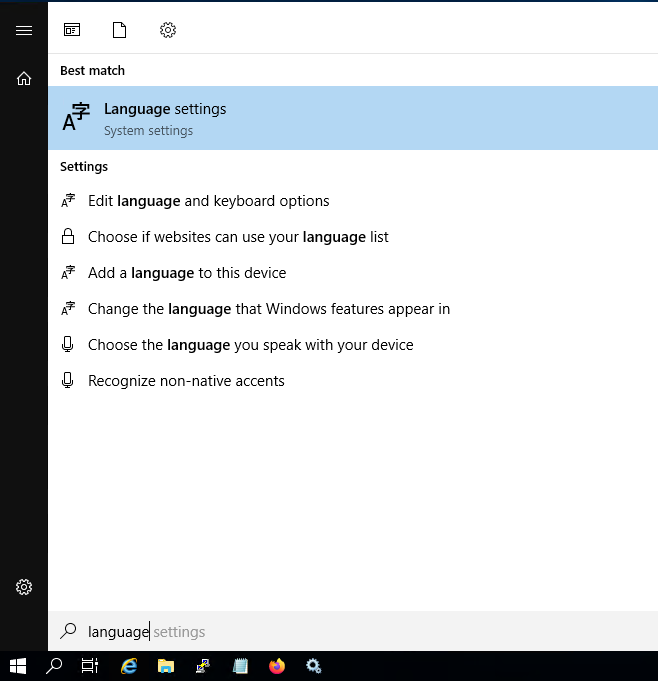
Open Administrative language settings
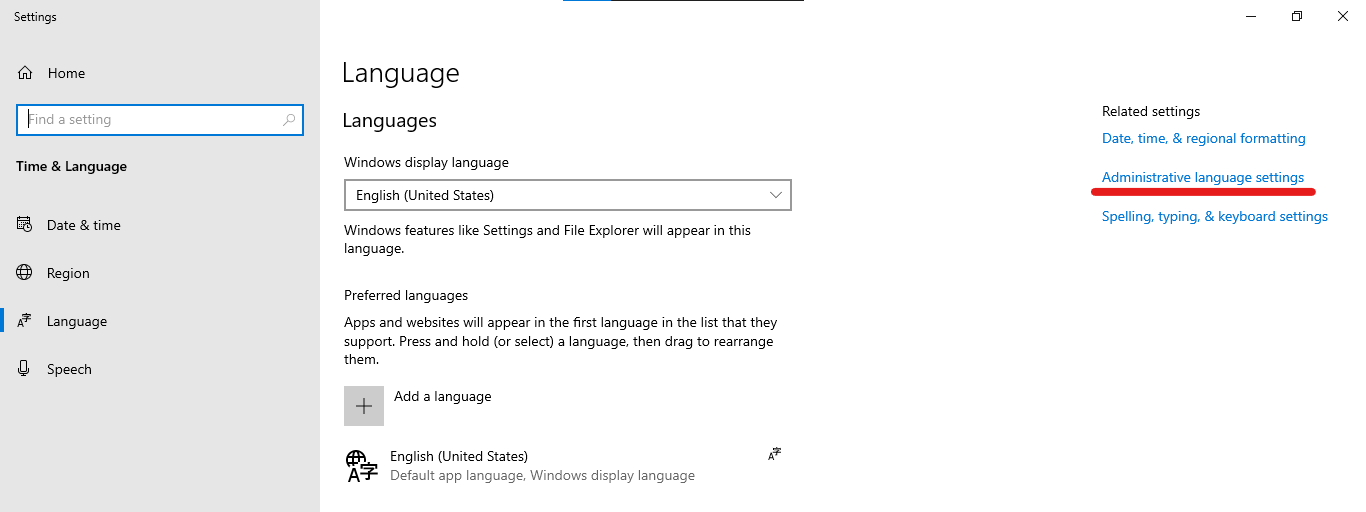
Click on
Change system locale...button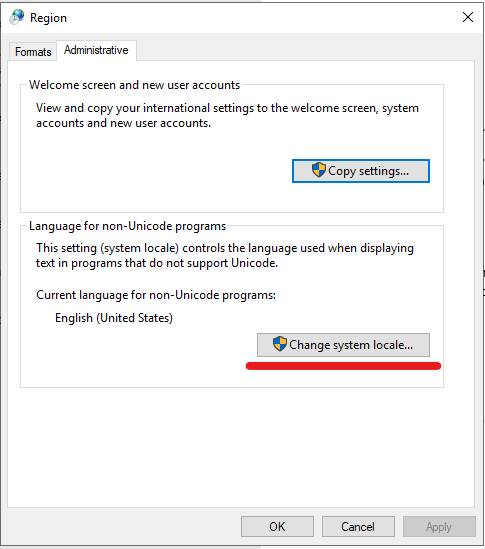
Tick the checkbox
Use Unicode UTF-8..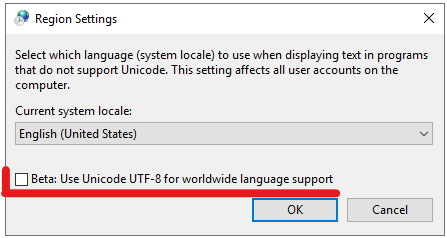
To make this change active you have to reboot system.
My disk is full
The cluster has reached the flood stage watermark and switched to read-only mode. Non-administrative users cannot log in until the issue is resolved. For background on watermark levels see Disk-based shard allocation.
Step 1: free disk space
Remove old indices via Index Management in the GUI, or via the API:
curl -u $USER:$PASSWORD -XDELETE \
  '127.0.0.1:9200/logstash-YYYY.MM.DD?pretty'
To trigger immediate log rotation (/etc/logrotate.d/logtrail, 14-day retention):
logrotate -f /etc/logrotate.d/logtrail
Step 2: unblock indices
When disk usage drops below the high watermark the block releases automatically. To release it immediately without waiting:
curl -u $USER:$PASSWORD -XPUT '127.0.0.1:9200/_all/_settings' \
  -H 'Content-Type: application/json' \
  -d '{"index.blocks.read_only_allow_delete": null}'
Step 3: verify
curl -u $USER:$PASSWORD '127.0.0.1:9200/_cluster/health?pretty'
curl -u $USER:$PASSWORD '127.0.0.1:9200/_cat/nodes?v'
Status should return green or yellow.