SIEM Plan
SIEM Plan provides access to a database of hundreds of predefined correlation rules and sets of ready-made visualizations and dashboards that give a quick overview of the organizations security status. At the same time, the system still provides a great flexibility in building your own correlation rules and visualizations exactly as required by your organization.
System responds to the needs of today’s organizations by allowing identification of threats on the basis of a much larger amount of data, not always related to the security area as it is provided by traditional SIEM systems.
Product contains deep expert knowledge about security posture. Using entire ecosystem of correlation rules, security dashboards with ability to create electronic documentation SIEM PLAN allows You to score the readiness of Your organization to prevent cyber-attacks. Embedded integration with MITRE ATT&CK quickly identifies unmanaged areas where Your organization potentially needs improvements. Security design will be measured and scored . Single screen will show You potential risk and the consequences of an attack hitting any area of the organization.
Use SIEM Plan do prevent loss of reputation, data leakage, phishing or any other cyber-attack and stay safe.
Alert Module
Energy Logserver allows you to create alerts, i.e. monitoring queries. These are constant queries that run in the background and when the conditions specified in the alert are met, the specify action is taken.

For example, if you want to know when more than 20 „status:500” response code from on our homepage appear within an one hour, then we create an alert that check the number of occurrences of the „status:500” query for a specific index every 5 minutes. If the condition we are interested in is met, we send an action in the form of sending a message to our e-mail address. In the action, you can also set the launch of any script.
Enabling the Alert Module
SMTP server configuration
To configuring STMP server for email notification you should:
edit
/opt/alert/config.ymland add the following section:# email conf smtp_host: "mail.example.conf" smtp_port: 587 smtp_ssl: false from_addr: "siem@example.com" smtp_auth_file: "/opt/alert/smtp_auth_file.yml"
add the new
/opt/alert/smtp_auth_file.ymlfile:user: "user" password: "password"
restart
alertservice:systemctl restat alert
Creating Alerts
To create the alert, click the “Alerts” button from the main menu bar.
We will display a page with tree tabs: Create new alerts in „Create alert rule”, manage alerts in „Alert rules List” and check alert status „Alert Status”.
In the alert creation windows we have an alert creation form:
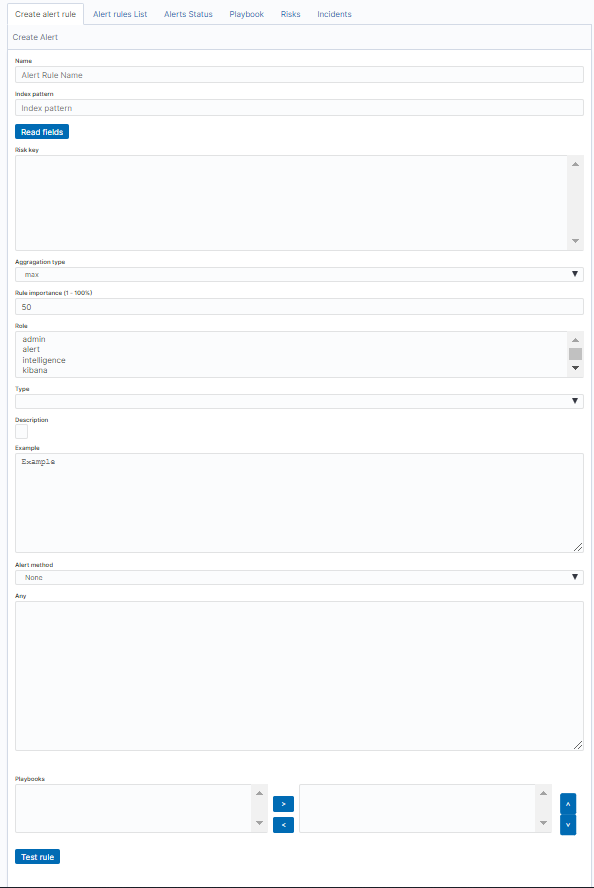
- Name - the name of the alert, after which we will recognize and search for it.
- Index pattern - a pattern of indexes after which the alert will be searched.
- Role - the role of the user for whom an alert will be available
- Type - type of alert
- Description - description of the alert.
- Example - an example of using a given type of alert. Descriptive field
- Alert method - the action the alert will take if the conditions are met (sending an email message or executing a command)
- Any - additional descriptive field.# List of Alert rules #
The “Alert Rule List” tab contain complete list of previously created alert rules:
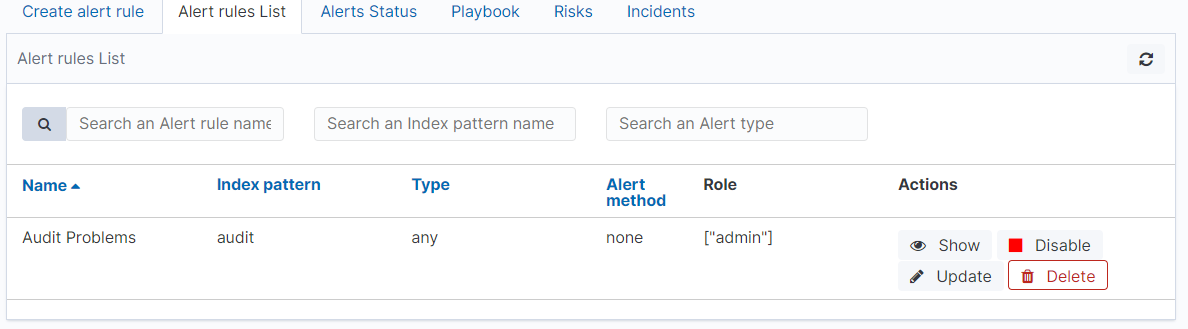
In this window, you can activate / deactivate, delete and update alerts
by clicking on the selected icon with the given alert: 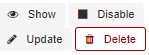 .
.
Alerts status
In the “Alert status” tab, you can check the current alert status: if it activated, when it started and when it ended, how long it lasted, how many event sit found and how many times it worked.
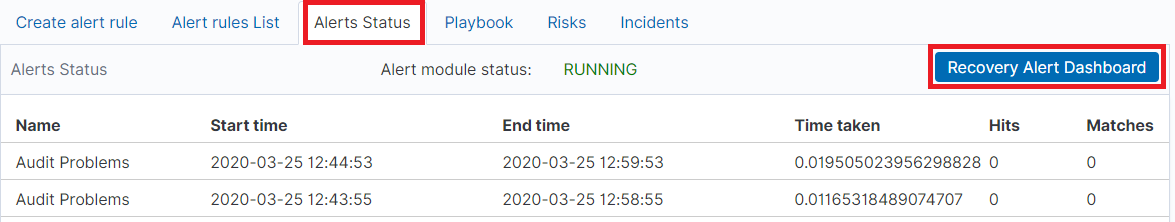
Also, on this tab, you can recover the alert dashboard, by clicking the “Recovery Alert Dashboard” button.
Alert Types
The various Rule Type classes, defined in Energy Logserver. An instance is held in memory for each rule, passed all of the data returned by querying Elasticsearch with a given filter, and generates matches based on that data.
Any
The any rule will match everything. Every hit that the query returns will generate an alert.
Blacklist
The blacklist rule will check a certain field against a blacklist, and match if it is in the blacklist.
Whitelist
Similar to blacklist, this rule will compare a certain field to a whitelist, and match if the list does not contain the term.
Change
This rule will monitor a certain field and match if that field changes.
Frequency
This rule matches when there are at least a certain number of events in a given time frame.
Spike
This rule matches when the volume of events during a given time period is spike_height times larger or smaller than during the previous time period.
Flatline
This rule matches when the total number of events is under a given threshold for a time period.
New Term
This rule matches when a new value appears in a field that has never been seen before.
Cardinality
This rule matches when a the total number of unique values for a certain field within a time frame is higher or lower than a threshold.
Metric Aggregation
This rule matches when the value of a metric within the calculation window is higher or lower than a threshold.
Percentage Match
This rule matches when the percentage of document in the match bucket within a calculation window is higher or lower than a threshold.
Unique Long Term
This rule matches when there are values of compare_key in each checked timeframe.
Find Match
Rule match when in defined period of time, two correlated documents match certain strings.
Consecutive Growth
Rule matches for value difference between two aggregations calculated for different periods in time.
Logical
Rule matches when a complex, logical criteria is met. Rule can be use for alert data correlation.
An example of using the Logical rule type.
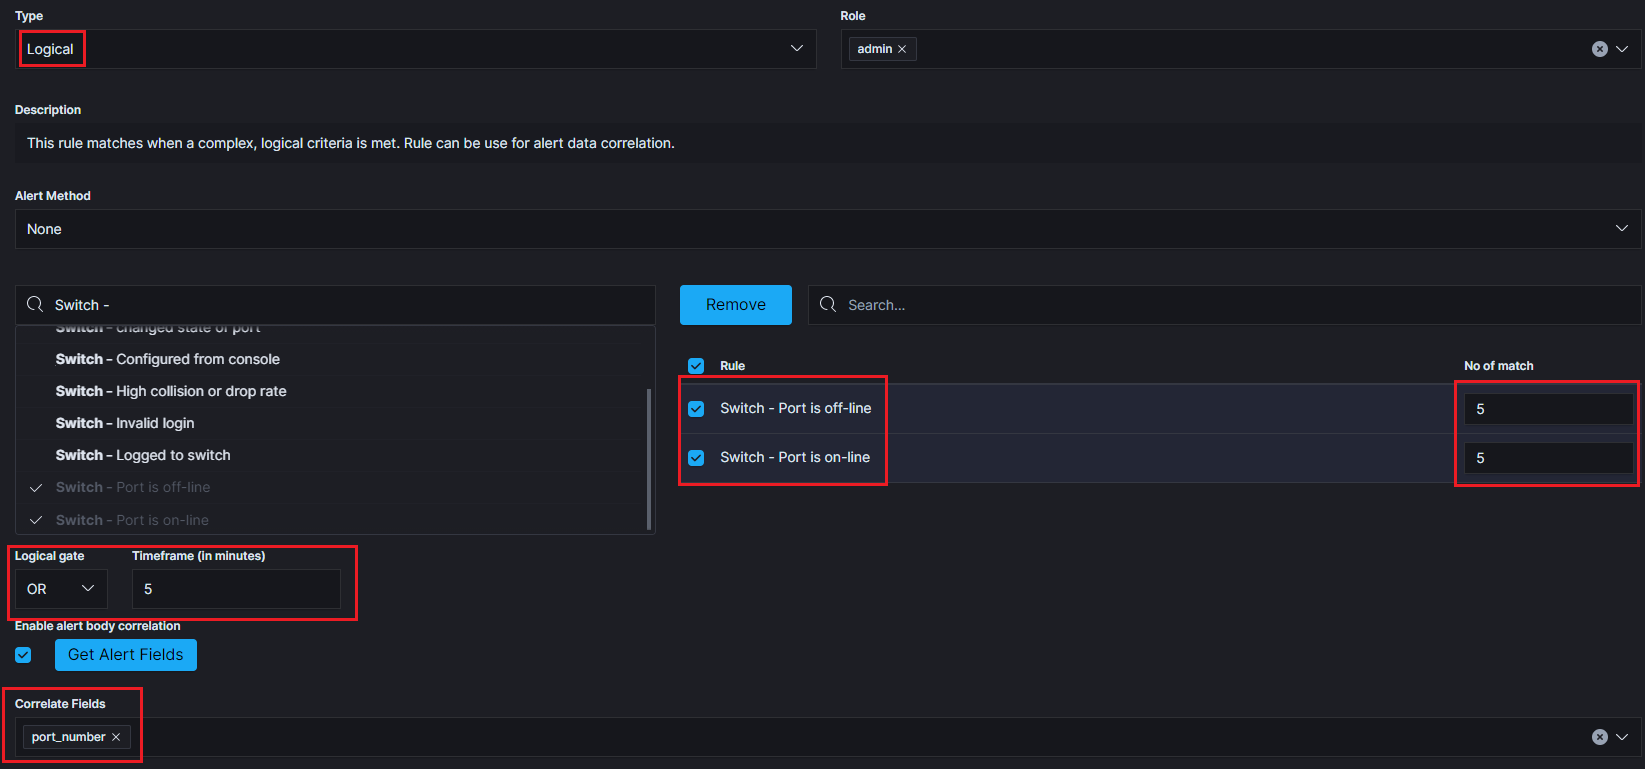
Alerts that must occur for the rule to be triggered:
- Switch - Port is off-line - the alert must appear 5 times.
- OR
- Switch - Port is on-line - the alert must appear 5 times.
If both of the above alerts are met within no more than 5 minutes and the values of the “port_number” field are related to each other, the alert rule is triggered. It is possible to use logical connectives such as: OR, AND, NOR, NAND, XOR.
Chain
Rule matches when a complex, logical criteria is met. Rule can be use for alert data correlation.
An example of using the Chain rule type.
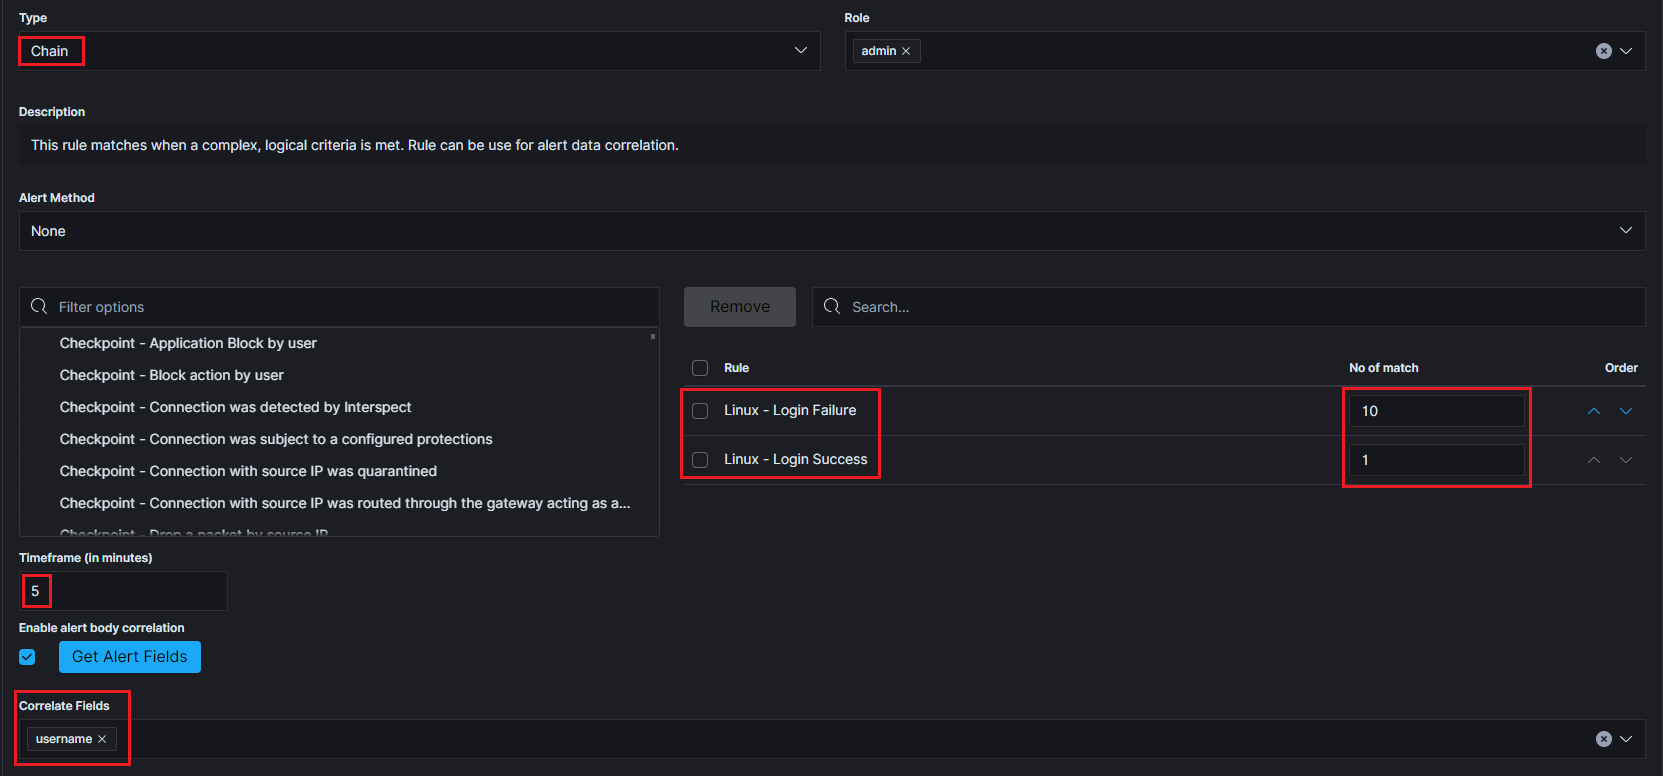
Alerts that must occur for the rule to be triggered:
- Linux - Login Failure - the alert must appear 10 times.
- AND
- Linux - Login Success - 1 time triggered alert.
If the sequence of occurrence of the above alerts is met within 5 minutes and the values of the “username” field are related to each other, the alert rule is triggered. The order in which the component alerts occur is important.
Difference
This rule calculates percentage difference between aggregations for two non-overlapping time windows.
Let’s assume x represents the current time (i.e. when alert rule is run) then the relation between historical and present time windows is described by the inequality:
<x – agg_min – delta_min; x – delta_min> <= <x – agg_min; x>; where x – delta_min <= x – agg_min => delta_min >= agg_min
The percentage difference is then described by the following equation:
d = | avg_now – avg_history | / max(avg_now, avg_history) * 100; for (avg_now – avg_history != 0; avg_now != 0; avg_history != 0)
d = 0; (in other cases)
avg_now is the arithmetic mean of <x – agg_min; x>
avg_history is the arithmetic mean of <x – agg_min – delta_min; x – delta_min>
Required parameters:
- Enable the rule by setting type field.
type: difference - Based on the compare_key field aggregation is calculated.
compare_key: value - An alert is triggered when the percentage difference between aggregations is higher than the specified value.
threshold_pct: 10 - The difference in minutes between calculated aggregations.
delta_min: 3 - Aggregation bucket (in minutes).
agg_min: 1
Optional parameters:
If present, for each unique query_key aggregation is calculated (it needs to be of type keyword).
query_key: hostname
Alert Methods
When the alert rule is fulfilled, the defined action is performed - the alert method. The following alert methods have been predefined in the system:
- email;
- commands;
- user;
Email
Method that sends information about an alert to defined email addresses.
User
Method that sends information about an alert to defined system users.
Command
A method that performs system tasks. For example, it triggers a script that creates a new event in the customer ticket system.
Below is an example of an alert rule definition that uses the “command” alert method to create and recover an ticket in the client’s request system:
index: op5-*
name: change-op5-hoststate
type: change

compare_key: hoststate
ignore_null: true
query_key: hostname

filter:
- query_string:
    query: "_exists_: hoststate AND datatype: \"HOSTPERFDATA\" AND _exists_: hostname"

realert:
  minutes: 0
alert: "command"
command: ["/opt/alert/send_request_change.sh", "5", "%(hostname)s", "SYSTEM_DOWN", "HOST", "Application Collection", "%(hoststate)s", "%(@timestamp)s"]
The executed command has parameters which are the values of the fields of the executed alert. Syntax: %(fields_name).
The Hive
The Hive alerter will create an Incident in theHive. The body of the notification is formatted the same as with other alerters.\
Configuration:
Edit alerter configuration in file
/opt/alert/config.yaml.hive_host:The hostname of theHive server.hive_api:The apikey for connect with theHive. Example usage:
  hive_host: https://127.0.0.1/base
  hive_apikey: APIKEY
Configuration of alert shuld be done in the definition of the Rule, using following options:
Alert type:Type of alert(alert or Case)Follow:If enabled, then if it gets update, its status is set to Updated and the related case is updated too.Title:The title of alert.Description:Description of the alert.Type:The type of the alertSource:The source of the alert.Status:The status of the alert(New,Ignored,Updated,Imported).- `Serverity: The serverity of alert(low,medium,high,critical).
TLP:The Traffic Light Protocol of the alert(white,green,amber,red).Tags:The tags attached to alert.Observable data mapping:The key and the value observable data mapping.Alert text:The text of content the alert.
RSA Archer
The alert module can forward information about the alert to the risk management platfrorm RSA Archer.
The alert rule must be configure to use Command alert method witch execute the following scripts ucf.sh or ucf2.sh
Configuration steps:
Copy and save on the Energy Logserver server the following scripts to appropriate location, for example
/opt/alert/bin:ucf.sh - for SYSLOG
#!/usr/bin/env bash
base_url = "http://localhost/Archer" ##set the appropriate Archer URL

logger -n $base_url -t logger -p daemon.alert -T "CEF:0|LogServer|LogServer|${19}|${18}| TimeStamp=$1 DeviceVendor/Product=$2-$3 Message=$4 TransportProtocol=$5 Aggregated:$6 AttackerAddress=$7 AttackerMAC=$8 AttackerPort=$9 TargetMACAddress=${10} TargetPort=${11} TargetAddress=${12} FlexString1=${13} Link=${14} ${15} $1 ${16} $7 ${17}"
ucf2.sh - for REST API
#!/usr/bin/env bash
base_url = "http://localhost/Archer" ##set the appropriate Archer URL
instance_name = "Archer"
username = "apiuser"
password = "Archer"

curl -k -u $username:$password -H "Content-Type: application/xml" -X POST "$base_url:50105/$instance_name" -d {
"CEF":"0","Server":"LogServer","Version":"${19}","NameEvent":"${18}","TimeStamp":"$1","DeviceVendor/Product":"$2-$3","Message""$4","TransportProtocol":"$5","Aggregated":"$6","AttackerAddress":"$7","AttackerMAC":"$8","AttackerPort":"$9","TargetMACAddress":"${10}","TargetPort":"${11}","TargetAddress":"${12}","FlexString1":"${13}","Link":"${14}","EventID":"${15}","EventTime":"${16}","RawEvent":"${17}"
}
Alert rule definition:
Index Pattern:
alert*Name:
alert-sent-to-rsaRule Type:
anyRule Definition:
filter:
- query:
    query_string:
      query: "_exists_: endTime AND _exists_: deviceVendor AND _exists_: deviceProduct AND _exists_: message AND _exists_: transportProtocol AND _exists_: correlatedEventCount AND _exists_: attackerAddress AND _exists_: attackerMacAddress AND _exists_: attackerPort AND _exists_: targetMacAddress AND _exists_: targetPort AND _exists_: targetAddress AND _exists_: flexString1 AND _exists_: deviceCustomString4 AND _exists_: eventId AND _exists_: applicationProtocol AND _exists_: rawEvent"

include:
- endTime
- deviceVendor
- deviceProduct
- message
- transportProtocol
- correlatedEventCount
- attackerAddress
- attackerMacAddress
- attackerPort
- targetMacAddress
- targetPort
- targetAddress
- flexString1
- deviceCustomString4
- eventId
- applicationProtocol
- rawEvent

realert:
  minutes: 0
Alert Method:
commandPath to script/command:
/opt/alert/bin/ucf.sh
Jira
The Jira alerter will open a ticket on Jira whenever an alert is triggered. Configuration steps:
Create the file which contains Jira account credentials for exmaple
/opt/alert/jira_acct.yaml.user:The username,password:Personal Access Token Example usage:
   user: user.example.com
   password: IjP0vVhgrjkotElFf4ig03g6
Edit alerter configuration file for example
/opt/alert/config.yaml.jira_account_file:Path to Jira configuration file,jira_server:The hostname of the Jira server Example usage:
   jira_account_file: "/opt/alert/jira_acct.yaml"
   jira_server: "https://example.atlassian.net"
The configuration of the Jira Alert should be done in the definition of the Rule Definition alert usin the following options:
Required:
project:The name of the Jira project,issue type:The type of Jira issue
Optional:
Componenets:The name of the component or components to set the ticket to. This can be a single component or a list of components, the same must be declare in Jira.Labels:The name of the label or labels to set the ticket to. This can be a single label or a list of labels the same must be declare in Jira.Watchets:The id of user or list of user id to add as watchers on a Jira ticket. This can be a single id or a list of id’s.Priority:Select priority of issue ( Lowest, Low, Medium, High, Highest).Bump tickets:(true, false) If true, module search for existing tickets newer than “max_age” and comment on the ticket with information about the alert instead of opening another ticket.Bump Only:Only update if a ticket is found to bump. This skips ticket creation for rules where you only want to affect existing tickets.Bump in statuses:The status or a list of statuses the ticket must be in for to comment on the ticket instead of opening a new one.Ignore in title:Will attempt to remove the value for this field from the Jira subject when searching for tickets to bump.Max age:If Bump ticket enabled the maximum age of a ticket, in days, such that module will comment on the ticket instead of opening a new one. Default is 30 days.Bump not in statuses:If Bump ticket enabled the maximum age of a ticket, in days, such that module will comment on the ticket instead of opening a new one. Default is 30 days.Bump after inactivity:If this is set, alert will only comment on tickets that have been inactive for at least this many days. It only applies if jira_bump_tickets is true. Default is 0 days.Transistion to:Transition this ticket to the given status when bumping.
WebHook Connector
The Webhook connector send a POST or PUT request to a web service. You can use WebHooks Connector to send alert to your application or web application when certain events occurrence.
URL:Host of application or web application.Username:Username used to send alert.Password:Password of the username used to send alert.Proxy address:The proxy address.Headers:The headers of the request.Static Payload:The static payload of the request.Payload:The payload of the request.
To enable https add the following variables to the alerter configuration file /opt/alert/config.yaml:
webhook_verify_ssl- enable certificate verification (default: false),webhook_ca- path to CA file that may contain multiple CAs (default: none). Will not be used as long aswebhook_verify_ssl: true,webhook_key- path to the client key file (default: none),webhook_cert- path to the client certificate file (default: none).
Both the certificate and the client key must be provided, otherwise, neither will be used.
Example usage:
 webhook_verify_ssl: true
 webhook_ca: /etc/elasticsearch/ssl/rootCA.crt
 webhook_cert: /etc/elasticsearch/ssl/clientCert.crt
 webhook_key: /etc/elasticsearch/ssl/clientKey.key
Slack
Slack alerter will send a notification to a predefined Slack channel. The body of the notification is formatted the same as with other alerters.
Webhook URL:The webhook URL that includes your auth data and the ID of the channel (room) you want to post to. Go to the Incoming Webhooks section in your Slack account https://XXXXX.slack.com/services/new/incoming-webhook , choose the channel, click ‘Add Incoming Webhooks Integration’ and copy the resulting URL.Username:The username or e-mail address in Slack.Slack channel:The name of the Slack channel. If empty, send on default channel.Message Color:The collot of the message. If empty, the alert will be posted with the ‘danger’ color.Message Title:The title of the Slack message.
ServiceNow
The ServiceNow alerter will create a ne Incident in ServiceNow. The body of the notification is formatted the same as with other alerters. Configuration steps:
Create the file which contains ServiceNow credentials for example
/opt/alert/servicenow_auth_file.yml.servicenow_rest_url:The ServiceNow RestApi url, this will look like TableAPI.username:The ServiceNow username to access the api.password:The ServiceNow user, from username, password.
Example usage:
servicenow_rest_url: https://dev123.service-now.com/api/now/v1/table/incident
username: exampleUser
password: exampleUserPassword
Short Description:The description of the incident.Comments:Comments which will be attach to the indent. This is the equivulant of work notes.Assignment Group:The group to assign the incident to.Category:The category to attach the incident to. !!Use an existing category!!Subcategory:The subcategory to attach the incident to. !!Use an existing subcategoryCMDB CI:The configuration item to attach the incident to.Caller Id:The caller id(email address) of the user thet created the incident.Proxy:Proxy address if needed use proxy.
EnergySoar
The Energy Soar alerter will create a ne Incident in Energy Soar. The body of the notification is formatted the same as with other alerters.\
Configuration:
Edit alerter configuration in file
/opt/alert/config.yaml.hive_host:The hostname of the Energy Soar server.hive_api:The apikey for connect with Energy Soat. Example usage:
  hive_host: https://127.0.0.1/base
  hive_apikey: APIKEY
Configuration of alert shuld be done in the definition of the Rule, using following options:
Alert type:Type of alert(alert or Case)Follow:If enabled, then if it gets update, its status is set to Updated and the related case is updated too.Title:The title of alert.Description:Description of the alert.Type:The type of the alertSource:The source of the alert.Status:The status of the alert(New,Ignored,Updated,Imported).- `Serverity: The serverity of alert(low,medium,high,critical).
TLP:The Traffic Light Protocol of the alert(white,green,amber,red).Tags:The tags attached to alert.Observable data mapping:The key and the value observable data mapping.Alert text:The text of content the alert.
Escalate
The escalate_users function allows you to assign notifications to a specific user or group of users whereas the escalate_after funcion escalates the recipient of the notification after a set period of time.
In order to use the escalate_users functionality, you should add to rule configuration two additional keys.
Example:
escalate_users: ["user1", "user2"]
escalate_after:
  days: 2
Following this example user1 and user2 will be alerted with escalation two days after the initial alarm.
Recovery
The recovery function allows you to declare an additional action that will be performed after the termination of the conditions which triggering the initial alarm.
recovery: true
recovery_command: "command"
In addition recovery came with functionality of pulling field values from rules. The %{@timestamp_recovery} pulls the value from the match while ${name} pulls the value from the rule. The @timestamp_recovery variable is a special variable that contains the time recovery executinon.
In order to use the recovery functionality, you should add directives to your alarm definition, for example:
recovery: true
recovery_command: "echo \"%{@timestamp_recovery};;${name}_${ci};${alert_severity};RECOVERY;${ci};${alert_group};${alert_subgroup};${summary};${additional_info_1};${additional_info_2};${additional_info_3};\" >>/opt/elasticsearch/em_integration/events.log"
It is possible to close the incident in the external system using a parameter added to the alert rule.
  #Recovery definition:
  recovery: true
  recovery_command: "mail -s 'Recovery Alert for rule RULE_NAME' user@example.com < /dev/null"
Aggregation
aggregation: This option allows you to aggregate multiple matches together into one alert. Every time a match is found, Alert will wait for the aggregation period, and send all of the matches that have occurred in that time for a particular rule together.
For example:
aggregation:
  hours: 2
Means that if one match occurred at 12:00, another at 1:00, and a third at 2:30, one alert would be sent at 2:00, containing the first two matches, and another at 4:30, containing the third match plus any additional matches occurring before 4:30. This can be very useful if you expect a large number of matches and only want a periodic report. (Optional, time, default none)
If you wish to aggregate all your alerts and send them on a recurring interval, you can do that using the schedule field. For example, if you wish to receive alerts every Monday and Friday:
aggregation:
  schedule: '2 4 * * mon,fri'
This uses Cron syntax, which you can read more about here. Make sure to only include either a schedule field or standard datetime fields (such as hours, minutes, days), not both.
By default, all events that occur during an aggregation window are grouped together. However, if your rule has the aggregation_key field set, then each event sharing a common key value will be grouped together. A separate aggregation window will be made for each newly encountered key value. For example, if you wish to receive alerts that are grouped by the userwho triggered the event, you can set:
aggregation_key: 'my_data.username'
Then, assuming an aggregation window of 10 minutes, if you receive the following data points:
{'my_data': {'username': 'alice', 'event_type': 'login'}, '@timestamp': '2016-09-20T00:00:00'}
{'my_data': {'username': 'bob', 'event_type': 'something'}, '@timestamp': '2016-09-20T00:05:00'}
{'my_data': {'username': 'alice', 'event_type': 'something else'}, '@timestamp': '2016-09-20T00:06:00'}
This should result in 2 alerts: One containing alice’s two events, sent at 2016-09-20T00:10:00 and one containing bob’s one event sent at 2016-09-20T00:16:00.
For aggregations, there can sometimes be a large number of documents present in the viewing medium (email, Jira, etc..). If you set the summary_table_fields field, Alert will provide a summary of the specified fields from all the results.
The formatting style of the summary table can be switched between ascii (default) and markdown with parameter summary_table_type. Markdown might be the more suitable formatting for alerters supporting it like TheHive or Energy Soar.
The maximum number of rows in the summary table can be limited with the parameter summary_table_max_rows.
For example, if you wish to summarize the usernames and event_types that appear in the documents so that you can see the most relevant fields at a quick glance, you can set:
summary_table_fields:
    - my_data.username
    - my_data.event_type
Then, for the same sample data shown above listing alice and bob’s events, Alert will provide the following summary table in the alert medium:
+------------------+--------------------+
| my_data.username | my_data.event_type |
+------------------+--------------------+
|      alice       |       login        |
|       bob        |     something      |
|      alice       |   something else   |
+------------------+--------------------+
!! NOTE !!
By default, aggregation time is relative to the current system time, not the time of the match. This means that running Alert over past events will result in different alerts than if Alert had been running while those events occured. This behavior can be changed by setting `aggregate_by_match_time`.
Alert Content
There are several ways to format the body text of the various types of events. In EBNF::
    rule_name           = name
    alert_text          = alert_text
    ruletype_text       = Depends on type
    top_counts_header   = top_count_key, ":"
    top_counts_value    = Value, ": ", Count
    top_counts          = top_counts_header, LF, top_counts_value
    field_values        = Field, ": ", Value
Similarly to alert_subject, alert_text can be further formatted using standard Python formatting syntax.
The field names whose values will be used as the arguments can be passed with alert_text_args or alert_text_kw.
You may also refer to any top-level rule property in the alert_subject_args, alert_text_args, alert_missing_value, and alert_text_kw fields. However, if the matched document has a key with the same name, that will take preference over the rule property.
By default:
    body                = rule_name

                          [alert_text]

                          ruletype_text

                          {top_counts}

                          {field_values}
With alert_text_type: alert_text_only:
    body                = rule_name

                          alert_text
With alert_text_type: exclude_fields:
    body                = rule_name

                          [alert_text]

                          ruletype_text

                          {top_counts}
With alert_text_type: aggregation_summary_only:
    body                = rule_name

                          aggregation_summary
ruletype_text is the string returned by RuleType.get_match_str.
field_values will contain every key value pair included in the results from Elasticsearch. These fields include “@timestamp” (or the value of timestamp_field),
every key in include, every key in top_count_keys, query_key, and compare_key. If the alert spans multiple events, these values may
come from an individual event, usually the one which triggers the alert.
When using alert_text_args, you can access nested fields and index into arrays. For example, if your match was {"data": {"ips": ["127.0.0.1", "12.34.56.78"]}}, then by using "data.ips[1]" in alert_text_args, it would replace value with "12.34.56.78". This can go arbitrarily deep into fields and will still work on keys that contain dots themselves.
Example of rules
Unix - Authentication Fail
- index pattern:
syslog-*
- Type:
Frequency
- Alert Method:
Email
- Any:
    num_events: 4
    timeframe:
      minutes: 5

    filter:
    - query_string:
        query: "program: (ssh OR sshd OR su OR sudo) AND message: \"Failed password\""
Windows - Firewall disable or modify
- index pattern:
beats-*
- Type:
Any
- Alert Method:
Email
- Any:
filter:

    - query_string:
        query: "event_id:(4947 OR 4948 OR 4946 OR 4949 OR 4954 OR 4956 OR 5025)"
Playbooks
Energy Logserver has a set of predefined set of rules and activities (called Playbook) that can be attached to a registered event in the Alert module. Playbooks can be enriched with scripts that can be launched together with Playbook.
Create Playbook
To add a new playbook, go to the Alert module, select the Playbook tab and then Create Playbook
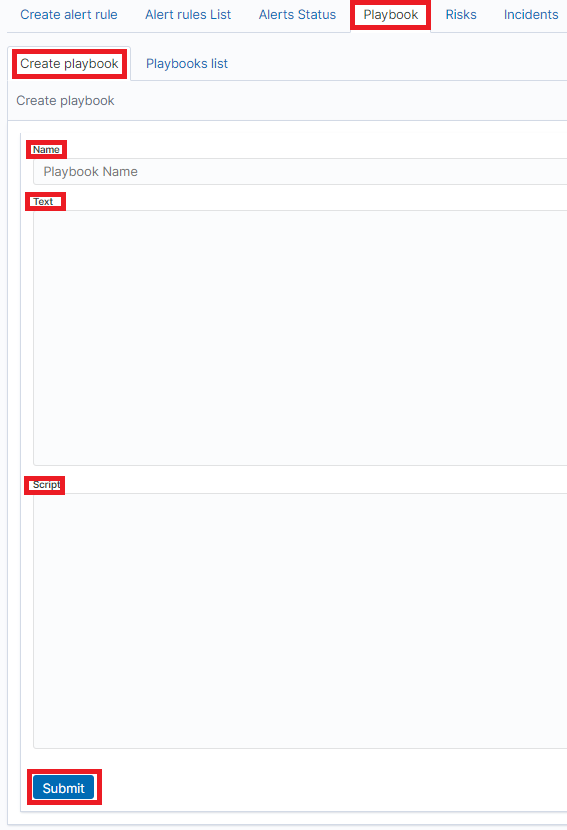
In the Name field, enter the name of the new Playbook.
In the Text field, enter the content of the Playbook message.
In the Script field, enter the commands to be executed in the script.
To save the entered content, confirm with the Submit button.
Playbooks list
To view saved Playbook, go to the Alert module, select the Playbook tab and then Playbooks list:
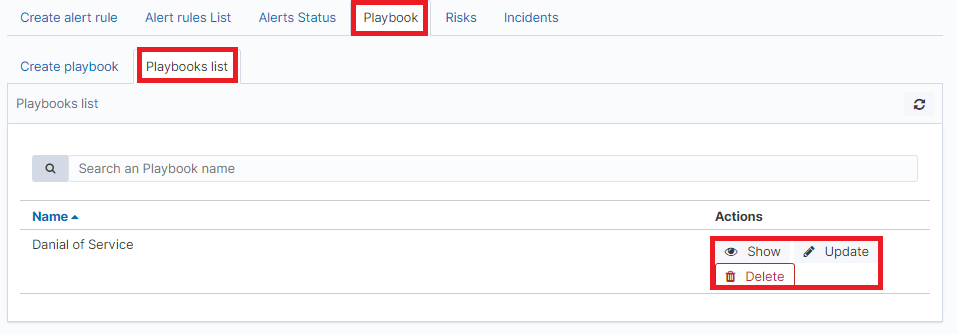
To view the content of a given Playbook, select the Show button.
To enter the changes in a given Playbook or in its script, select the Update button. After making changes, select the Submit button.
To delete the selected Playbook, select the Delete button.
Linking Playbooks with alert rule
You can add a Playbook to the Alert while creating a new Alert or by editing a previously created Alert.
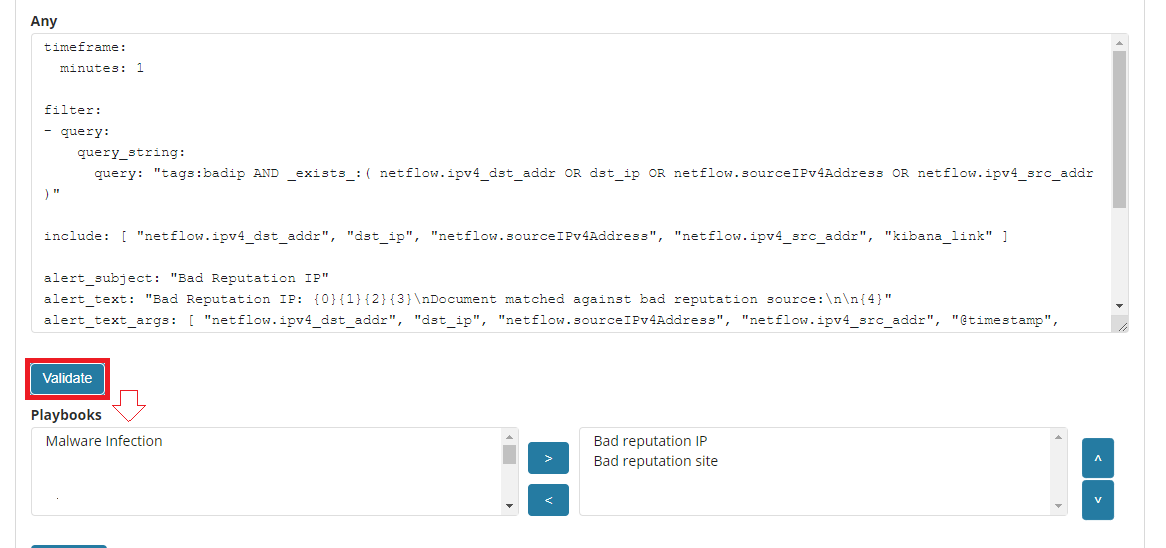
To add Palybook to the new Alert rule, go to the Create alert rule tab and in the Playbooks section use the arrow keys to move the correct Playbook to the right window.
To add a Palybook to existing Alert rule, go to the Alert rule list tab with the correct rule select the Update button and in the Playbooks section use the arrow keys to move the correct Playbook to the right window.
Playbook verification
When creating an alert or while editing an existing alert, it is possible that the system will indicate the most-suited playbook for the alert. For this purpose, the Validate button is used, which starts the process of searching the existing playbook and selects the most appropriate ones.
Risks
Energy Logserver allows you to estimate the risk based on the collected data. The risk is estimated based on the defined category to which the values from 0 to 100 are assigned.
Information on the defined risk for a given field is passed with an alert and multiplied by the value of the Rule Importance parameter.
Risk calculation does not use only logs for its work. Processing the security posture encounters all the information like user behaviour data, performance data, system inventory, running software, vulnerabilities and many more. Having large scope of information Your organization gather an easy way to score its security project and detect all missing spots of the design. Embedded deep expert knowledge is here to help.
Create category
To add a new risk Category, go to the Alert module, select the Risks tab and then Create Cagtegory.
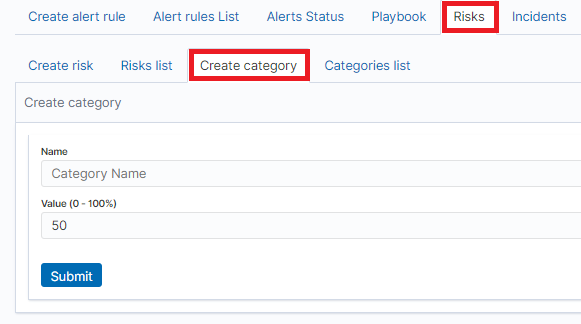
Enter the Name for the new category and the category Value.
Category list
To view saved Category, go to the Alert module, select the Risks tab and then Categories list:
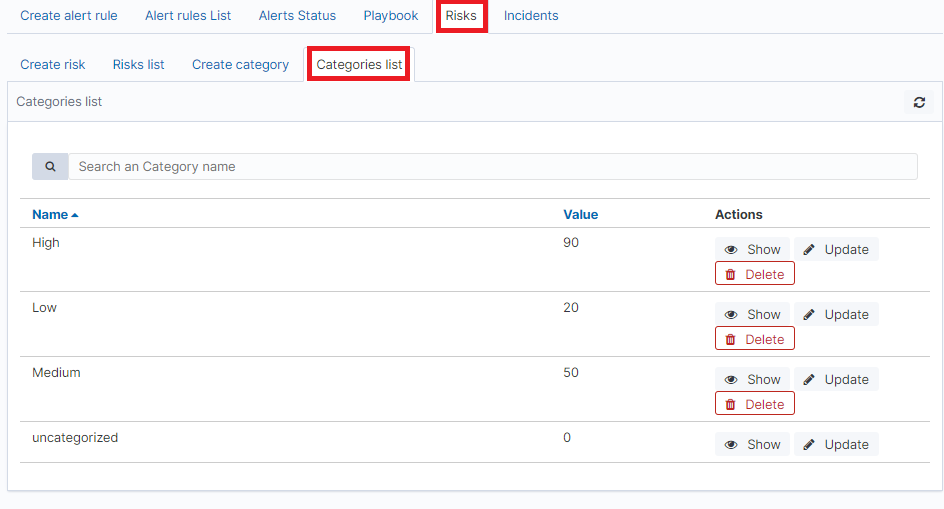
To view the content of a given Category, select the Show button.
To change the value assigned to a category, select the Update button. After making changes, select the Submit button.
To delete the selected Category, select the Delete button.
Create risk
To add a new playbook, go to the Alert module, select the Playbook tab and then Create Playbook
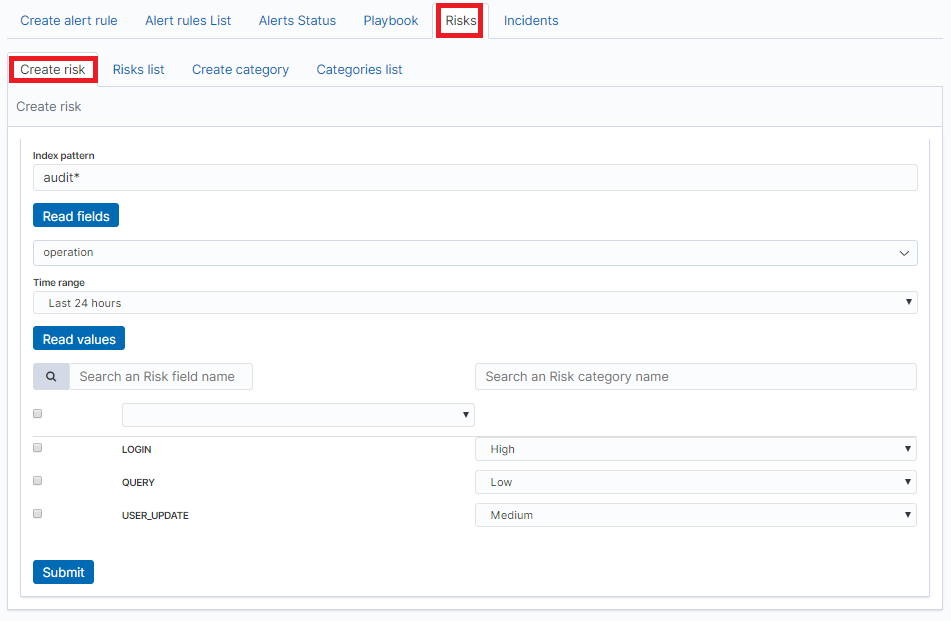
In the Index pattern field, enter the name of the index pattern. Select the Read fields button to get a list of fields from the index. From the box below, select the field name for which the risk will be determined.
From the Timerange field, select the time range from which the data will be analyzed.
Press the Read valules button to get values from the previously selected field for analysis.
Next, you must assign a risk category to the displayed values. You can do this for each value individually or use the check-box on the left to mark several values and set the category globally using the Set global category button. To quickly find the right value, you can use the search field.
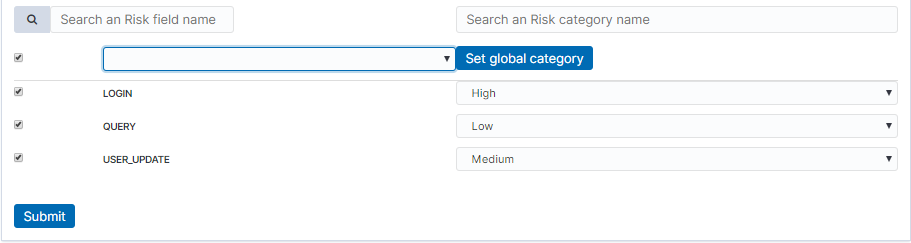
After completing, save the changes with the Submit button.
List risk
To view saved risks, go to the Alert module, select the Risks tab and then Risks list:
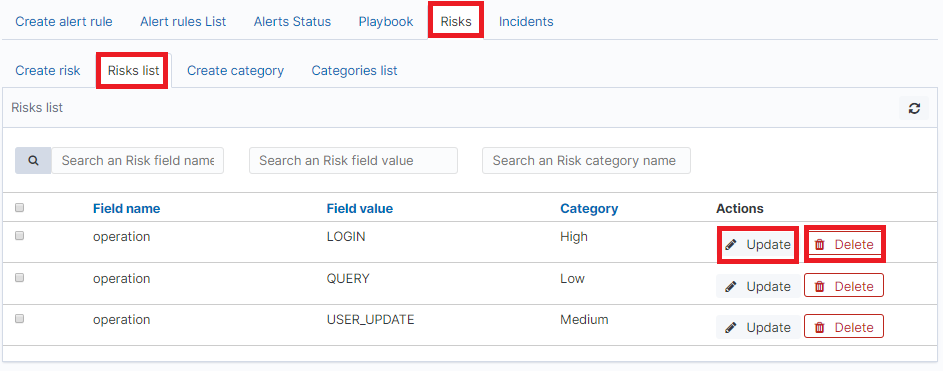
To view the content of a given Risk, select the Show button.
To enter the changes in a given Risk, select the Update button. After making changes, select the Submit button.
To delete the selected Risk, select the Delete button.
Linking risk with alert rule
You can add a Risk key to the Alert while creating a new Alert or by editing a previously created Alert.
To add Risk key to the new Alert rule, go to the Create alert rule tab and after entering the index name, select the Read fields button and in the Risk key field, select the appropriate field name. In addition, you can enter the validity of the rule in the Rule Importance field (in the range 1-100%), by which the risk will be multiplied.
To add Risk key to the existing Alert rule, go to the Alert rule list, tab with the correct rule select the Update button. Use the Read fields button and in the Risk key field, select the appropriate field name. In addition, you can enter the validity of the rule in the Rule Importance.
Risk calculation algorithms
The risk calculation mechanism performs the aggregation of the risk field values. We have the following algorithms for calculating the alert risk (Aggregation type):
- min - returns the minimum value of the risk values from selected fields;
- max - returns the maximum value of the risk values from selected fields;
- avg - returns the average of risk values from selected fields;
- sum - returns the sum of risk values from selected fields;
- custom - returns the risk value based on your own algorithm
Adding a new risk calculation algorithm
The new algorithm should be added in the ./elastalert_modules/playbook_util.py file in the calculate_risk method. There is a sequence of conditional statements for already defined algorithms:
#aggregate values by risk_key_aggregation for rule
  if risk_key_aggregation == "MIN":
    value_agg = min(values)
  elif risk_key_aggregation == "MAX":
    value_agg = max(values)
  elif risk_key_aggregation == "SUM":
    value_agg = sum(values)
  elif risk_key_aggregation == "AVG":
    value_agg = sum(values)/len(values)
  else:
    value_agg = max(values)
To add a new algorithm, add a new sequence as shown in the above code:
  elif risk_key_aggregation == "AVG":
    value_agg = sum(values)/len(values)
  elif risk_key_aggregation == "AAA":
    value_agg = BBB
  else:
    value_agg = max(values)
where AAA is the algorithm code, BBB is a risk calculation function.
Using the new algorithm
After adding a new algorithm, it is available in the GUI in the Alert tab.
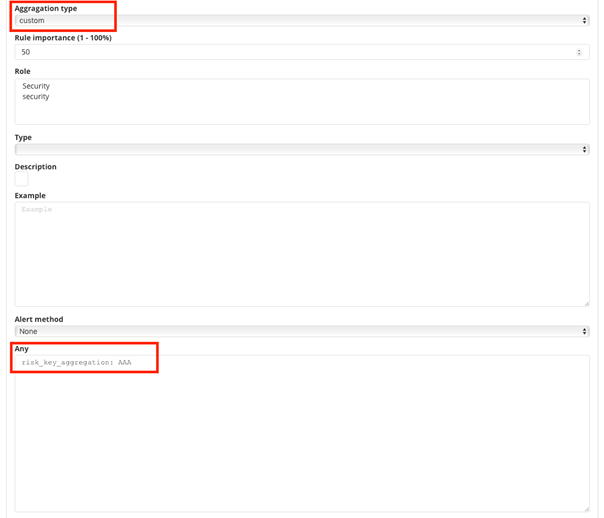
To use it, add a new rule according to the following steps:
- Select the
customvalue in theAggregationtype field; - Enter the appropriate value in the
Anyfield, e.g.risk_key_aggregation: AAA
The following figure shows the places where you can call your own algorithm:
Additional modification of the algorithm (weight)
Below is the code in the calcuate_risk method where category values are retrieved - here you can add your weight:
            #start loop by tablicy risk_key
            for k in range(len(risk_keys)):
                risk_key = risk_keys[k]
                logging.info(' >>>>>>>>>>>>>> risk_key: ')
                logging.info(risk_key)
                key_value = lookup_es_key(match, risk_key)
                logging.info(' >>>>>>>>>>>>>> key_value: ')
                logging.info(key_value)
                value = float(self.get_risk_category_value(risk_key, key_value))
                values.append( value )
                logging.info(' >>>>>>>>>>>>>> risk_key values: ')
                logging.info(values)
            #finish loop by tablicy risk_key
            #aggregate values by risk_key_aggregation form rule
            if risk_key_aggregation == "MIN":
                value_agg = min(values)
            elif risk_key_aggregation == "MAX":
                value_agg = max(values)
            elif risk_key_aggregation == "SUM":
                value_agg = sum(values)
            elif risk_key_aggregation == "AVG":
                value_agg = sum(values)/len(values)
            else:
                value_agg = max(values)
Risk_key is the array of selected risk key fields in the GUI.
A loop is made on this array and a value is collected for the categories in the line:
value = float(self.get_risk_category_value(risk_key, key_value))
Based on, for example, Risk_key, you can multiply the value of the value field by the appropriate weight. The value field value is then added to the table on which the risk calculation algorithms are executed.
Incidents
SIEM correlation engine allows automatically scores organization security posture showing You what tactic the attacked use and how this puts organization at risk. Every attack can be traced on dashboard reflecting Your security design identifying missing enforcements.
Incidents on the operation of the organization through appropriate points for caught incidents. Hazard situations are presented, using the so-called Mitre ATT / CK matrix. The Energy Logserver system, in addition to native integration with MITER, allows this knowledge to be correlated with other collected data and logs, creating even more complex techniques of behavior detection and analysis. Advanced approach allows for efficient analysis of security design estimation.
The Incident module allows you to handle incidents created by triggered alert rules.
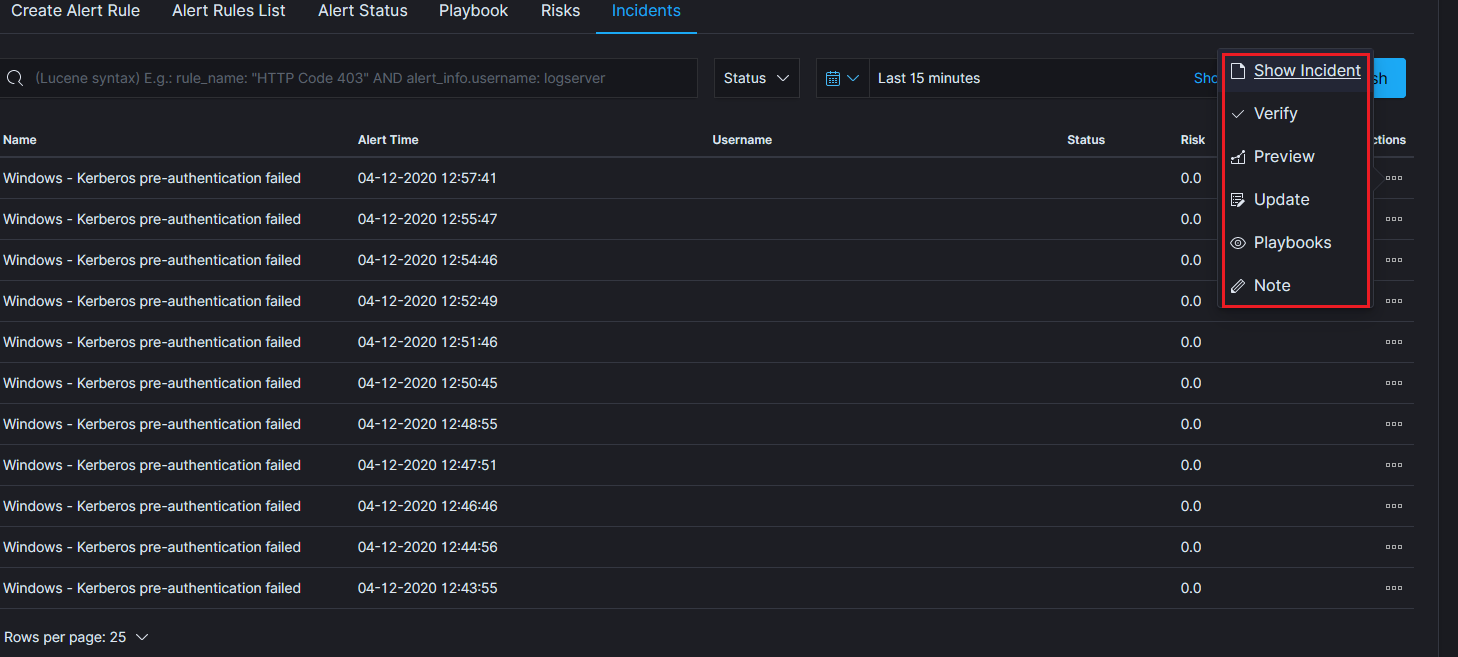
Incident handling allows you to perform the following action:
- Show incident - shows the details that generated the incident;
- Verify - checks the IP addresses of those responsible for causing an incident with the system reputation lists;
- Preview - takes you to the Discover module and to the raw document responsible for generating the incident;
- Update - allows you to change the Incident status or transfer the incident handling to another user. Status list: New, Ongoing, False, Solved.
- Playbooks - enables handling of Playbooks assigned to an incident;
- Note - User notes about the incident;
Incident Escalation
The alarm rule definition allows an incident to be escalated if the incident status does not change (from New to Ongoing) after a defined time.
Configuration parameter
- escalate_users - an array of users who get an email alert about the escalation;
- escalate_after - the time after which the escalation is triggered;
Example of configuration:
escalate_users:["user2", "user3"]
escalate_after:
  - hours: 6
Context menu for Alerts::Incidents
In this section, you will find steps and examples that will allow you to add custom items in the actions context menu for the Incidents table. This allows you to expand on the functionalities of the system.
Important file paths
/usr/share/kibana/plugins/alerts/public/reactui/incidenttab.js/usr/share/kibana/optimize/bundles/
List element template
{
  name: 'Name of the Action to add',
  icon: 'Name of the chosen icon',
  type: 'icon',
  onClick: this.runActionFunction,
}
You should pick the icon from available choices. After listing ls /usr/share/kibana/built_assets/dlls/icon* if you want to use:
icon.editor_align_center-js.bundle.dll.jsThe foricon:you should set:editorAlignCenterUse the same transformation for each icon.
Action function template
runActionFunction = item => {
  // Functino logic to run => information from "item" object can be used here
};
Object “item” contains information about the incident that action was used on.
Steps to add the first custom action to the codebase
Create backup of a file you are about to modify:
cp /usr/share/kibana/plugins/alerts/public/reactui/incidenttab.js ~/incidenttab.js.bak
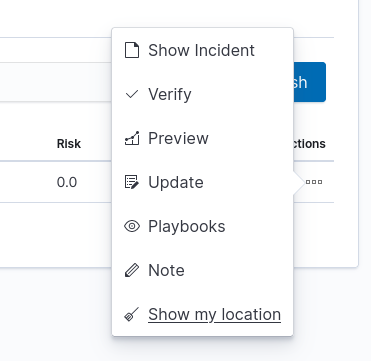
Working example for the onClick function and action item:
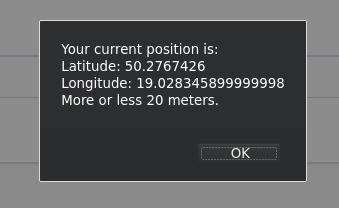
showMyLocation = () => {
  const opt = {
    enableHighAccuracy: true,
    timeout: 5000,
    maximumAge: 0
  };
  const success = pos => {
    const crd = pos.coords;
    alert(`Your current position is:\nLatitude: ${
      crd.latitude
    }\nLongitude: ${
      crd.longitude
    }\nMore or less ${
      crd.accuracy
    } meters.`);
  }
  const err = err => {
    alert(`ERROR(${err.code}): ${err.message}`);
  }
  navigator.geolocation.getCurrentPosition(success, err, opt);
}

const customActions = [
  {
    name: 'Show my location',
    icon: 'broom',
    type: 'icon',
    onClick: this.showMyLocation,
  }
];
incidentactions.push(...customActions);
The “showMyLocation” function code should be placed in
/usr/share/kibana/plugins/alerts/public/reactui/incidenttab.jsunder:showIncidentModal = incident => { const updateIncident = incident; this.setState({ showIncidentModal: true, updateIncident }); }; // paste function here render() {
Custom action with a
pushfunction should be placed:{ name: 'Note', icon: 'pencil', type: 'icon', isPrimary: true, color: 'danger', onClick: this.note, }, ]; // insert HERE your action with function 'push' const incidentcolumns = [
For the changes to take effect run below commands on the client serwer (as root or with sudo):
systemctl stop kibana
rm -rf /usr/share/kibana/optimize/bundles
systemctl start kibana
# verify that process runs correctly afterwards
journalctl -fu kibana
# in case of errors restore backup
You should now be able to see an additional item in the action context menu in GUI Alerts::Incidents:
Running the action will resolve into an alert:
Steps to add a second and subsequent custom actions
Execute identicly as in the last section.
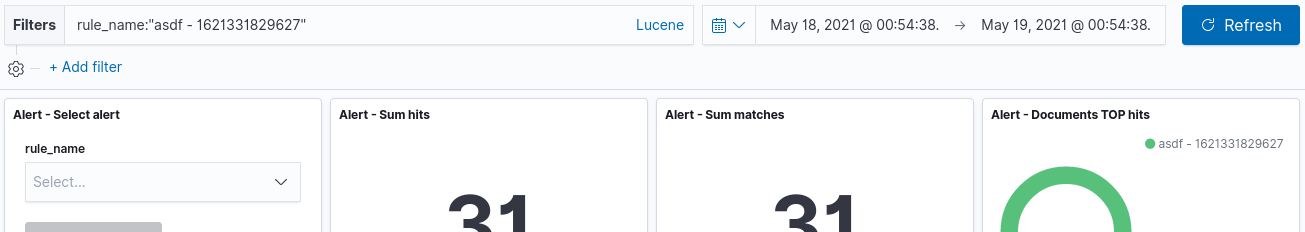
Example of a function that uses
itemobject. It will open a new tab in the browser with the default [Alert] dashboard with a custom filter and time set, based on information from the passeditemvariable:openAlertDashboardWithFilter = item => { const ruleName = `"${item.rule_name}"`; const startT = new Date(item.match_time); startT.setHours(0); const endT = new Date(item.match_time); endT.setHours(24); const alertDashboardPath = '/app/kibana#/dashboard/777ace50-d200-11e8-98f8-31520a7f9701'; const timeQuery = `_g=(time:(from:'${startT.toISOString()}',to:'${endT.toISOString()}'))`; const nameQuery = `_a=(query:(language:lucene,query:'rule_name:${encodeURIComponent( ruleName )}'))`; const dashboardLocation = `${alertDashboardPath}?${timeQuery}&${nameQuery}`; window.open(dashboardLocation, '_blank'); };
Execute identicly as in the last section.
The difference in adding subsequent action is that you append a new one to
customActionsarray variable. The rest should stay the same:const customActions = [ { name: 'Show my location', icon: 'broom', type: 'icon', onClick: this.showMyLocation, }, { name: 'Show on Dashboard', icon: 'arrowRight', type: 'icon', onClick: this.openAlertDashboardWithFilter, }, ]; incidentactions.push(...customActions);
Execute identicly as in the last section.
Now both actions should be present on the context menu:
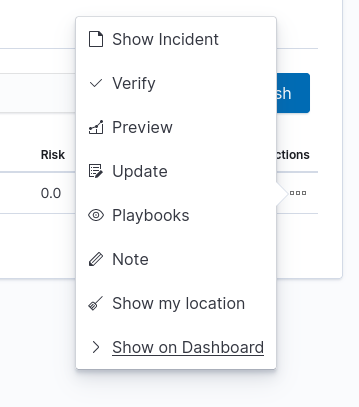
Using it will open dashboard in new tab:
System update
When updating the system your changes might be overwritten. You should in that case save a backup of your changes and restore them after the update with the use of this instruction. Or for instance, with vimdiff compare your changes with the original file:
vimdiff ~/incidenttab.js.bak /usr/share/kibana/plugins/alerts/public/reactui/incidenttab.js
Indicators of compromise (IoC)
Energy Logserver has the Indicators of compromise (IoC) functionality, which is based on the Malware Information Sharing Platform (MISP). IoC observes the logs sent to the system and marks documents if their content is in MISP signature. Based on IoC markings, you can build alert rules or track incident behavior.
Configuration
Bad IP list update
To update bad reputation lists and to create .blacklists index, you have to run following scripts:
/etc/logstash/lists/bin/misp_threat_lists.sh
Scheduling bad IP lists update
This can be done in cron (host with Logstash installed):
0 6 * * * logstash /etc/logstash/lists/bin/misp_threat_lists.sh
or with Kibana Scheduller app (only if Logstash is running on the same host).
- Prepare script path:
/bin/ln -sfn /etc/logstash/lists/bin /opt/ai/bin/lists
chown logstash:kibana /etc/logstash/lists/
chmod g+w /etc/logstash/lists/
- Log in to Energy Logserver GUI and go to Scheduler app. Set it up with below options and push “Submit” button:
Name:           MispThreatList
Cron pattern:   0 1 * * *
Command:        lists/misp_threat_lists.sh
Category:       logstash
After a couple of minutes check for blacklists index:
curl -sS -u user:password -XGET '127.0.0.1:9200/_cat/indices/.blacklists?s=index&v'
health status index       uuid                   pri rep docs.count docs.deleted store.size pri.store.size
green  open   .blacklists Mld2Qe2bSRuk2VyKm-KoGg   1   0      76549            0      4.7mb          4.7mb
Calendar function
The alert rule can be executed based on a schedule called Calendar.
Create a calendar
The configuration of the Calendar Function should be done in the definition of the Rule Definition alert using the calendar and scheduler options, in Crontab format.
For example, we want to have an alert that:
- triggers only on working days from 8:00 to 16:00;
- only triggers on weekends;
calendar:
  schedule: "* 8-15 * * mon-fri"
If aggregation is used in the alert definition, remember that the aggregation schedule should be the same as the defined calendar.
Windows Events ID repository
+--------------------+-------------------------------+----------+----------------------------------------+------------------+-----------+------------------------------------------------------------------------------+---------------------------+
| Category | Subcategory | Event ID | Dashboard | Type | Event Log | Describe | Event ID for Windows 2003 |
+--------------------+-------------------------------+----------+----------------------------------------+------------------+-----------+------------------------------------------------------------------------------+---------------------------+
| Object | Access | 561 | AD DNS Changes | Success | Security | Handle Allocated |
+--------------------+-------------------------------+----------+----------------------------------------+------------------+-----------+------------------------------------------------------------------------------+---------------------------+
| System | Security State Change | 4608 | [AD] Event Statistics | Success | Security | Windows is starting up | 512 |
+--------------------+-------------------------------+----------+----------------------------------------+------------------+-----------+------------------------------------------------------------------------------+---------------------------+
| System | Security System Extension | 4610 | [AD] Event Statistics | Success | Security | An authentication package has been loaded by the Local Security Authority | 514 |
+--------------------+-------------------------------+----------+----------------------------------------+------------------+-----------+------------------------------------------------------------------------------+---------------------------+
| System | System Integrity | 4612 | [AD] Event Statistics | Success | Security | Internal resources allocated for the queuing of audit | 516 |
| | | | | | | messages have been exhausted, leading to the loss of some audits | |
+--------------------+-------------------------------+----------+----------------------------------------+------------------+-----------+------------------------------------------------------------------------------+---------------------------+
| System | System Integrity | 4615 | [AD] Event Statistics | Success | Security | Invalid use of LPC port | 519 |
+--------------------+-------------------------------+----------+----------------------------------------+------------------+-----------+------------------------------------------------------------------------------+---------------------------+
| System | Security State Change | 4616 | [AD] Servers Audit | Success | Security | The system time was changed. | 520 |
+--------------------+-------------------------------+----------+----------------------------------------+------------------+-----------+------------------------------------------------------------------------------+---------------------------+
| Logon/Logoff | Logon | 4624 | [AD] Total Logins -> AD Login Events | Success | Security | An account was successfully logged on | 528 , 540 |
+--------------------+-------------------------------+----------+----------------------------------------+------------------+-----------+------------------------------------------------------------------------------+---------------------------+
| Logon/Logoff | Logon | 4625 | [AD] Inventory, [AD] Failed Logins -> | Failure | Security | An account failed to log on | 529, 530, 531, 532, 533, |
| | | | AD Failed Login Events | | | | 534, 535, 536, 537, 539 |
+--------------------+-------------------------------+----------+----------------------------------------+------------------+-----------+------------------------------------------------------------------------------+---------------------------+
| Object Access | File System, Registry, SAM, | 4656 | [AD] Removable Device Auditing | Success, Failure | Security | A handle to an object was requested | 560 |
| | Handle Manipulation, | | | | | | |
| | Other Object Access Events | | | | | | |
+--------------------+-------------------------------+----------+----------------------------------------+------------------+-----------+------------------------------------------------------------------------------+---------------------------+
| Object Access | File System, Registry, | 4663 | [AD] Removable Device Auditing | Success | Security | An attempt was made to access an object | 567 |
| | Kernel Object, SAM, | | | | | | |
| | Other Object Access Events | | | | | | |
+--------------------+-------------------------------+----------+----------------------------------------+------------------+-----------+------------------------------------------------------------------------------+---------------------------+
| Object Access | File System, Registry, | 4670 | [AD] GPO Objects Overview | Success | Security | Permissions on an object were changed |
| | Policy Change, | | | | | |
| | Authorization Policy Change | | | | | |
+--------------------+-------------------------------+----------+----------------------------------------+------------------+-----------+------------------------------------------------------------------------------+---------------------------+
| Account Management | User Account Management | 4720 | [AD] Accounts Overview -> | Success | Security | A user account was created | 624 |
| | | | [AD] A user account was created | | | | |
+--------------------+-------------------------------+----------+----------------------------------------+------------------+-----------+------------------------------------------------------------------------------+---------------------------+
| Account Management | User Account Management | 4722 | [AD] Accounts Overview -> | Success | Security | A user account was enabled | 626 |
| | | | [AD] A user account was disabled | | | | |
+--------------------+-------------------------------+----------+----------------------------------------+------------------+-----------+------------------------------------------------------------------------------+---------------------------+
| Account Management | User Account Management | 4723 | [AD] Accounts Overview -> | Success | Security | An attempt was made to change an account's password | 627 |
| | | | [AD] An attempt was made | | | | |
| | | | to change an account's password | | | | |
+--------------------+-------------------------------+----------+----------------------------------------+------------------+-----------+------------------------------------------------------------------------------+---------------------------+
| Account Management | User Account Management | 4724 | [AD] Accounts Overview -> | Success | Security | An attempt was made to reset an accounts password | 628 |
| | | | [AD] An attempt was made | | | | |
| | | | to change an account's password | | | | |
+--------------------+-------------------------------+----------+----------------------------------------+------------------+-----------+------------------------------------------------------------------------------+---------------------------+
| Account Management | User Account Management | 4725 | [AD] Accounts Overview -> | Success | Security | A user account was disabled | 629 |
| | | | [AD] A user account was disabled | | | | |
+--------------------+-------------------------------+----------+----------------------------------------+------------------+-----------+------------------------------------------------------------------------------+---------------------------+
| Account Management | User Account Management | 4726 | [AD] Accounts Overview -> | Success | Security | A user account was deleted | 630 |
| | | | [AD] A user account was deleted | | | | |
+--------------------+-------------------------------+----------+----------------------------------------+------------------+-----------+------------------------------------------------------------------------------+---------------------------+
| Account Management | Security Group Management | 4727 | [AD] Security Group Change History | Success | Security | A security-enabled global group was created | 631 |
+--------------------+-------------------------------+----------+----------------------------------------+------------------+-----------+------------------------------------------------------------------------------+---------------------------+
| Account Management | Security Group Management | 4728 | [AD] Organizational Unit | Success | Security | A member was added to a security-enabled global group | 632 |
+--------------------+-------------------------------+----------+----------------------------------------+------------------+-----------+------------------------------------------------------------------------------+---------------------------+
| Account Management | Security Group Management | 4729 | [AD] Organizational Unit | Success | Security | A member was removed from a security-enabled global group | 633 |
+--------------------+-------------------------------+----------+----------------------------------------+------------------+-----------+------------------------------------------------------------------------------+---------------------------+
| Account Management | Security Group Management | 4730 | [AD] Organizational Unit | Success | Security | A security-enabled global group was deleted | 634 |
+--------------------+-------------------------------+----------+----------------------------------------+------------------+-----------+------------------------------------------------------------------------------+---------------------------+
| Account Management | Security Group Management | 4731 | [AD] Organizational Unit | Success | Security | A security-enabled local group was created | 635 |
+--------------------+-------------------------------+----------+----------------------------------------+------------------+-----------+------------------------------------------------------------------------------+---------------------------+
| Account Management | Security Group Management | 4732 | [AD] Organizational Unit | Success | Security | A member was added to a security-enabled local group | 636 |
+--------------------+-------------------------------+----------+----------------------------------------+------------------+-----------+------------------------------------------------------------------------------+---------------------------+
| Account Management | Security Group Management | 4733 | [AD] Organizational Unit | Success | Security | A member was removed from a security-enabled local group | 637 |
+--------------------+-------------------------------+----------+----------------------------------------+------------------+-----------+------------------------------------------------------------------------------+---------------------------+
| Account Management | Security Group Management | 4734 | [AD] Organizational Unit | Success | Security | A security-enabled local group was deleted | 638 |
+--------------------+-------------------------------+----------+----------------------------------------+------------------+-----------+------------------------------------------------------------------------------+---------------------------+
| Account Management | User Account Management | 4738 | [AD] Accounts Overview | Success | Security | A user account was changed | 642 |
+--------------------+-------------------------------+----------+----------------------------------------+------------------+-----------+------------------------------------------------------------------------------+---------------------------+
| Account Management | User Account Management | 4740 | [AD] Accounts Overview -> | Success | Security | A user account was locked out | 644 |
| | | | AD Account - Account Locked | | | | |
+--------------------+-------------------------------+----------+----------------------------------------+------------------+-----------+------------------------------------------------------------------------------+---------------------------+
| Account Management | Computer Account Management | 4741 | [AD] Computer Account Overview | Success | Security | A computer account was created | 645 |
+--------------------+-------------------------------+----------+----------------------------------------+------------------+-----------+------------------------------------------------------------------------------+---------------------------+
| Account Management | Computer Account Management | 4742 | [AD] Computer Account Overview | Success | Security | A computer account was changed | 646 |
+--------------------+-------------------------------+----------+----------------------------------------+------------------+-----------+------------------------------------------------------------------------------+---------------------------+
| Account Management | Computer Account Management | 4743 | [AD] Computer Account Overview | Success | Security | A computer account was deleted | 647 |
+--------------------+-------------------------------+----------+----------------------------------------+------------------+-----------+------------------------------------------------------------------------------+---------------------------+
| Account Management | Distribution Group Management | 4744 | [AD] Organizational Unit | Success | Security | A security-disabled local group was created | 648 |
+--------------------+-------------------------------+----------+----------------------------------------+------------------+-----------+------------------------------------------------------------------------------+---------------------------+
| Account Management | Distribution Group Management | 4746 | [AD] Security Group Change History | Success | Security | A member was added to a security-disabled local group | 650 |
+--------------------+-------------------------------+----------+----------------------------------------+------------------+-----------+------------------------------------------------------------------------------+---------------------------+
| Account Management | Distribution Group Management | 4747 | [AD] Security Group Change History | Success | Security | A member was removed from a security-disabled local group | 651 |
+--------------------+-------------------------------+----------+----------------------------------------+------------------+-----------+------------------------------------------------------------------------------+---------------------------+
| Account Management | Distribution Group Management | 4748 | [AD] Organizational Unit | Success | Security | A security-disabled local group was deleted | 652 |
+--------------------+-------------------------------+----------+----------------------------------------+------------------+-----------+------------------------------------------------------------------------------+---------------------------+
| Account Management | Distribution Group Management | 4749 | [AD] Organizational Unit | Success | Security | A security-disabled global group was created | 653 |
+--------------------+-------------------------------+----------+----------------------------------------+------------------+-----------+------------------------------------------------------------------------------+---------------------------+
| Account Management | Distribution Group Management | 4751 | [AD] Security Group Change History | Success | Security | A member was added to a security-disabled global group | 655 |
+--------------------+-------------------------------+----------+----------------------------------------+------------------+-----------+------------------------------------------------------------------------------+---------------------------+
| Account Management | Distribution Group Management | 4752 | [AD] Security Group Change History | Success | Security | A member was removed from a security-disabled global group | 656 |
+--------------------+-------------------------------+----------+----------------------------------------+------------------+-----------+------------------------------------------------------------------------------+---------------------------+
| Account Management | Distribution Group Management | 4753 | [AD] Organizational Unit | Success | Security | A security-disabled global group was deleted | 657 |
+--------------------+-------------------------------+----------+----------------------------------------+------------------+-----------+------------------------------------------------------------------------------+---------------------------+
| Account Management | Security Group Management | 4754 | [AD] Organizational Unit | Success | Security | A security-enabled universal group was created | 658 |
+--------------------+-------------------------------+----------+----------------------------------------+------------------+-----------+------------------------------------------------------------------------------+---------------------------+
| Account Management | Security Group Management | 4755 | [AD] Organizational Unit | Success | Security | A security-enabled universal group was changed | 659 |
+--------------------+-------------------------------+----------+----------------------------------------+------------------+-----------+------------------------------------------------------------------------------+---------------------------+
| Account Management | Security Group Management | 4756 | [AD] Organizational Unit | Success | Security | A member was added to a security-enabled universal group | 660 |
+--------------------+-------------------------------+----------+----------------------------------------+------------------+-----------+------------------------------------------------------------------------------+---------------------------+
| Account Management | Security Group Management | 4757 | [AD] Organizational Unit | Success | Security | A member was removed from a security-enabled universal group | 661 |
+--------------------+-------------------------------+----------+----------------------------------------+------------------+-----------+------------------------------------------------------------------------------+---------------------------+
| Account Management | Security Group Management | 4758 | [AD] Organizational Unit | Success | Security | A security-enabled universal group was deleted | 662 |
+--------------------+-------------------------------+----------+----------------------------------------+------------------+-----------+------------------------------------------------------------------------------+---------------------------+
| Account Management | Distribution Group Management | 4759 | [AD] Security Group Change History | Success | Security | A security-disabled universal group was created | 663 |
+--------------------+-------------------------------+----------+----------------------------------------+------------------+-----------+------------------------------------------------------------------------------+---------------------------+
| Account Management | Distribution Group Management | 4761 | [AD] Security Group Change History | Success | Security | A member was added to a security-disabled universal group | 655 |
+--------------------+-------------------------------+----------+----------------------------------------+------------------+-----------+------------------------------------------------------------------------------+---------------------------+
| Account Management | Distribution Group Management | 4762 | [AD] Security Group Change History | Success | Security | A member was removed from a security-disabled universal group | 666 |
+--------------------+-------------------------------+----------+----------------------------------------+------------------+-----------+------------------------------------------------------------------------------+---------------------------+
| Account Management | Security Group Management | 4764 | [AD] Organizational Unit | Success | Security | A groups type was changed | 668 |
+--------------------+-------------------------------+----------+----------------------------------------+------------------+-----------+------------------------------------------------------------------------------+---------------------------+
| Account Management | User Account Management | 4765 | [AD] Accounts Overview -> | Success | Security | SID History was added to an account |
| | | | AD Account - Account History | | | |
+--------------------+-------------------------------+----------+----------------------------------------+------------------+-----------+----------------------------------------------------------------------------------------------------------+
| Account Management | User Account Management | 4766 | [AD] Accounts Overview -> | Failure | Security | An attempt to add SID History to an account failed |
| | | | AD Account - Account History | | | |
+--------------------+-------------------------------+----------+----------------------------------------+------------------+-----------+------------------------------------------------------------------------------+---------------------------+
| Account Management | User Account Management | 4767 | [AD] Accounts Overview | Success | Security | A computer account was changed | 646 |
+--------------------+-------------------------------+----------+----------------------------------------+------------------+-----------+------------------------------------------------------------------------------+---------------------------+
| Account Logon | Credential Validation | 4776 | [AD] Failed Logins | Success, Failure | Security | The domain controller attempted to validate the credentials for an account | 680, 681 |
+--------------------+-------------------------------+----------+----------------------------------------+------------------+-----------+------------------------------------------------------------------------------+---------------------------+
| Account Management | User Account Management | 4781 | [AD] Accounts Overview | Success | Security | The name of an account was changed | 685 |
+--------------------+-------------------------------+----------+----------------------------------------+------------------+-----------+------------------------------------------------------------------------------+---------------------------+
| Directory Service | Directory Service Changes | 5136 | [AD] Organizational Unit | Success | Security | A directory service object was modified | 566 |
+--------------------+-------------------------------+----------+----------------------------------------+------------------+-----------+------------------------------------------------------------------------------+---------------------------+
| Directory Service | Directory Service Changes | 5137 | [AD] Organizational Unit | Success | Security | A directory service object was created | 566 |
+--------------------+-------------------------------+----------+----------------------------------------+------------------+-----------+------------------------------------------------------------------------------+---------------------------+
| Directory Service | Directory Service Changes | 5138 | [AD] Organizational Unit | Success | Security | A directory service object was undeleted |
+--------------------+-------------------------------+----------+----------------------------------------+------------------+-----------+----------------------------------------------------------------------------------------------------------+
| Directory Service | Directory Service Changes | 5139 | [AD] Organizational Unit | Success | Security | A directory service object was moved |
+--------------------+-------------------------------+----------+----------------------------------------+------------------+-----------+----------------------------------------------------------------------------------------------------------+
| Object Access | File Share | 5140 | [AD] File Audit | Success | Security | A network share object was accessed |
+--------------------+-------------------------------+----------+----------------------------------------+------------------+-----------+----------------------------------------------------------------------------------------------------------+
| Directory Service | Directory Service Changes | 5141 | [AD] Organizational Unit | Failure | Security | A directory service object was deleted |
+--------------------+-------------------------------+----------+----------------------------------------+------------------+-----------+----------------------------------------------------------------------------------------------------------+
| Object Access | File Share | 5142 | [AD] File Audit | Success | Security | A network share object was added. |
+--------------------+-------------------------------+----------+----------------------------------------+------------------+-----------+----------------------------------------------------------------------------------------------------------+
| Object Access | Detailed File Share | 5145 | [AD] File Audit | Success, Failure | Security | A network share object was checked to see whether client can be granted desired access |
+--------------------+-------------------------------+----------+----------------------------------------+------------------+-----------+----------------------------------------------------------------------------------------------------------+
| Process Tracking | Plug and Play | 6416 | [AD] Removable Device Auditing | Success | Security | A new external device was recognized by the system. |
+--------------------+-------------------------------+----------+----------------------------------------+------------------+-----------+----------------------------------------------------------------------------------------------------------+
Netflow analyzis
The Logstash collector receives and decodes Network Flows using the provided decoders. During decoding, IP address reputation analysis is performed and the result is added to the event document.
Installation
Install/update logstash codec plugins for netflox and sflow
/usr/share/logstash/bin/logstash-plugin install file:///etc/logstash/plugins/logstash-codec-sflow-2.1.3.gem.zip
/usr/share/logstash/bin/logstash-plugin install file:///etc/logstash/plugins/logstash-codec-netflow-4.2.1.gem.zip
/usr/share/logstash/bin/logstash-plugin install file:///etc/logstash/plugins/logstash-input-udp-3.3.4.gem.zip
/usr/share/logstash/bin/logstash-plugin update logstash-input-tcp
/usr/share/logstash/bin/logstash-plugin update logstash-filter-translate
/usr/share/logstash/bin/logstash-plugin update logstash-filter-geoip
/usr/share/logstash/bin/logstash-plugin update logstash-filter-dns
Configuration
Enable Logstash pipeline
vim /etc/logstash/pipeline.yml

- pipeline.id: flows
  path.config: "/etc/logstash/conf.d/netflow/*.conf"
Elasticsearch template installation
curl -XPUT -H 'Content-Type: application/json' -u logserver:logserver 'http://127.0.0.1:9200/_template/netflow' -d@/etc/logstash/templates.d/netflow-template.json
Importing Kibana dashboards
curl -k -X POST -ulogserver:logserver "https://localhost:5601/api/kibana/dashboards/import" -H 'kbn-xsrf: true' -H 'Content-Type: application/json' -d@overview.json
curl -k -X POST -ulogserver:logserver "https://localhost:5601/api/kibana/dashboards/import" -H 'kbn-xsrf: true' -H 'Content-Type: application/json' -d@security.json
curl -k -X POST -ulogserver:logserver "https://localhost:5601/api/kibana/dashboards/import" -H 'kbn-xsrf: true' -H 'Content-Type: application/json' -d@sources.json
curl -k -X POST -ulogserver:logserver "https://localhost:5601/api/kibana/dashboards/import" -H 'kbn-xsrf: true' -H 'Content-Type: application/json' -d@history.json
curl -k -X POST -ulogserver:logserver "https://localhost:5601/api/kibana/dashboards/import" -H 'kbn-xsrf: true' -H 'Content-Type: application/json' -d@destinations.json
Enable reverse dns lookup
To enbled revere DNS lookup set the USE_DNS:false to USE_DNS:true in 13-filter-dns-geoip.conf
Optionally set both dns servers ${DNS_SRV:8.8.8.8} to your local dns
Security rules
Cluster Health rules
| Nr. | Architecture/Application | Rule Name | Index name | Description | Rule type | Rule Definition |
|---|---|---|---|---|---|---|
1 |
Logtrail |
Cluster Services Error Logs |
logtrail-* |
Shows errors in cluster services logs. |
frequency |
# (Optional, any specific) filter: - query_string: query: "log_level:ERROR AND exists:path" # (Optional, any specific) #num_events: 10 #timeframe: # hours: 1 query_key: path timeframe: minutes: 10 num_events: 100 |
2 |
Skimmer |
Cluster Health Status |
skimmer-* |
Health status of the cluster, based on the state of its primary and replica shards. |
any |
timeframe: minutes: 3 filter: - query: query_string: query: cluster_health_status:0 |
3 |
Skimmer |
Cluster Stats Indices Docs Per Sec |
skimmer-* |
A single-value metrics aggregation that calculates an approximate count of distinct values. |
metric_aggregation |
metric_agg_key: "cluster_stats_indices_docs_per_sec" metric_agg_type: "cardinality" doc_type: "_doc" max_threshold: 16000000 buffer_time: minutes: 1 |
4 |
Skimmer |
Indices Stats All Total Store Size In Bytes |
skimmer-* |
Size of the index in byte units. |
metric_aggregation |
metric_agg_key: "indices_stats_all_total_store_size_in_bytes" metric_agg_type: "cardinality" doc_type: "_doc" max_threshold: 60000000000000 buffer_time: minutes: 1 |
5 |
Skimmer |
Logstach Stats CPU Load Average 15M |
skimmer-* |
15m -> Fifteen-minute load average on the system (field is not present if fifteen-minute load average is not available). |
metric_aggregation |
metric_agg_key: "logstash_stats_cpu_load_average_15m" metric_agg_type: "cardinality" doc_type: "_doc" max_threshold: 5 buffer_time: minutes: 1 |
6 |
Skimmer |
Logstash Stats Cpu Percent |
skimmer-* |
Properties of cpu -> percent -> Recent CPU usage for the whole system, or -1 if not supported. |
metric_aggregation |
metric_agg_key: "logstash_stats_cpu_percent" metric_agg_type: "cardinality" doc_type: "_doc" max_threshold: 20 buffer_time: minutes: 1 |
7 |
Skimmer |
Logstash Stats Events Queue Push Duration In Millis |
skimmer-* |
queue_push_duration_in_millis is the accumulative time the input are waiting to push events into the queue. |
metric_aggregation |
metric_agg_key: "logstash_stats_events_queue_push_duration_in_millis" metric_agg_type: "cardinality" doc_type: "_doc" max_threshold: 140000000 buffer_time: minutes: 1 |
8 |
Skimmer |
Logstash Stats Mem Heap Used Percent |
skimmer-* |
Memory currently in use by the heap |
any |
metric_agg_key: "logstash_stats_mem_heap_used_percent" metric_agg_type: "cardinality" doc_type: "_doc" max_threshold: 80 buffer_time: minutes: 1 |
9 |
Skimmer |
Logstash Stats Persisted Queue Size |
skimmer-* |
A Logstash persistent queue helps protect against data loss during abnormal termination by storing the in-flight message queue to disk. |
metric_aggregation |
type: metric_aggregation metric_agg_key: node_stats_/var/lib/logstash/queue_disk_usage query_key: source_node_host metric_agg_type: max doc_type: _doc max_threshold: 734003200 realert: minutes: 15 |
10 |
Skimmer |
Node Stats Expected Data Nodes |
skimmer-* |
Nodes stats API returns cluster nodes statistics |
metric_aggregation |
metric_agg_key: "node_stats_expected_data_nodes" metric_agg_type: "cardinality" doc_type: "_doc" min_threshold: 1 buffer_time: minutes: 1 |
11 |
Skimmer |
Node Stats Indices Flush Duration |
skimmer-* |
flush -> Contains statistics about flush operations for the node. |
metric_aggregation |
metric_agg_key: "node_stats_indices_flush_duration" metric_agg_type: "cardinality" doc_type: "_doc" max_threshold: 250 buffer_time: minutes: 1 |
12 |
Skimmer |
Node Stats Indices Search Fetch Current |
skimmer-* |
fetch_current -> Number of fetch operations currently running. |
metric_aggregation |
metric_agg_key: "node_stats_indices_search_fetch_current" metric_agg_type: "cardinality" doc_type: "_doc" max_threshold: 3,5 buffer_time: minutes: 1 |
13 |
Skimmer |
Node Stats Indices Search Query Current |
skimmer-* |
query_current -> Number of query operations currently running. |
metric_aggregation |
metric_agg_key: "node_stats_indices_search_query_current" metric_agg_type: "cardinality" doc_type: "_doc" max_threshold: 1,5 buffer_time: minutes: 1 |
14 |
Skimmer |
Node Stats Jvm Mem Heap Used Percent |
skimmer-* |
used_percent -> Percentage of used memory. |
metric_aggregation |
metric_agg_key: "node_stats_jvm_mem_heap_used_percent" metric_agg_type: "cardinality" doc_type: "_doc" max_threshold: 87 buffer_time: minutes: 1 |
15 |
Skimmer |
Node Stats Os Cpu Percent |
skimmer-* |
os.cpu_percentage informs how busy the system is. |
any |
metric_agg_key: "node_stats_os_cpu_percent" metric_agg_type: "cardinality" doc_type: "_doc" max_threshold: 90 buffer_time: minutes: 1 |
16 |
Skimmer |
Node Stats Process Cpu Percent |
skimmer-* |
process.cpu.percent informs how much CPU Elasticsearch is using. |
metric_aggregation |
metric_agg_key: "node_stats_process_cpu_percent" metric_agg_type: "cardinality" doc_type: "_doc" max_threshold: 90 buffer_time: minutes: 1 |
17 |
Skimmer |
Node Stats Tasks Current |
skimmer-* |
The task management API returns information about tasks currently executing on one or more nodes in the cluster. |
frequency |
type: frequency num_events: 5000 timeframe: minutes: 1 filter: - query_string: query: 'exists:task_id' |
18 |
Skimmer |
Node Stats TCP Port 5044 |
skimmer-* |
Returns information about the availability of the tcp port. |
any |
filter: - query: query_string: query: node_stats_tcp_port_5044:"unused" |
19 |
Skimmer |
Node Stats TCP Port 5514 |
skimmer-* |
Returns information about the availability of the tcp port. |
any |
filter: - query: query_string: query: node_stats_tcp_port_5514:"unused" |
20 |
Skimmer |
Node Stats TCP Port 5602 |
skimmer-* |
Returns information about the availability of the tcp port. |
any |
filter: - query: query_string: query: node_stats_tcp_port_5602:"unused" |
21 |
Skimmer |
Node Stats TCP Port 9200 |
skimmer-* |
Returns information about the availability of the tcp port. |
any |
timeframe: minutes: 3 filter: - query: query_string: query: node_stats_tcp_port_9200:"unused" |
22 |
Skimmer |
Node Stats TCP Port 9300 |
skimmer-* |
Returns information about the availability of the tcp port. |
any |
filter: - query: query_string: query: node_stats_tcp_port_9300:"unused" |
23 |
Skimmer |
Node Stats TCP Port 9600 |
skimmer-* |
Returns information about the availability of the tcp port. |
any |
timeframe: minutes: 3 filter: - query: query_string: query: node_stats_tcp_port_9600:"unused" |
MS Windows SIEM rules
| Nr. | Architecture/Application | Rule Name | Description | Index name | Requirements | Source | Rule type | Rule definition |
|---|---|---|---|---|---|---|---|---|
1 |
Windows |
Windows - Admin night logon |
Alert on Windows login events when detected outside business hours |
winlogbeat-* |
winlogbeat |
Widnows Security Eventlog |
any |
filter: - query_string: query: "event_id:(4624 OR 1200) AND user.role:admin AND event.hour:(20 OR 21 OR 22 OR 23 0 OR 1 OR 2 OR 3)" |
2 |
Windows |
Windows - Admin task as user |
Alert when admin task is initiated by regular user. Windows event id 4732 is verified towards static admin list. If the user does not belong to admin list AND the event is seen than we generate alert. Static Admin list is a logstash disctionary file that needs to be created manually. During Logstash lookup a field user.role:admin is added to an event. 4732: A member was added to a security-enabled local group |
winlogbeat-* |
winlogbeat Logstash admin dicstionary lookup file |
Widnows Security Eventlog |
any |
filter: - query_string: query: "event_id:4732 AND NOT user.role:admin" |
3 |
Windows |
Windows - diff IPs logon |
Alert when Windows logon process is detected and two or more different IP addressed are seen in source field. Timeframe is last 15min. Detection is based onevents 4624 or 1200. 4624: An account was successfully logged on 1200: Application token success |
winlogbeat-* |
winlogbeat |
Widnows Security Eventlog |
cardinality |
max_cardinality: 1 timeframe: minutes: 15 filter: - query_string: query: "event_id:(4624 OR 1200) AND NOT _exists_:user.role AND NOT event_data.IpAddress:\"-\" " query_key: username |
4 |
Windows |
Windows - Event service error |
Alert when Windows event 1108 is matched 1108: The event logging service encountered an error |
winlogbeat-* |
winlogbeat |
Widnows Security Eventlog |
any |
filter: - query_string: query: "event_id:1108" |
5 |
Windows |
Windows - file insufficient privileges |
Alert when Windows event 5145 is matched 5145: A network share object was checked to see whether client can be granted desired access Every time a network share object (file or folder) is accessed, event 5145 is logged. If the access is denied at the file share level, it is audited as a failure event. Otherwise, it considered a success. This event is not generated for NTFS access. |
winlogbeat-* |
winlogbeat |
Widnows Security Eventlog |
frequency |
query_key: "event_data.IpAddress" num_events: 50 timeframe: minutes: 15 filter: - query_string: query: "event_id:5145" |
6 |
Windows |
Windows - Kerberos pre-authentication failed |
Alert when Windows event 4625 or 4771 is matched 4625: An account failed to log on 4771: Kerberos pre-authentication failed |
winlogbeat-* |
winlogbeat |
Widnows Security Eventlog |
any |
filter: - query_string: query: "event_id:4625 OR event_id:4771" |
7 |
Windows |
Windows - Logs deleted |
Alert when Windows event 1102 OR 104 is matched 1102: The audit log was cleared 104: Event log cleared |
winlogbeat-* |
winlogbeat |
Widnows Security Eventlog |
any |
filter: - query_string: query: 'event_desc:"1102 The audit log was cleared"' |
8 |
Windows |
Windows - Member added to a security-enabled global group |
Alert when Windows event 4728 is matched 4728: A member was added to a security-enabled global group |
winlogbeat-* |
winlogbeat |
Widnows Security Eventlog |
any |
filter: - query_string: query: "event_id:4728" |
9 |
Windows |
Windows - Member added to a security-enabled local group |
Alert when Windows event 4732 is matched 4732: A member was added to a security-enabled local group |
winlogbeat-* |
winlogbeat |
Widnows Security Eventlog |
any |
filter: - query_string: query: "event_id:4732" |
10 |
Windows |
Windows - Member added to a security-enabled universal group |
Alert when Windows event 4756 is matched 4756: A member was added to a security-enabled universal group |
winlogbeat-* |
winlogbeat |
Widnows Security Eventlog |
any |
filter: - query_string: query: "event_id:4756" |
11 |
Windows |
Windows - New device |
Alert when Windows event 6414 is matched 6416: A new external device was recognized by the system |
winlogbeat-* |
winlogbeat |
Widnows Security Eventlog |
any |
filter: - query_string: query: "event_id:6416" |
12 |
Windows |
Windows - Package installation |
Alert when Windows event 4697 is matched 4697: A service was installed in the system |
winlogbeat-* |
winlogbeat |
Widnows Security Eventlog |
any |
filter: - query_string: query: "event_id:4697" |
13 |
Windows |
Windows - Password policy change |
Alert when Windows event 4739 is matched 4739: Domain Policy was changed |
winlogbeat-* |
winlogbeat |
Widnows Security Eventlog |
any |
filter: - query_string: query: "event_id:4739" |
14 |
Windows |
Windows - Security log full |
Alert when Windows event 1104 is matched 1104: The security Log is now full |
winlogbeat-* |
winlogbeat |
Widnows Security Eventlog |
any |
filter: - query_string: query: "event_id:1104" |
15 |
Windows |
Windows - Start up |
Alert when Windows event 4608 is matched 4608: Windows is starting up |
winlogbeat-* |
winlogbeat |
Widnows Security Eventlog |
any |
filter: - query_string: query: "event_id:4608" |
16 |
Windows |
Windows - Account lock |
Alert when Windows event 4740 is matched 4740: A User account was Locked out |
winlogbeat-* |
winlogbeat |
Widnows Security Eventlog |
any |
filter: - query_string: query: "event_id:4740" |
17 |
Windows |
Windows - Security local group was changed |
Alert when Windows event 4735 is matched 4735: A security-enabled local group was changed |
winlogbeat-* |
winlogbeat |
Widnows Security Eventlog |
any |
filter: - query_string: query: "event_id:4735" |
18 |
Windows |
Windows - Reset password attempt |
Alert when Windows event 4724 is matched 4724: An attempt was made to reset an accounts password |
winlogbeat-* |
winlogbeat |
Widnows Security Eventlog |
any |
filter: - query_string: query: "event_id:4724" |
19 |
Windows |
Windows - Code integrity changed |
Alert when Windows event 5038 is matched 5038: Detected an invalid image hash of a file Information: Code Integrity is a feature that improves the security of the operating system by validating the integrity of a driver or system file each time it is loaded into memory. Code Integrity detects whether an unsigned driver or system file is being loaded into the kernel, or whether a system file has been modified by malicious software that is being run by a user account with administrative permissions. On x64-based versions of the operating system, kernel-mode drivers must be digitally signed. The event logs the following information: |
winlogbeat-* |
winlogbeat |
Widnows Security Eventlog |
any |
filter: - query_string: query: "event_id:5038" |
20 |
Windows |
Windows - Application error |
Alert when Windows event 1000 is matched 1000: Application error |
winlogbeat-* |
winlogbeat |
Widnows Application Eventlog |
any |
filter: - query_string: query: "event_id:1000" |
21 |
Windows |
Windows - Application hang |
Alert when Windows event 1001 OR 1002 is matched 1001: Application fault bucket 1002: Application hang |
winlogbeat-* |
winlogbeat |
Widnows Application Eventlog |
any |
filter: - query_string: query: "event_id:1002 OR event_id:1001" |
22 |
Windows |
Windows - Audit policy changed |
Alert when Windows event 4719 is matched 4719: System audit policy was changed |
winlogbeat-* |
winlogbeat |
Widnows Security Eventlog |
any |
filter: - query_string: query: "event_id:4719" |
23 |
Windows |
Windows - Eventlog service stopped |
Alert when Windows event 6005 is matched 6005: Eventlog service stopped |
winlogbeat-* |
winlogbeat |
Widnows Security Eventlog |
any |
filter: - query_string: query: "event_id:6005" |
24 |
Windows |
Windows - New service installed |
Alert when Windows event 7045 OR 4697 is matched 7045,4697: A service was installed in the system |
winlogbeat-* |
winlogbeat |
Widnows Security Eventlog |
any |
filter: - query_string: query: "event_id:7045 OR event_id:4697" |
25 |
Windows |
Windows - Driver loaded |
Alert when Windows event 6 is matched 6: Driver loaded The driver loaded events provides information about a driver being loaded on the system. The configured hashes are provided as well as signature information. The signature is created asynchronously for performance reasons and indicates if the file was removed after loading. |
winlogbeat-* |
winlogbeat |
Widnows System Eventlog |
any |
filter: - query_string: query: "event_id:6" |
26 |
Windows |
Windows - Firewall rule modified |
Alert when Windows event 2005 is matched 2005: A Rule has been modified in the Windows firewall Exception List |
winlogbeat-* |
winlogbeat |
Widnows Security Eventlog |
any |
filter: - query_string: query: 'event_desc:"4947 A change has been made to Windows Firewall exception list. A rule was modified"' |
27 |
Windows |
Windows - Firewall rule add |
Alert when Windows event 2004 is matched 2004: A firewall rule has been added |
winlogbeat-* |
winlogbeat |
Widnows Security Eventlog |
any |
filter: - query_string: query: "event_id:2004" |
28 |
Windows |
Windows - Firewall rule deleted |
Alert when Windows event 2006 or 2033 or 2009 is matched 2006,2033,2009: Firewall rule deleted |
winlogbeat-* |
winlogbeat |
Widnows Security Eventlog |
any |
filter: - query_string: query: "event_id:2006 OR event_id:2033 OR event_id:2009" |
29 |
Windows |
Windows - System has been shutdown |
This event is written when an application causes the system to restart, or when the user initiates a restart or shutdown by clicking Start or pressing CTRL+ALT+DELETE, and then clicking Shut Down. |
winlogbeat-* |
winlogbeat |
Widnows Security Eventlog |
any |
filter: - query_string: query: 'event_id:"1074"' |
30 |
Windows |
Windows - The system time was changed |
The system time has been changed. The event describes the old and new time. |
winlogbeat-* |
winlogbeat |
Widnows Security Eventlog |
any |
filter: - query_string: query: 'event_id:"4616"' |
Network Switch SIEM rules
| Nr. | Architecture/Application | Rule Name | Description | Index name | Requirements | Source | Rule type | Rule definition |
|---|---|---|---|---|---|---|---|---|
1 |
Switch |
Switch - Blocked by LACP |
ports: port <nr> is Blocked by LACP |
syslog-* |
syslog |
any |
filter: - query_string: query: “message:"Blocked by LACP"” |
|
2 |
Switch |
Switch - Blocked by STP |
ports: port <nr> is Blocked by STP |
syslog-* |
syslog |
any |
filter: - query_string: query: “message:"Blocked by STP"” |
|
3 |
Switch |
Switch - Port state changed |
Port state changed to down or up |
syslog-* |
syslog |
any |
filter: - query_string: query: “message:"changed state to"” |
|
4 |
Switch |
Switch - Configured from console |
Configurations changes from console |
syslog-* |
syslog |
any |
filter: - query_string: query: “message:"Configured from console"” |
|
5 |
Switch |
Switch - High collision or drop rate |
syslog-* |
syslog |
any |
filter: - query_string: query: “message:"High collision or drop rate"” |
||
6 |
Switch |
Switch - Invalid login |
auth: Invalid user name/password on SSH session |
syslog-* |
syslog |
any |
filter: - query_string: query: “message:"auth: Invalid user name/password on SSH session"” |
|
7 |
Switch |
Switch - Logged to switch |
syslog-* |
syslog |
any |
filter: - query_string: query: “message:" mgr: SME SSH from"” |
||
8 |
Switch |
Switch - Port is offline |
ports: port <nr> is now off-line |
syslog-* |
syslog |
any |
filter: - query_string: query: “message:" is now off-line"” |
|
9 |
Switch |
Switch - Port is online |
ports: port <nr> is now on-line |
syslog-* |
syslog |
any |
filter: - query_string: query: “message:" is now on-line"” |
Cisco ASA devices SIEM rules
| Nr. | Architecture/Application | Rule Name | Description | Index name | Requirements | Source | Rule type | Rule definition |
|---|---|---|---|---|---|---|---|---|
1 |
Cisco ASA |
Cisco ASA - Device interface administratively up |
Device interface administratively up |
syslog-* |
syslog from Cisco ASA devices |
any |
filter: - query_string: query: ‘cisco.id:”%ASA-4-411003”’ |
|
2 |
Cisco ASA |
Cisco ASA - Device configuration has been changed or reloaded |
Device configuration has been changed or reloaded |
syslog-* |
syslog from Cisco ASA devices |
any |
filter: - query_string: query: ‘cisco.id:(“%ASA-5-111007” OR “%ASA-5-111008”)’ |
|
3 |
Cisco ASA |
Cisco ASA - Device interface administratively down |
Device interface administratively down |
syslog-* |
syslog from Cisco ASA devices |
any |
filter: - query_string: query: ‘cisco.id:”%ASA-4-411004”’ |
|
4 |
Cisco ASA |
Cisco ASA - Device line protocol on Interface changed state to down |
Device line protocol on Interface changed state to down |
syslog-* |
syslog from Cisco ASA devices |
any |
filter: - query_string: query: ‘cisco.id:”%ASA-4-411002”’ |
|
5 |
Cisco ASA |
Cisco ASA - Device line protocol on Interface changed state to up |
Device line protocol on Interface changed state to up |
syslog-* |
syslog from Cisco ASA devices |
any |
filter: - query_string: query: ‘cisco.id:”%ASA-4-411001”’ |
|
6 |
Cisco ASA |
Cisco ASA - Device user executed shutdown |
Device user executed shutdown |
syslog-* |
syslog from Cisco ASA devices |
any |
filter: - query_string: query: ‘cisco.id:”%ASA-5-111010”’ |
|
7 |
Cisco ASA |
Cisco ASA - Multiple VPN authentication failed |
Multiple VPN authentication failed |
syslog-* |
syslog from Cisco ASA devices |
frequency |
query_key: “src.ip” num_events: 10 timeframe: minutes: 240 filter: - query_string: query: “cisco.id:"%ASA-6-113005"” |
|
8 |
Cisco ASA |
Cisco ASA - VPN authentication failed |
VPN authentication failed |
syslog-* |
syslog from Cisco ASA devices |
any |
filter: - query_string: query: “cisco.id:"%ASA-6-113005"” |
|
9 |
Cisco ASA |
Cisco ASA - VPN authentication successful |
VPN authentication successful |
syslog-* |
syslog from Cisco ASA devices |
any |
filter: - query_string: query: “cisco.id:"%ASA-6-113004"” |
|
10 |
Cisco ASA |
Cisco ASA - VPN user locked out |
VPN user locked out |
syslog-* |
syslog from Cisco ASA devices |
any |
filter: - query_string: query: “cisco.id:"%ASA-6-113006"” |
Linux Mail SIEM rules
| Nr. | Architecture/Application | Rule Name | Description | Index name | Requirements | Source | Rule type | Rule definition |
|---|---|---|---|---|---|---|---|---|
1 |
Mail Linux |
Mail - Flood Connect from |
Connection flood, possible DDOS attack |
syslog-* |
syslog |
frequency |
filter: - query_string: query: “message:"connect from"” query_key: host timeframe: hours: 1 num_events: 50 |
|
2 |
Mail Linux |
Mail - SASL LOGIN authentication failed |
User authentication failure |
syslog-* |
syslog |
frequency |
filter: - query_string: query: “message:"SASL LOGIN authentication failed: authentication failure"” query_key: host timeframe: hours: 1 num_events: 30 |
|
3 |
Mail Linux |
Mail - Sender rejected |
Sender rejected |
syslog-* |
syslog |
frequency |
filter: - query_string: query: “message:"NOQUEUE: reject: RCPT from"” query_key: host timeframe: hours: 1 num_events: 20 |
Linux DNS Bind SIEM Rules
| 1 | DNS | DNS - Anomaly in geographic region | DNS anomaly detection in geographic region | filebeat-* | filebeat | spike | query_key: geoip.country_code2 threshold_ref: 500 spike_height: 3 spike_type: “up” timeframe: minutes: 10 filter: - query_string: query: “NOT geoip.country_code2:(US OR PL OR NL OR IE OR DE OR FR OR GB OR SK OR AT OR CZ OR NO OR AU OR DK OR FI OR ES OR LT OR BE OR CH) AND _exists_:geoip.country_code2 AND NOT domain:(*.outlook.com OR *.pool.ntp.org)” | |
|---|---|---|---|---|---|---|---|---|
2 |
DNS |
DNS - Domain requests |
Domain requests |
filebeat-* |
filebeat |
frequency |
query_key: “domain” num_events: 1000 timeframe: minutes: 5 filter: - query_string: query: “NOT domain:(/.*localdomain/) AND _exists_:domain” |
|
3 |
DNS |
DNS - Domain requests by source IP |
Domain requests by source IP |
filebeat-* |
filebeat |
cadrinality |
query_key: “src_ip” cardinality_field: “domain” max_cardinality: 3000 timeframe: minutes: 10 filter: - query_string: query: “(NOT domain:(/.*.arpa/ OR /.*localdomain/ OR /.*office365.com/) AND _exists_:domain” |
|
4 |
DNS |
DNS - Resolved domain matches IOC IP blacklist |
Resolved domain matches IOC IP blacklist |
filebeat-* |
filebeat |
blacklist-ioc |
compare_key: “domain_ip” blacklist-ioc: - “!yaml /etc/logstash/lists/misp_ip.yml” |
Fortigate Devices SIEM rules
| Nr. | Architecture/Application | Rule Name | Description | Index name | Requirements | Source | Rule type | Rule definition |
|---|---|---|---|---|---|---|---|---|
1 |
FortiOS 6.x |
Fortigate virus |
fortigate* |
FortiOS with Antivirus, IPS, Fortisandbox modules, Logstash KV filter, default-base-template |
syslog from Forti devices |
Any |
filter: - query_string: query: “subtype:virus and action:blocked” |
|
2 |
FortiOS 6.x |
Fortigate http server attack by destination IP |
fortigate* |
FortiOS with waf, IPS, modules, Logstash KV filter, default-base-template |
syslog from Forti devices |
frequency |
query_key: “dst_ip” num_events: 10 timeframe: hours: 1 filter: - query_string: query: “level:alert and subtype:ips and action:dropped and profile:protect_http_server” |
|
3 |
FortiOS 6.x |
Fortigate forward deny by source IP |
fortigate* |
FortiOS with IPS, modules, Logstash KV filter, default-base-template |
syslog from Forti devices |
frequency |
query_key: “src_ip” num_events: 250 timeframe: hours: 1 filter: - query_string: query: “subtype:forward AND action:deny” |
|
4 |
FortiOS 6.x |
Fortigate failed login |
fortigate* |
FortiOS with IPS, modules, Logstash KV filter, default-base-template |
syslog from Forti devices |
Any |
filter: - query_string: query: “action:login and status:failed” |
|
5 |
FortiOS 6.x |
Fortigate failed login same source |
fortigate* |
FortiOS with IPS, modules, Logstash KV filter, default-base-template |
syslog from Forti devices |
frequency |
query_key: “src_ip” num_events: 18 timeframe: minutes: 45 filter: - query_string: query: “action:login and status:failed” |
|
6 |
FortiOS 6.x |
Fortigate device configuration changed |
fortigate* |
FortiOS with IPS, modules, Logstash KV filter, default-base-template |
syslog from Forti devices |
any |
filter: - query_string: query:”"Configuration is changed in the admin session"” |
|
7 |
FortiOS 6.x |
Fortigate unknown tunneling setting |
fortigate* |
FortiOS with IPS, modules, Logstash KV filter, default-base-template |
syslog from Forti devices |
any |
filter: - query_string: query:”"http_decoder: HTTP.Unknown.Tunnelling"” |
|
8 |
FortiOS 6.x |
Fortigate multiple tunneling same source |
fortigate* |
FortiOS with IPS, modules, Logstash KV filter, default-base-template |
syslog from Forti devices |
frequency |
query_key: “src_ip” num_events: 18 timeframe: minutes: 45 filter: - query_string: query: “"http_decoder: HTTP.Unknown.Tunnelling"” |
|
9 |
FortiOS 6.x |
Fortigate firewall configuration changed |
fortigate* |
FortiOS with IPS, modules, Logstash KV filter, default-base-template |
syslog from Forti devices |
any |
filter: - query_string: query:”action:Edit” |
|
10 |
FortiOS 6.x |
Fortigate SSL VPN login fail |
fortigate* |
FortiOS with IPS, modules, Logstash KV filter, default-base-template |
syslog from Forti devices |
any |
filter: - query_string: query:”ssl-login-fail” |
|
11 |
FortiOS 6.x |
Fortigate Multiple SSL VPN login failed same source |
fortigate* |
FortiOS with IPS, modules, Logstash KV filter, default-base-template |
syslog from Forti devices |
frequency |
query_key: “src_ip” num_events: 18 timeframe: minutes: 45 filter: - query_string: query: “ssl-login-fail” |
|
12 |
FortiOS 6.x |
Fortigate suspicious traffic |
fortigate* |
FortiOS with IPS, modules, Logstash KV filter, default-base-template |
syslog from Forti devices |
any |
filter: - query_string: query:”type:traffic AND status:high” |
|
13 |
FortiOS 6.x |
Fortigate suspicious traffic same source |
fortigate* |
FortiOS with IPS, modules, Logstash KV filter, default-base-template |
syslog from Forti devices |
frequency |
query_key: “src_ip” num_events: 18 timeframe: minutes: 45 filter: - query_string: query: “type:traffic AND status:high” |
|
14 |
FortiOS 6.x |
Fortigate URL blocked |
fortigate* |
FortiOS with IPS, modules, Logstash KV filter, default-base-template |
syslog from Forti devices |
any |
filter: - query_string: query:”action:blocked AND status:warning” |
|
15 |
FortiOS 6.x |
Fortigate multiple URL blocked same source |
fortigate* |
FortiOS with IPS, modules, Logstash KV filter, default-base-template |
syslog from Forti devices |
frequency |
query_key: “src_ip” num_events: 18 timeframe: minutes: 45 filter: - query_string: query: “action:blocked AND status:warning” |
|
16 |
FortiOS 6.x |
Fortigate attack detected |
fortigate* |
FortiOS with IPS, modules, Logstash KV filter, default-base-template |
syslog from Forti devices |
any |
filter: - query_string: query:”attack AND action:detected” |
|
17 |
FortiOS 6.x |
Fortigate attack dropped |
fortigate* |
FortiOS with IPS, modules, Logstash KV filter, default-base-template |
syslog from Forti devices |
any |
filter: - query_string: query:”attack AND action:dropped” |
Linux Apache SIEM rules
| Nr. | Architecture/Application | Rule Name | Description | Index name | Requirements | Source | Rule type | Rule definition |
|---|---|---|---|---|---|---|---|---|
1 |
Apache |
HTTP 1xx peak |
Response status 1xx |
httpd* |
Apache logs |
spike |
threshold_cur: 100 timeframe: hours: 2 spike_height: 5 spike_type: “up” filter: - query: query_string: query: “response.status.code:1*” - type: value: “_doc” |
|
2 |
Apache |
HTTP 2xx responses for unwanted URLs |
Requests for URLS like: - /phpMyAdmin, /wpadmin, /wp-login.php, /.env, /admin, /owa/auth/logon.aspx, /api, /license.txt, /api/v1/pods, /solr/admin/info/system, /backup/, /admin/config.php, /dana-na, /dbadmin/, /myadmin/, /mysql/, /php-my-admin/, /sqlmanager/, /mysqlmanager/, config.php |
httpd* |
Apache logs |
blacklist |
compare_key: http.request ignore_null: true blacklist: - /phpMyAdmin - /wpadmin - /wp-login.php - /.env - /admin - /owa/auth/logon.aspx - /api - /license.txt - /api/v1/pods - /solr/admin/info/system - /backup/ - /admin/config.php - /dana-na - /dbadmin/ - /myadmin/ - /mysql/ - /php-my-admin/ - /sqlmanager/ - /mysqlmanager/ - config.php |
|
3 |
Apache |
HTTP 2xx spike |
httpd* |
Apache logs |
spike |
threshold_cur: 100 timeframe: hours: 2 spike_height: 5 spike_type: “up” filter: - query: query_string: query: “response.status.code:2*” - type: value: “_doc” |
||
4 |
Apache |
HTTP 3x spike |
Response status 3xx |
httpd* |
Apache logs |
any |
threshold_cur: 100 timeframe: hours: 2 spike_height: 5 spike_type: “up” filter: - query: query_string: query: “response.status.code:3*” - type: value: “_doc” |
|
5 |
Apache |
HTTP 4xx spike |
Response status 4xx |
httpd* |
Apache logs |
spike |
threshold_cur: 100 timeframe: hours: 2 spike_height: 5 spike_type: “up” filter: - query: query_string: query: “response.status.code:4*” - type: value: “_doc” |
|
6 |
Apache |
HTTP 5xx spike |
Response status 5xx |
httpd* |
Apache logs |
spike |
threshold_cur: 100 timeframe: hours: 2 spike_height: 5 spike_type: “up” filter: - query: query_string: query: “response.status.code:5*” - type: value: “_doc” |
RedHat / CentOS system SIEM rules
| Nr. | Architecture/Application | Rule Name | Description | Index name | Requirements | Source | Rule type | Rule definition |
|---|---|---|---|---|---|---|---|---|
1 |
Linux |
Linux - Group Change |
syslog-* |
Syslog |
any |
filter: - query_string: query: “message:"added by root to group"” |
||
2 |
Linux |
Linux - Group Created |
syslog-* |
Syslog |
any |
filter: - query_string: query: “message:"new group: "” |
||
3 |
Linux |
Linux - Group Removed |
syslog-* |
Syslog |
any |
filter: - query_string: query: “message:"removed group: " OR message:"removed shadow group: "” |
||
4 |
Linux |
Linux - Interrupted Login |
syslog-* |
Syslog |
any |
filter: - query_string: query: “message:"Connection closed by"” |
||
5 |
Linux |
Linux -Login Failure |
syslog-* |
Syslog |
any |
filter: - query_string: query: “message:"Failed password for"” |
||
6 |
Linux |
Linux - Login Success |
syslog-* |
Syslog |
any |
filter: - query_string: query: “message:"Accepted password for"” |
||
7 |
Linux |
Linux - Out of Memory |
syslog-* |
Syslog |
any |
filter: - query_string: query: “message:"killed process"” |
||
8 |
Linux |
Linux - Password Change |
syslog-* |
Syslog |
any |
filter: - query_string: query: “message:"password changed"” |
||
9 |
Linux |
Linux - Process Segfaults |
syslog-* |
Syslog |
any |
filter: - query_string: query: “message:segfault” |
||
10 |
Linux |
Linux - Process Traps |
syslog-* |
Syslog |
any |
filter: - query_string: query: “message:traps” |
||
11 |
Linux |
Linux - Service Started |
syslog-* |
Syslog |
any |
filter: - query_string: query: “message:Started” |
||
12 |
Linux |
Linux - Service Stopped |
syslog-* |
Syslog |
any |
filter: - query_string: query: “message:Stopped” |
||
13 |
Linux |
Linux - Software Erased |
syslog-* |
Syslog |
any |
filter: - query_string: query: “message:"Erased: "” |
||
14 |
Linux |
Linux - Software Installed |
syslog-* |
Syslog |
any |
filter: - query_string: query: “message:"Installed: "” |
||
15 |
Linux |
Linux - Software Updated |
syslog-* |
Syslog |
any |
filter: - query_string: query: “message:"Updated: "” |
||
16 |
Linux |
Linux - User Created |
syslog-* |
Syslog |
any |
filter: - query_string: query: “message:"new user: "” |
||
17 |
Linux |
Linux - User Removed |
syslog-* |
Syslog |
any |
filter: - query_string: query: “message:"delete user"” |
Checkpoint devices SIEM rules
| Nr. | Architecture/Application | Rule Name | Description | Index name | Requirements | Source | Rule type | Rule definition |
|---|---|---|---|---|---|---|---|---|
1 |
VPN-1 & FireWall-1 |
Checkpoint - Drop a packet by source IP |
checkpoint* |
Checkpoint devices, fw1-grabber ( https://github.com/certego/fw1-loggrabber ) |
Checkpoint firewall, OPSEC Log Export APIs (LEA) |
Frequency |
query_key: “src” num_events: 10 timeframe: hours: 1 filter: - query_string: query: “action:drop” use_count_query: true doc_type: doc |
|
2 |
VPN-1 & FireWall-1 |
Checkpoint - Reject by source IP |
checkpoint* |
Checkpoint devices, fw1-grabber ( https://github.com/certego/fw1-loggrabber ) |
Checkpoint firewall, OPSEC Log Export APIs (LEA) |
Frequency |
query_key: “src” num_events: 10 timeframe: hours: 1 filter: - query_string: query: “action:reject” use_count_query: true doc_type: doc |
|
3 |
VPN-1 & FireWall-1 |
Checkpoint - User login |
checkpoint* |
Checkpoint devices, fw1-grabber ( https://github.com/certego/fw1-loggrabber ) |
Checkpoint firewall, OPSEC Log Export APIs (LEA) |
Any |
query_key: “user” filter: - query_string: query: “auth_status:"Successful Login"” use_count_query: true doc_type: doc |
|
4 |
VPN-1 & FireWall-1 |
Checkpoint - Failed Login |
checkpoint* |
Checkpoint devices, fw1-grabber ( https://github.com/certego/fw1-loggrabber ) |
Checkpoint firewall, OPSEC Log Export APIs (LEA) |
Any |
query_key: “user” filter: - query_string: query: “auth_status:"Failed Login"” use_count_query: true doc_type: doc |
|
5 |
VPN-1 & FireWall-1 |
Checkpoint - Application Block by user |
checkpoint* |
Checkpoint devices, fw1-grabber ( https://github.com/certego/fw1-loggrabber ) |
Checkpoint firewall, OPSEC Log Export APIs (LEA) |
Frequency |
query_key: “user” num_events: 10 timeframe: hours: 1 filter: - query_string: query: “action:block AND product:"Application Control"” use_count_query: true doc_type: doc |
|
6 |
VPN-1 & FireWall-1 |
Checkpoint - URL Block by user |
checkpoint* |
Checkpoint devices, fw1-grabber ( https://github.com/certego/fw1-loggrabber ) |
Checkpoint firewall, OPSEC Log Export APIs (LEA) |
Frequency |
query_key: “user” num_events: 10 timeframe: hours: 1 filter: - query_string: query: “action:block AND product:"URL Filtering"” use_count_query: true doc_type: doc |
|
7 |
VPN-1 & FireWall-1 |
Checkpoint - Block action with user |
checkpoint* |
Checkpoint devices, fw1-grabber ( https://github.com/certego/fw1-loggrabber ) |
Checkpoint firewall, OPSEC Log Export APIs (LEA) |
Any |
query_key: “user” filter: - query_string: query: “action:block” use_count_query: true doc_type: doc |
|
8 |
VPN-1 & FireWall-1 |
Checkpoint - Encryption keys were created |
checkpoint* |
Checkpoint devices, fw1-grabber ( https://github.com/certego/fw1-loggrabber ) |
Checkpoint firewall, OPSEC Log Export APIs (LEA) |
Any |
filter: - query_string: query: “action:keyinst” use_count_query: true doc_type: doc |
|
9 |
VPN-1 & FireWall-1 |
Checkpoint - Connection was detected by Interspect |
checkpoint* |
Checkpoint devices, fw1-grabber ( https://github.com/certego/fw1-loggrabber ) |
Checkpoint firewall, OPSEC Log Export APIs (LEA) |
Any |
filter: - query_string: query: “action:detect” use_count_query: true doc_type: doc |
|
10 |
VPN-1 & FireWall-1 |
Checkpoint - Connection was subject to a configured protections |
checkpoint* |
Checkpoint devices, fw1-grabber ( https://github.com/certego/fw1-loggrabber ) |
Checkpoint firewall, OPSEC Log Export APIs (LEA) |
Any |
filter: - query_string: query: “action:inspect” use_count_query: true doc_type: doc |
|
11 |
VPN-1 & FireWall-1 |
Checkpoint - Connection with source IP was quarantined |
checkpoint* |
Checkpoint devices, fw1-grabber ( https://github.com/certego/fw1-loggrabber ) |
Checkpoint firewall, OPSEC Log Export APIs (LEA) |
Any |
query_key: “src” filter: - query_string: query: “action:quarantine” use_count_query: true doc_type: doc |
|
12 |
VPN-1 & FireWall-1 |
Checkpoint - Malicious code in the connection with source IP was replaced |
checkpoint* |
Checkpoint devices, fw1-grabber ( https://github.com/certego/fw1-loggrabber ) |
Checkpoint firewall, OPSEC Log Export APIs (LEA) |
Any |
query_key: “src” filter: - query_string: query: “action:"Replace Malicious code"” use_count_query: true doc_type: doc |
|
13 |
VPN-1 & FireWall-1 |
Checkpoint - Connection with source IP was routed through the gateway acting as a central hub |
checkpoint* |
Checkpoint devices, fw1-grabber ( https://github.com/certego/fw1-loggrabber ) |
Checkpoint firewall, OPSEC Log Export APIs (LEA) |
Any |
query_key: “src” filter: - query_string: query: “action:"VPN routing"” use_count_query: true doc_type: doc |
|
14 |
VPN-1 & FireWall-1 |
Checkpoint - Security event with user was monitored |
checkpoint* |
Checkpoint devices, fw1-grabber ( https://github.com/certego/fw1-loggrabber ) |
Checkpoint firewall, OPSEC Log Export APIs (LEA) |
Frequency |
query_key: “user” num_events: 10 timeframe: hours: 1 filter: - query_string: query: “action:Monitored” use_count_query: true doc_type: doc |
Cisco ESA devices SIEM rule
| Nr. | Architecture/Application | Rule Name | Description | Index name | Requirements | Source | Rule type | Rule definition |
|---|---|---|---|---|---|---|---|---|
1 |
Cisco ESA |
ESA - Attachments exceeded the URL scan |
syslog-* |
Cisco ESA |
any |
filter: - query_string: query: ‘message:”attachments exceeded the URL scan”’ |
||
2 |
Cisco ESA |
ESA - Extraction Failure |
syslog-* |
Cisco ESA |
any |
filter: - query_string: query: ‘message:”Extraction Failure”’ |
||
3 |
Cisco ESA |
ESA - Failed to expand URL |
syslog-* |
Cisco ESA |
any |
filter: - query_string: query: ‘message:”Failed to expand URL”’ |
||
4 |
Cisco ESA |
ESA - Invalid host configured |
syslog-* |
Cisco ESA |
any |
filter: - query_string: query: ‘message:”Invalid host configured”’ |
||
5 |
Cisco ESA |
ESA - Marked unscannable due to RFC Violation |
syslog-* |
Cisco ESA |
any |
filter: - query_string: query: ‘message:”was marked unscannable due to RFC Violation”’ |
||
6 |
Cisco ESA |
ESA - Message was not scanned for Sender Domain Reputation |
syslog-* |
Cisco ESA |
any |
filter: - query_string: query: ‘message:”Message was not scanned for Sender Domain Reputation”’ |
||
7 |
Cisco ESA |
ESA - URL Reputation Rule |
syslog-* |
Cisco ESA |
any |
filter: - query_string: query: ‘message:”URL Reputation Rule”’ |
Forcepoint devices SIEM rules
| Nr. | Architecture/Application | Rule Name | Description | Index name | Requirements | Source | Rule type | Rule definition |
|---|---|---|---|---|---|---|---|---|
1 |
Forcepoint HIGH |
All high alerts |
syslog-dlp* |
any |
alert_text_type: alert_text_only alert_text: “Forcepoint HIGH alert\n\n When: {}\n Analyzed by: {}\n User name: {}\n Source: {}\nDestination: {}\n\n{}\n” alert_text_args: - timestamp_timezone - Analyzed_by - user - Source - Destination - kibana_link use_kibana4_dashboard: “link do saved search” kibana4_start_timedelta: minutes: 5 kibana4_end_timedelta: minutes: 0 filter: - query_string: query: “Severity:HIGH” |
|||
2 |
Forcepoint MEDIUM |
All medium alerts |
syslog-dlp* |
any |
alert_text_type: alert_text_only alert_text: “Forcepoint MEDIUM alert\n\n When: {}\n Analyzed by: {}\n User name: {}\n Source: {}\nDestination: {}\n\n{}\n” alert_text_args: - timestamp_timezone - Analyzed_by - user - Source - Destination - kibana_link use_kibana4_dashboard: “link do saved search” kibana4_start_timedelta: minutes: 5 kibana4_end_timedelta: minutes: 0 filter: - query_string: query: “Severity:MEDIUM” |
|||
3 |
Forcepoint LOW |
All low alerts |
syslog-dlp* |
any |
alert_text_type: alert_text_only alert_text: “Forcepoint LOW alert\n\n When: {}\n Analyzed by: {}\n User name: {}\n Source: {}\nDestination: {}\n\n{}\n” alert_text_args: - timestamp_timezone - Analyzed_by - user - Source - Destination - kibana_link use_kibana4_dashboard: “link do saved search” kibana4_start_timedelta: minutes: 5 kibana4_end_timedelta: minutes: 0 filter: - query_string: query: “Severity:LOW” |
|||
4 |
Forcepoint blocked email |
Email was blocked by forcepoint |
syslog-dlp* |
any |
alert_text_type: alert_text_only alert_text: “Email blocked\n\n When: {}\n Analyzed by: {}\n File name: {}\n Source: {}\nDestination: {}\n\n{}\n” alert_text_args: - timestamp_timezone - Analyzed_by - File_Name - Source - Destination - kibana_link use_kibana4_dashboard: “link do saved search” kibana4_start_timedelta: minutes: 5 kibana4_end_timedelta: minutes: 0 filter: - query_string: query: “Action:Blocked and Channel:Endpoint Email” |
|||
5 |
Forcepoint removables |
Forcepoint blocked data transfer to removeable device |
syslog-dlp* |
any |
alert_text_type: alert_text_only alert_text: “Data transfer to removable device blocked\n\n When: {}\n Analyzed by: {}\n File name: {}\n Source: {}\nDestination: {}\n\n{}\n” alert_text_args: - timestamp_timezone - Analyzed_by - File_Name - Source - Destination - kibana_link use_kibana4_dashboard: “link do saved search” kibana4_start_timedelta: minutes: 5 kibana4_end_timedelta: minutes: 0 filter: - query_string: query: “Action:Blocked and Channel:Endpoint Removable Media” |
Oracle Database Engine SIEM rules
| Nr. | Architecture/Application | Rule Name | Description | Index name | Requirements | Source | Rule type | Rule definition |
|---|---|---|---|---|---|---|---|---|
1 |
Oracle DB |
Oracle - Allocate memory ORA-00090 |
Failed to allocate memory for cluster database |
oracle-* |
Filebeat |
Oracle Alert Log |
any |
timeframe: minutes: 15 filter: - term: oracle.code: “ora-00090” |
2 |
Oracle DB |
Oracle logon denied ORA-12317 |
logon to database (link name string) |
oracle-* |
Filebeat |
Oracle Alert Log |
any |
timeframe: minutes: 15 filter: - term: oracle.code: “ora-12317” |
3 |
Oracle DB |
Oracle credential failed ORA-12638 |
Credential retrieval failed |
oracle-* |
Filebeat |
Oracle Alert Log |
any |
timeframe: minutes: 15 num_events: 10 filter: - term: oracle.code: “ora-12638” |
4 |
Oracle DB |
Oracle client internal error ORA-12643 |
Client received internal error from server |
oracle-* |
Filebeat |
Oracle Alert Log |
any |
timeframe: minutes: 15 num_events: 10 filter: - term: oracle.code: “ora-12643” |
5 |
Oracle DB |
ORA-00018: maximum number of sessions exceeded |
oracle-* |
Filebeat |
Oracle Alert Log |
any |
timeframe: minutes: 15 filter: - term: oracle.code: “ora-00018” |
|
6 |
Oracle DB |
ORA-00019: maximum number of session licenses exceeded |
oracle-* |
Filebeat |
Oracle Alert Log |
any |
timeframe: minutes: 15 filter: - term: oracle.code: “ora-00019” |
|
7 |
Oracle DB |
ORA-00020: maximum number of processes (string) exceeded |
oracle-* |
Filebeat |
Oracle Alert Log |
any |
timeframe: minutes: 15 filter: - term: oracle.code: “ora-00020” |
|
8 |
Oracle DB |
ORA-00024: logins from more than one process not allowed in single-process mode |
oracle-* |
Filebeat |
Oracle Alert Log |
any |
timeframe: minutes: 15 filter: - term: oracle.code: “ora-00024” |
|
9 |
Oracle DB |
ORA-00025: failed to allocate string ( out of memory ) |
oracle-* |
Filebeat |
Oracle Alert Log |
any |
timeframe: minutes: 15 filter: - term: oracle.code: “ora-00025” |
|
10 |
Oracle DB |
ORA-00055: maximum number of DML locks exceeded |
oracle-* |
Filebeat |
Oracle Alert Log |
any |
timeframe: minutes: 15 filter: - term: oracle.code: “ora-00055” |
|
11 |
Oracle DB |
ORA-00057: maximum number of temporary table locks exceeded |
oracle-* |
Filebeat |
Oracle Alert Log |
any |
timeframe: minutes: 15 filter: - term: oracle.code: “ora-00057” |
|
12 |
Oracle DB |
ORA-00059: maximum number of DB_FILES exceeded |
oracle-* |
Filebeat |
Oracle Alert Log |
any |
timeframe: minutes: 15 filter: - term: oracle.code: “ora-00059” |
|
13 |
Oracle DB |
Oracle - Deadlocks ORA - 0060 |
Deadlock detected while waiting for resource |
oracle-* |
Filebeat |
Oracle Alert Log |
any |
timeframe: minutes: 15 filter: - term: oracle.code: “ora-00060” |
14 |
Oracle DB |
ORA-00063: maximum number of log files exceeded |
oracle-* |
Filebeat |
Oracle Alert Log |
any |
timeframe: minutes: 15 filter: - term: oracle.code: “ora-00063” |
|
15 |
Oracle DB |
ORA-00064: object is too large to allocate on this O/S |
oracle-* |
Filebeat |
Oracle Alert Log |
any |
timeframe: minutes: 15 filter: - term: oracle.code: “ora-00064” |
|
16 |
Oracle DB |
ORA-12670: Incorrect role password |
oracle-* |
Filebeat |
Oracle Alert Log |
any |
timeframe: minutes: 15 num_events: 10 filter: - term: oracle.code: “ora-12670” |
|
17 |
Oracle DB |
ORA-12672: Database logon failure |
oracle-* |
Filebeat |
Oracle Alert Log |
any |
timeframe: minutes: 15 num_events: 10 filter: - term: oracle.code: “ora-12672” |
Paloalto devices SIEM rules
| Nr. | Architecture/Application | Rule Name | Description | Index name | Requirements | Source | Rule type | Rule definition |
|---|---|---|---|---|---|---|---|---|
1 |
Paloalto - Configuration changes failed |
Config changes Failed |
paloalto-* |
frequency |
timeframe: minutes: 15 num_events: 10 filter: - term: pan.type: CONFIG - term: result: Failed |
|||
2 |
Paloalto - Flood detected |
Flood detected via a Zone Protection profile |
paloalto-* |
frequency |
timeframe: minutes: 15 num_events: 10 filter: - term: pan.type: THREAT - term: pan.subtype: flood |
|||
3 |
Paloalto - Scan detected |
Scan detected via a Zone Protection profile |
paloalto-* |
frequency |
timeframe: minutes: 15 num_events: 10 filter: - term: pan.type: THREAT - term: pan.subtype: scan |
|||
4 |
Paloalto - Spyware detected |
Spyware detected via an Anti-Spyware profile |
paloalto-* |
frequency |
timeframe: minutes: 15 num_events: 10 filter: - term: pan.type: THREAT - term: pan.subtype: spyware |
|||
5 |
Paloalto - Unauthorized configuration changed |
Attepmted Unauthorized configuration changes |
paloalto-* |
frequency |
timeframe: minutes: 15 num_events: 10 filter: - term: pan.type: CONFIG - term: result: Unathorized |
|||
6 |
Paloalto - Virus detected |
Virus detected via an Antivirus profile. |
paloalto-* |
frequency |
timeframe: minutes: 15 num_events: 10 filter: - term: pan.type: THREAT - terms: pan.subtype: [ “virus”, “wildfire-virus” ] |
|||
7 |
Paloalto - Vulnerability exploit detected |
Vulnerability exploit detected via a Vulnerability Protection profile |
paloalto-* |
frequency |
timeframe: minutes: 15 num_events: 10 filter: - term: pan.type: THREAT - term: pan.subtype: vulnerability |
Microsoft Exchange SIEM rules
| Nr. | Architecture/Application | Rule Name | Description | Index name | Requirements | Source | Rule type | Rule definition |
|---|---|---|---|---|---|---|---|---|
1 |
MS Exchange |
Exchange - Increased amount of incoming emails |
exchange-* |
spike |
metric_agg_key: “exchange.network-message-id” metric_agg_type: “cardinality” doc_type: “_doc” max_threshold: 10 buffer_time: minutes: 1 filter: - query_string: query: “exchange.sender-address:*.company.com AND exchange.event-id:SEND AND exchange.message-subject:*” query_key: [“exchange.message-subject-agg”, “exchange.sender-address”] |
|||
2 |
MS Exchange |
Exchange - Internal sender sent email to public provider |
exchange-* |
whitelist |
metric_agg_key: “exchange.network-message-id” metric_agg_type: “cardinality” doc_type: “_doc” max_threshold: 10 buffer_time: minutes: 1 filter: - query_string: query: “NOT exchange.sender-address:(*@company.com) AND exchange.event-id:SEND AND exchange.message-subject:* AND NOT exchange.recipient-address:public@company.com” query_key: [“exchange.message-subject-agg”, “exchange.sender-address”] |
|||
3 |
MS Exchange |
Exchange - Internal sender sent ethe same title to many recipients |
exchange-* |
metric_aggregation |
filter: - query_string: query: “NOT exchange.recipient-address:public@company.com AND NOT exchange.sender-address:(*@company.com) AND exchange.event-id:SEND AND exchange.data.atch:[1 TO *] AND_exists_:exchange AND exchange.message-subject:(/.*invoice.*/ OR /.*payment.*/ OR /.*faktur.*/)” query_key: [“exchange.sender-address”] |
|||
4 |
MS Exchange |
Exchange - Received email with banned title |
exchange-* |
any |
threshold_ref: 5 timeframe: days: 1 spike_height: 3 spike_type: “up” alert_on_new_data: false use_count_query: true doc_type: _doc query_key: [“exchange.sender-address”] filter: - query_string: query: “NOT exchange.event-id:(DEFER OR RECEIVE OR AGENTINFO) AND _exists_:exchange” |
|||
5 |
MS Exchange |
Exchange - The same title to many recipients |
exchange-* |
metric_aggregation |
compare_key: “exchange.sender-address” ignore_null: true filter: - query_string: query: “NOT exchange.recipient-address:(*@company.com) AND _exists_:exchange.recipient-address AND exchange.event-id:AGENTINFO AND NOT exchange.sender-address:(bok@* OR postmaster@*) AND exchange.data.atch:[1 TO *] AND exchange.recipient-count:1 AND exchange.recipient-address:(*@gmail.com OR *@wp.pl OR *@o2.pl OR *@interia.pl OR *@op.pl OR *@onet.pl OR *@vp.pl OR *@tlen.pl OR *@onet.eu OR *@poczta.fm OR *@interia.eu OR *@hotmail.com OR *@gazeta.pl OR *@yahoo.com OR *@icloud.com OR *@outlook.com OR *@autograf.pl OR *@neostrada.pl OR *@vialex.pl OR *@go2.pl OR *@buziaczek.pl OR *@yahoo.pl OR *@post.pl OR *@wp.eu OR *@me.com OR *@yahoo.co.uk OR *@onet.com.pl OR *@tt.com.pl OR *@spoko.pl OR *@amorki.pl OR *@7dots.pl OR *@googlemail.com OR *@gmx.de OR *@upcpoczta.pl OR *@live.com OR *@piatka.pl OR *@opoczta.pl OR *@web.de OR *@protonmail.com OR *@poczta.pl OR *@hot.pl OR *@mail.ru OR *@yahoo.de OR *@gmail.pl OR *@02.pl OR *@int.pl OR *@adres.pl OR *@10g.pl OR *@ymail.com OR *@data.pl OR *@aol.com OR *@gmial.com OR *@hotmail.co.uk)” whitelist: - allowed@example.com - allowed@example2.com |
Juniper Devices SIEM Rules
| Nr. | Architecture/Application | Rule Name | Description | Index name | Requirements | Source | Rule type | Rule definition |
|---|---|---|---|---|---|---|---|---|
1 |
Junos-IDS |
Juniper - IDS attact detection |
junos* |
JunOS devices with IDS module |
Syslog from Juniper devices |
Any |
filter: - query_string: query: “_exists_:attack-name” include: - attack-name |
|
2 |
Junos-IDS |
Junos - RT flow session deny |
junos* |
JunOS devices SRX, RT Fflow |
Syslog from Juniper devices |
Any |
filter: - query_string: query: “category:RT_FLOW AND subcat:RT_FLOW_SESSION_DENY” include: - srcip - dstip |
|
3 |
Junos-IDS |
Junos - RT flow reassemble fail |
junos* |
JunOS devices SRX, RT Fflow |
Syslog from Juniper devices |
Any |
filter: - query_string: query: “category:RT_FLOW AND subcat:FLOW_REASSEMBLE_FAIL” include: - srcip - dstip |
|
4 |
Junos-IDS |
Junos - RT flow mcast rpf fail |
junos* |
JunOS devices SRX, RT Fflow |
Syslog from Juniper devices |
Any |
filter: - query_string: query: “category:RT_FLOW AND subcat:FLOW_MCAST_RPF_FAIL” include: - srcip - dstip |
Fudo SIEM Rules
| Nr. | Architecture/Application | Rule Name | Description | Index name | Requirements | Source | Rule type | Rule definition |
|---|---|---|---|---|---|---|---|---|
1 |
Fudo - General Error |
fudo* |
http://download.wheelsystems.com/documentation/fudo/4_0/online_help/en/reference/en/log_messages.html |
Syslog FUDO |
Any |
filter: - query_string: query: “syslog_serverity:error” include: - fudo_message |
||
2 |
Fudo - Failed to authenticate using password |
fudo* |
http://download.wheelsystems.com/documentation/fudo/4_0/online_help/en/reference/en/log_messages.html |
Syslog FUDO |
Any |
filter: - query_string: query: “fudo_code:FSE0634” include: - fudo_user |
||
3 |
Fudo - Unable to establish connection |
fudo* |
http://download.wheelsystems.com/documentation/fudo/4_0/online_help/en/reference/en/log_messages.html |
Syslog FUDO |
Any |
filter: - query_string: query: “fudo_code:FSE0378” include: - fudo_connection - fudo_login |
||
4 |
Fudo - Authentication timeout |
fudo* |
http://download.wheelsystems.com/documentation/fudo/4_0/online_help/en/reference/en/log_messages.html |
Syslog FUDO |
Any |
filter: - query_string: query: “fudo_code:FUE0081” |
Squid SIEM Rules
| Nr. | Architecture/Application | Rule Name | Description | Index name | Requirements | Source | Rule type | Rule definition |
|---|---|---|---|---|---|---|---|---|
1 |
Squid |
Squid - Configuration file changed |
Modyfing squid.conf file |
syslog-* |
Audit module |
syslog |
any |
filter: - query_string: query: ‘message:”File /etc/squid/squid.conf checksum changed.”’ |
2 |
Squid |
Squid - Cannot open HTTP port |
Cannot open HTTP Port |
squid-* |
squid |
any |
filter: - query_string: query: ‘message:”Cannot open HTTP Port”’ |
|
3 |
Squid |
Squid - Unauthorized connection |
Unauthorized connection, blocked website entry |
squid-* |
squid |
any |
filter: - query_string: query: ‘squid_request_status:”TCP_DENIED/403”’ |
|
4 |
Squid |
Squid - Proxy server stopped |
Service stopped |
syslog-* |
syslog |
any |
filter: - query_string: query: ‘message:”Stopped Squid caching proxy.”’ |
|
5 |
Squid |
Squid - Proxy server started |
Service started |
syslog-* |
syslog |
any |
filter: - query_string: query: ‘message:”Started Squid caching proxy.”’ |
|
6 |
Squid |
Squid - Invalid request |
Invalid request |
squid-* |
squid |
any |
filter: - query_string: query: ‘squid_request_status:”error:invalid-request”’ |
McAfee SIEM Rules
| Nr. | Architecture/Application | Rule Name | Description | Index name | Requirements | Source | Rule type | Rule definition |
|---|---|---|---|---|---|---|---|---|
1 |
Squid |
Squid - Configuration file changed |
Modyfing squid.conf file |
syslog-* |
Audit module |
syslog |
any |
filter: - query_string: query: ‘message:”File /etc/squid/squid.conf checksum changed.”’ |
2 |
Squid |
Squid - Cannot open HTTP port |
Cannot open HTTP Port |
squid-* |
squid |
any |
filter: - query_string: query: ‘message:”Cannot open HTTP Port”’ |
|
3 |
Squid |
Squid - Unauthorized connection |
Unauthorized connection, blocked website entry |
squid-* |
squid |
any |
filter: - query_string: query: ‘squid_request_status:”TCP_DENIED/403”’ |
|
4 |
Squid |
Squid - Proxy server stopped |
Service stopped |
syslog-* |
syslog |
any |
filter: - query_string: query: ‘message:”Stopped Squid caching proxy.”’ |
|
5 |
Squid |
Squid - Proxy server started |
Service started |
syslog-* |
syslog |
any |
filter: - query_string: query: ‘message:”Started Squid caching proxy.”’ |
|
6 |
Squid |
Squid - Invalid request |
Invalid request |
squid-* |
squid |
any |
filter: - query_string: query: ‘squid_request_status:”error:invalid-request”’ |
Microsoft DNS Server SIEM Rules
| Nr. | Architecture/Application | Rule Name | Description | Index name | Requirements | Source | Rule type | Rule definition |
|---|---|---|---|---|---|---|---|---|
1. |
WINDOWS DNS |
WIN DNS - Format Error |
Format error; DNS server did not understand the update request |
prod-win-dns-* |
any |
timeframe: minutes: 15 filter: - term: dns.result: SERVFAIL |
||
2. |
WINDOWS DNS |
WIN DNS - DNS server internal error |
DNS server encountered an internal error, such as a forwarding timeout |
prod-win-dns-* |
any |
timeframe: - minutes: 15 filter: - term: dns.result: FORMERR |
||
3. |
WINDOWS DNS |
WIN DNS - DNS refuses to perform the update |
DNS server refuses to perform the update |
prod-win-dns-* |
any |
“timeframe: - minutes: 15 filter: - term: dns.result: REFUSED |
||
4. |
WINDOWS DNS |
WIN DNS - DNS Zone Deleted |
DNS Zone delete |
prod-win-dns-* |
any |
timeframe: minutes: 15 filter: - term: event.id: 513 |
||
5. |
WINDOWS DNS |
WIN DNS - DNS Record Deleted |
DNS Record Delete |
prod-win-dns-* |
any |
timeframe: minutes: 15 filter: - term: event.id: 516 |
||
6. |
WINDOWS DNS |
WIN DNS - DNS Node Deleted |
DNS Node Delete |
prod-win-dns-* |
any |
timeframe: minutes: 15 filter: - term: event.id: 518 |
||
7. |
WINDOWS DNS |
WIN DNS - DNS Remove Trust Point |
DNS Remove trust point |
prod-win-dns-* |
any |
timeframe: minutes: 15 filter: - term: event.id: 546 |
||
8. |
WINDOWS DNS |
WIN DNS - DNS Restart Server |
Restart Server |
prod-win-dns-* |
any |
timeframe: minutes: 15 filter: - term: event.id: 548 |
||
9. |
WINDOWS DNS |
WIN DNS - DNS Response failure |
Response Failure |
prod-win-dns-* |
frequency |
timeframe: minutes: 5 num_events: 20 filter: - term: event.id: 258 |
||
10. |
WINDOWS DNS |
WIN DNS - DNS Ignored Query |
Ignored Query |
prod-win-dns-* |
frequency |
timeframe: minutes: 5 num_events: 20 filter: - term: event.id: 259 |
||
11. |
WINDOWS DNS |
WIN DNS - DNS Recursive query timeout |
Recursive query timeout |
prod-win-dns-* |
frequency |
timeframe: minutes: 5 num_events: 20 filter: - term: event.id: 262 |
Microsoft DHCP SIEM Rules
| Nr. | Architecture/Application | Rule Name | Description | Index name | Requirements | Source | Rule type | Rule definition |
|---|---|---|---|---|---|---|---|---|
1 |
Windows DHCP |
MS DHCP low disk space |
The log was temporarily paused due to low disk space. |
prod-win-dhcp-* |
any |
timeframe: minutes: 15 filter: - term: dhcp.event.id: 02 |
||
2 |
Windows DHCP |
MS DHCP lease denied |
A lease was denied |
prod-win-dhcp-* |
frequency |
timeframe: minutes: 15 num_events: 10 filter: - terms: dhcp.event.id: [ “15”, “16” ] include: - dhcp.event.id - src.ip - src.mac - dhcp.event.descr summary_table_field: - src.ip - src.mac - dhcp.event.descr |
||
3 |
Windows DHCP |
MS DHCP update denied |
DNS update failed |
prod-win-dhcp-* |
frequency |
timeframe: minutes: 15 num_events: 50 filter: - term: dhcp.event.id: 31 |
||
4 |
Windows DHCP |
MS DHCP Data Corruption |
Detecting DHCP Jet Data Corruption |
prod-win-dhcp-* |
any |
timeframe: minutes: 15 filter: - term: dhcp.event.id: 1014 |
||
5 |
Windows DHCP |
MS DHCP service shutting down |
The DHCP service is shutting down due to the following error |
prod-win-dhcp-* |
any |
timeframe: minutes: 15 filter: - term: dhcp.event.id: 1008 |
||
6 |
Windows DHCP |
MS DHCP Service Failed to restore database |
The DHCP service failed to restore the database |
prod-win-dhcp-* |
any |
timeframe: minutes: 15 filter: - term: dhcp.event.id: 1018 |
||
7 |
Windows DHCP |
MS DHCP Service Failed to restore registry |
The DHCP service failed to restore the DHCP registry configuration |
prod-win-dhcp-* |
any |
timeframe: minutes: 15 filter: - term: dhcp.event.id: 1019 |
||
8 |
Windows DHCP |
MS DHCP Can not find domain |
The DHCP/BINL service on the local machine encountered an error while trying to find the domain of the local machine |
prod-win-dhcp-* |
frequency |
timeframe: minutes: 15 filter: - term: dhcp.event.id: 1049 |
||
9 |
Windows DHCP |
MS DHCP Network Failure |
The DHCP/BINL service on the local machine encountered a network error |
prod-win-dhcp-* |
frequency |
timeframe: minutes: 15 filter: - term: dhcp.event.id: 1050 |
||
10 |
Windows DHCP |
MS DHCP - There are no IP addresses available for lease |
There are no IP addresses available for lease in the scope or superscope |
prod-win-dhcp-* |
any |
timeframe: minutes: 15 filter: - term: dhcp.event.id: 1063 |
Linux DHCP Server SIEM Rules
| Nr. | Architecture/Application | Rule Name | Description | Index name | Requirements | Source | Rule type | Rule definition |
|---|---|---|---|---|---|---|---|---|
1 |
DHCP Linux |
DHCP Linux - Too many requests |
Too many DHCP requests |
syslog-* |
Linux DHCP Server / Syslog |
frequency |
query_key: “src_mac” num_events: 30 timeframe: minutes: 1 filter: - query_string: query: “DHCPREQUEST” use_count_query: true doc_type: doc |
|
2 |
DHCP Linux |
DHCP Linux - IP already assigned |
IP is already assigned to another client |
syslog-* |
Linux DHCP Server / Syslog |
any |
filter: - query_string: query: “DHCPNAK” |
|
3 |
DHCP Linux |
DHCP Linux - Discover flood |
DHCP Discover flood |
syslog-* |
Linux DHCP Server / Syslog |
frequency |
query_key: “src_mac” num_events: 30 timeframe: minutes: 1 filter: - query_string: query: “DHCPDISCOVER” use_count_query: true doc_type: doc |
Cisco VPN devices SIEM Rules
| Nr. | Architecture/Application | Rule Name | Description | Index name | Requirements | Source | Rule type | Rule definition |
|---|---|---|---|---|---|---|---|---|
1 |
Cisco IOS - Cisco VPN Concentrator |
CiscoVPN - VPN authentication failed |
Jan 8 09:10:37 vpn.example.com 11504 01/08/2007 09:10:37.780 SEV=3 AUTH/5 RPT=124 192.168.0.1 Authentication rejected: Reason = Unspecified handle = 805, server = auth.example.com, user = testuser, domain = <not specified> |
cisco* |
any |
filter: - query_string: query: “cisco.id:("AUTH\/5" OR "AUTH\/9" OR "IKE\/167" OR "PPP\/9" OR "SSH\/33" OR "PSH\/23")” |
||
2 |
Cisco IOS - Cisco VPN Concentrator |
CiscoVPN - VPN authentication successful |
jw. |
cisco* |
any |
filter: - query_string: query: “cisco.id:("IKE\/52")” |
||
3 |
Cisco IOS - Cisco VPN Concentrator |
CiscoVPN - VPN Admin authentication successful |
jw. |
cisco* |
any |
filter: - query_string: query: “cisco.id:("HTTP\/47" OR "SSH\/16")” |
||
4 |
Cisco IOS - Cisco VPN Concentrator |
CiscoVPN - Multiple VPN authentication failures |
jw. |
cisco* |
frequency |
query_key: “src.ip” num_events: 10 timeframe: minutes: 240 filter: - query_string: query: “cisco.id:("AUTH\/5" OR "AUTH\/9" OR "IKE\/167" OR "PPP\/9" OR "SSH\/33" OR "PSH\/23")” |
||
5 |
Cisco IOS - Cisco ASA |
Cisco ASA - VPN authentication failed |
jw. |
cisco* |
any |
filter: - query_string: query: “cisco.id:"\%ASA-6-113005"” |
||
6 |
Cisco IOS - Cisco ASA |
Cisco ASA - VPN authentication successful |
jw. |
cisco* |
any |
filter: - query_string: query: “cisco.id:"\%ASA-6-113004"” |
||
7 |
Cisco IOS - Cisco ASA |
Cisco ASA - VPN user locked out |
jw. |
cisco* |
any |
filter: - query_string: query: “cisco.id:"\%ASA-6-113006"” |
||
8 |
Cisco IOS - Cisco ASA |
Cisco ASA - Multiple VPN authentication failed |
jw. |
cisco* |
frequency |
query_key: “src.ip” num_events: 10 timeframe: minutes: 240 filter: - query_string: query: “cisco.id:"\%ASA-6-113005"” |
Netflow SIEM Rules
| Nr. | Architecture/Application | Rule Name | Description | Index name | Requirements | Source | Rule type | Rule definition |
|---|---|---|---|---|---|---|---|---|
1 |
Netflow - DNS traffic abnormal |
stream-* |
spike |
threshold_ref: 1000 spike_height: 4 spike_type: up timeframe: hours: 2 filter: - query: query_string: query: “netflow.dst.port:53” query_key: [netflow.src.ip] use_count_query: true doc_type: “doc” |
||||
2 |
Netflow - ICMP larger than 64b |
stream-* |
any |
filter: - query: query_string: query: “netflow.protocol: 1 AND netflow.packet_bytes:>64” query_key: “netflow.dst_addr” use_count_query: true doc_type: “doc” |
||||
3 |
Netflow - Port scan |
stream-* |
cardinality |
timeframe: minutes: 5 max_cardinality: 100 query_key: [netflow.src.ip, netflow.dst.ip] cardinality_field: “netflow.dst.port” filter: - query: query_string: query: “_exists_:(netflow.dst.ip AND netflow.src.ip) NOT netflow.dst.port: (443 OR 80)” aggregation: minutes: 5 aggregation_key: netflow.src.ip |
||||
4 |
Netflow - SMB traffic |
stream-* |
any |
filter: - query: query_string: query: “netflow.dst.port:(137 OR 138 OR 445 OR 139)” query_key: “netflow.src.ip” use_count_query: true doc_type: “doc” |
||||
5 |
Netflow - Too many req to port 161 |
stream-* |
frequency |
num_events: 60 timeframe: minutes: 1 filter: - query: query_string: query: “netflow.dst.port:161” query_key: “netflow.src.ip” use_count_query: true doc_type: “doc” |
||||
6 |
Netflow - Too many req to port 25 |
stream-* |
frequency |
num_events: 60 timeframe: minutes: 1 filter: - query: query_string: query: “netflow.dst.port:25” query_key: “netflow.src.ip” use_count_query: true doc_type: “doc” |
||||
7 |
Netflow - Too many req to port 53 |
stream-* |
frequency |
num_events: 120 timeframe: minutes: 1 filter: - query: query_string: query: “netflow.dst.port:53” query_key: “netflow.src.ip” use_count_query: true doc_type: “doc” |
||||
8 |
Netflow – Multiple connections from source badip |
stream-* |
frequency |
num_events: 10 timeframe: minutes: 5 filter: - query: query_string: query: “netflow.src.badip:true” query_key: “netflow.src.ip” use_count_query: true doc_type: “doc” |
||||
9 |
Netflow – Multiple connections to destination badip |
stream-* |
frequency |
num_events: 10 timeframe: minutes: 5 filter: - query: query_string: query: “netflow.dst.badip:true” query_key: “netflow.dst.ip” use_count_query: true doc_type: “doc” |
MikroTik devices SIEM Rules
| Nr. | Architecture/Application | Rule Name | Description | Index name | Requirements | Source | Rule type | Rule definition |
|---|---|---|---|---|---|---|---|---|
1 |
All system errors |
any |
alert_text_type: alert_text_only alert_text: “System error\n\n When: {}\n Device IP: {}\n From: {}\n\n{}\n” alert_text_args: - timestamp_timezone - host - login.ip - kibana_link use_kibana4_dashboard: “link do saved search” kibana4_start_timedelta: minutes: 5 kibana4_end_timedelta: minutes: 0 filter: - query_string: query: “topic2:error and topic3:critical” |
|||||
2 |
All errors connected with logins to the administrative interface of the device eg wrong password or wrong login name |
any |
alert_text_type: alert_text_only alert_text: “Login error\n\n When: {}\n Device IP: {}\n From: {}\n by: {}\n to account: {}\n\n{}\n” alert_text_args: - timestamp_timezone - host - login.ip - login.method - user - kibana_link use_kibana4_dashboard: “link do saved search” kibana4_start_timedelta: minutes: 5 kibana4_end_timedelta: minutes: 0 filter: - query_string: query: “topic2:error and topic3:critical and login.status:login failure” |
|||||
3 |
All errors connected with wireless eg device is banned on access list, or device had poor signal on AP and was disconected |
any |
alert_text_type: alert_text_only alert_text: “Wifi auth issue\n\n When: {}\n Device IP: {}\n Interface: {}\n MAC: {}\n ACL info: {}\n\n{}\n” alert_text_args: - timestamp_timezone - host - interface - wlan.mac - wlan.ACL - kibana_link use_kibana4_dashboard: “link do saved search” kibana4_start_timedelta: minutes: 5 kibana4_end_timedelta: minutes: 0 filter: - query_string: query: “wlan.status:reject or wlan.action:banned” |
|||||
4 |
Dhcp offering fail |
any |
alert_text_type: alert_text_only alert_text: “Dhcp offering fail\n\n When: {}\n Client lease: {}\n for MAC: {}\n to MAC: {}\n\n{}\n” alert_text_args: - timestamp_timezone - dhcp.ip - dhcp.mac - dhcp.mac2 - kibana_link use_kibana4_dashboard: “link do saved search” kibana4_start_timedelta: minutes: 5 kibana4_end_timedelta: minutes: 0 filter: - query_string: query: “dhcp.status:without success” |
Microsoft SQL Server SIEM Rules
| Nr. | Architecture/Application | Rule Name | Description | Index name | Requirements | Source | Rule type | Rule definition |
|---|---|---|---|---|---|---|---|---|
1 |
Logon errors, alert any |
Rule definition alert_text_type: alert_text_only alert_text: “Logon error\n\n When: {}\n Error code: {}\n Severity: {}\n\n{}\n” alert_text_args: - timestamp_timezone - mssql.error.code - mssql.error.severity - kibana_link use_kibana4_dashboard: “link do saved search” kibana4_start_timedelta: minutes: 5 kibana4_end_timedelta: minutes: 0 filter: - query_string: query: “mssql.error.code:* and mssql.error.severity:*” |
||||||
2 |
Login failed for users, alert any |
alert_text_type: alert_text_only alert_text: “Login failed\n\n When: {}\n User login: {}\n Reason: {}\n Client: {}\n\n{}\n” alert_text_args: - timestamp_timezone - mssql.login.user - mssql.error.reason - mssql.error.client - kibana_link use_kibana4_dashboard: “link do saved search” kibana4_start_timedelta: minutes: 5 kibana4_end_timedelta: minutes: 0 filter: - query_string: query: “mssql.login.status:failed and mssql.login.user:*” |
||||||
3 |
server is going down, alert any |
alert_text_type: alert_text_only alert_text: “Server is going down\n\n When: {}\n\n{}\n” alert_text_args: - timestamp_timezone - kibana_link use_kibana4_dashboard: “link do saved search” kibana4_start_timedelta: minutes: 5 kibana4_end_timedelta: minutes: 0 filter: - query_string: query: “mssql.server.status:shutdown” |
||||||
4 |
NET stopped, alert any |
alert_text_type: alert_text_only alert_text: “NET Framework runtime has been stopped.\n\n When: {}\n\n{}\n” alert_text_args: - timestamp_timezone - kibana_link use_kibana4_dashboard: “link do saved search” kibana4_start_timedelta: minutes: 5 kibana4_end_timedelta: minutes: 0 filter: - query_string: query: “mssql.net.status:stopped” |
||||||
5 |
Database Mirroring stopped, alert any |
alert_text_type: alert_text_only alert_text: “Database Mirroring endpoint is in stopped state.\n\n When: {}\n\n{}\n” alert_text_args: - timestamp_timezone - kibana_link use_kibana4_dashboard: “link do saved search” kibana4_start_timedelta: minutes: 5 kibana4_end_timedelta: minutes: 0 filter: - query_string: query: “mssql.db.status:stopped” |
Postgress SQL SIEM Rules
Nr. |
Architecture/Application |
Rule Name |
Description |
Index name |
Requirements |
Source |
Rule type |
Rule definition |
1 |
PostgreSQL |
PostgresSQL - New user created |
postgres-* |
Filebeat, Logstash, PostgreSQL |
pg_log |
any |
filter: - query_string: query: ‘message:”LOG: CREATE USER”’ |
|
2 |
PostgreSQL |
PostgresSQL - User selected database |
postgres-* |
Filebeat, Logstash, PostgreSQL |
pg_log |
any |
filter: - query_string: query: ‘message:”LOG: SELECT d.datname FROM pg_catalog.pg_database”’ |
|
3 |
PostgreSQL |
PostgresSQL - User password changed |
postgres-* |
Filebeat, Logstash, PostgreSQL |
pg_log |
any |
filter: - query_string: query: ‘message:”ALTER USER WITH PASSWORD”’ |
|
4 |
PostgreSQL |
PostgreSQL - Multiple authentication failures |
postgres-* |
Filebeat, Logstash, PostgreSQL |
pg_log |
frequency |
query_key: “src_ip” num_events: 5 timeframe: seconds: 25 filter: - query_string: query: ‘message:”FATAL: password authentication failed for user”’ use_count_query: true doc_type: doc |
|
5 |
PostgreSQL |
PostgreSQL - Granted all privileges to user |
postgres-* |
Filebeat, Logstash, PostgreSQL |
pg_log |
any |
filter: - query_string: query: ‘message:”LOG: GRANT ALL PRIVILEGES ON”’ |
|
6 |
PostgreSQL |
PostgresSQL - User displayed users table |
User displayed users table |
postgres-* |
Filebeat, Logstash, PostgreSQL |
pg_log |
any |
filter: - query_string: query: ‘message:”LOG: SELECT r.rolname FROM pg_catalog.pg_roles”’ |
7 |
PostgreSQL |
PostgresSQL - New database created |
postgres-* |
Filebeat, Logstash, PostgreSQL |
pg_log |
any |
filter: - query_string: query: ‘message:”LOG: CREATE DATABASE”’ |
|
8 |
PostgreSQL |
PostgresSQL - Database shutdown |
postgres-* |
Filebeat, Logstash, PostgreSQL |
pg_log |
any |
filter: - query_string: query: ‘message:”LOG: database system was shut down at”’ |
|
9 |
PostgreSQL |
PostgresSQL - New role created |
postgres-* |
Filebeat, Logstash, PostgreSQL |
pg_log |
any |
filter: - query_string: query: ‘message:”LOG: CREATE ROLE”’ |
|
10 |
PostgreSQL |
PostgresSQL - User deleted |
postgres-* |
Filebeat, Logstash, PostgreSQL |
pg_log |
any |
filter: - query_string: query: ‘message:”LOG: DROP USER”’ |
MySQL SIEM Rules
| Nr. | Architecture/Application | Rule Name | Description | Index name | Requirements | Source | Rule type | Rule definition |
|---|---|---|---|---|---|---|---|---|
1 |
MySQL |
MySQL - User created |
mysql-* |
Filebeat, Logstash, MySQL |
mysql-general.log |
any |
filter: - query_string: query: ‘message:”CREATE USER”’ |
|
2 |
MySQL |
MySQL - User selected database |
mysql-* |
Filebeat, Logstash, MySQL |
mysql-general.log |
any |
filter: - query_string: query: ‘message:”Query show databases”’ |
|
3 |
MySQL |
MySQL - Table dropped |
mysql-* |
Filebeat, Logstash, MySQL |
mysql-general.log |
any |
filter: - query_string: query: ‘message:”Query drop table”’ |
|
4 |
MySQL |
MySQL - User password changed |
mysql-* |
Filebeat, Logstash, MySQL |
mysql-general.log |
any |
filter: - query_string: query: ‘message:”UPDATE mysql.user SET Password=PASSWORD” OR message:”SET PASSWORD FOR” OR message:”ALTER USER”’ |
|
5 |
MySQL |
MySQL - Multiple authentication failures |
mysql-* |
Filebeat, Logstash, MySQL |
mysql-general.log |
frequency |
query_key: “src_ip” num_events: 5 timeframe: seconds: 25 filter: - query_string: query: ‘message:”Access denied for user”’ use_count_query: true doc_type: doc |
|
6 |
MySQL |
MySQL - All priviliges to user granted |
mysql-* |
Filebeat, Logstash, MySQL |
mysql-general.log |
any |
filter: - query_string: query: ‘message:”GRANT ALL PRIVILEGES ON”’ |
|
7 |
MySQL |
MySQL - User displayed users table |
User displayed users table |
mysql-* |
Filebeat, Logstash, MySQL |
mysql-general.log |
any |
filter: - query_string: query: ‘message:”Query select * from user”’ |
8 |
MySQL |
MySQL - New database created |
mysql-* |
Filebeat, Logstash, MySQL |
mysql-general.log |
any |
filter: - query_string: query: ‘message:”Query create database”’ |
|
9 |
MySQL |
MySQL - New table created |
mysql-* |
Filebeat, Logstash, MySQL |
mysql-general.log |
any |
filter: - query_string: query: ‘message:”Query create table”’ |
Incident detection and mitigation time
The Energy Logserver allows you to keep track of the time and actions taken in the incident you created.
A detected alert incident has the date the incident occurred match_body.@timestamp and the date and time the incident was detected alert.time.
In addition, it is possible to enrich the alert event with the date and time of incident resolution alert_solvedtime using the following pipeline:
  input {
      elasticsearch {
          hosts => "http://localhost:9200"
          user => logserver
          password => logserver
          index => "alert*"
          size => 500
          scroll => "5m"
          docinfo => true
          schedule => "*/5 * * * *"
          query => '{ "query": {     "bool": {
        "must": [
          {
            "match_all": {}
          }
        ],
        "filter": [
          {
            "match_phrase": {
              "alert_info.status": {
                "query": "solved"
              }
            }
          }
        ],
        "should": [],
        "must_not": [{
            "exists": {
              "field": "alert_solvedtime"
            }
          }]
      }
  }, "sort": [ "_doc" ] }'
      }
  }
  filter {
          ruby {
                  code => "event.set('alert_solvedtime', Time.now());"
          }
  }
  output {
      elasticsearch {
          hosts => "http://localhost:9200"
          user => logserver
          password => logserver
          action => "update"
          document_id => "%{[@metadata][_id]}"
          index => "%{[@metadata][_index]}"
      }
  }
Adding a tag to an existing alert
We can add a tag to an existing alert using the dev tools. You can use belowe code.
POST alert/_update/example_document_id
{
  "doc": {
    "tags":"example"
  }
}

You can get the corresponding document id in the discovery section.

Siem Module
Energy Logserver, through its built-in vulnerability detection module use of best practices defined in the CIS, allows to audit monitored environment for security vulnerabilities, misconfigurations, or outdated software versions. File Integrity Monitoring functionality allows for detailed monitoring and alerting of unauthorized access attempts to most sensitive data.
SIEM Plan is a solution that provides a ready-made set of tools for compliance regulations such as CIS, PCI DSS, GDPR, NIST 800-53, ISO 27001.The system enables mapping of detected threats to Mitre ATT&CK tactics. By integrating with the MISP Energy Logserver, allows to get real-time information about new threats on the network by downloading the latest IoC lists.
To configure the SIEM agents see the Configuration section.
Active response
The SIEM agent automates the response to threats by running actions when these are detected. The agent has the ability to block network connections, stop running processes, and delete malicious files, among other actions. In addition, it can also run customized scripts developed by the user (e.g., Python, Bash, or PowerShell).
To use this feature, users define the conditions that trigger the scripted actions, which usually involve threat detection and assessment. For example, a user can use log analysis rules to detect an intrusion attempt and an IP address reputation database to assess the threat by looking for the source IP address of the attempted connection.
In the scenario described above, when the source IP address is recognized as malicious (low reputation), the monitored system is protected by automatically setting up a firewall rule to drop all traffic from the attacker. Depending on the active response, this firewall rule is temporary or permanent.
On Linux systems, the Wazuh agent usually integrates with the local Iptables firewall for this purpose. On Windows systems, instead, it uses the null routing technique (also known as blackholing). Below you can find the configuration to define two scripts that are used for automated connection blocking:
    <command>
      <name>firewall-drop</name>
      <executable>firewall-drop</executable>
      <timeout_allowed>yes</timeout_allowed>
    </command>
    <command>
      <name>win_route-null</name>
      <executable>route-null.exe</executable>
      <timeout_allowed>yes</timeout_allowed>
    </command>
On top of the defined commands, active responses set the conditions that need to be met to trigger them. Below is an example of a configuration that triggers the firewall-drop command when the log analysis rule 100100 is matched.
    <active-response>
      <command>firewall-drop</command>
      <location>local</location>
      <rules_id>100100</rules_id>
      <timeout>60</timeout>
    </active-response>
In this case, rule 100100 is used to look for alerts where the source IP address is part of a well-known IP address reputation database.
   <rule id="100100" level="10">
     <if_group>web|attack|attacks</if_group>
     <list field="srcip" lookup="address_match_key">etc/lists/blacklist-alienvault</list>
     <description>IP address found in AlienVault reputation database.</description>
   </rule>
Below you can find a screenshot with two SIEM alerts: one that is triggered when a web attack is detected trying to exploit a PHP server vulnerability, and one that informs that the malicious actor has been blocked.
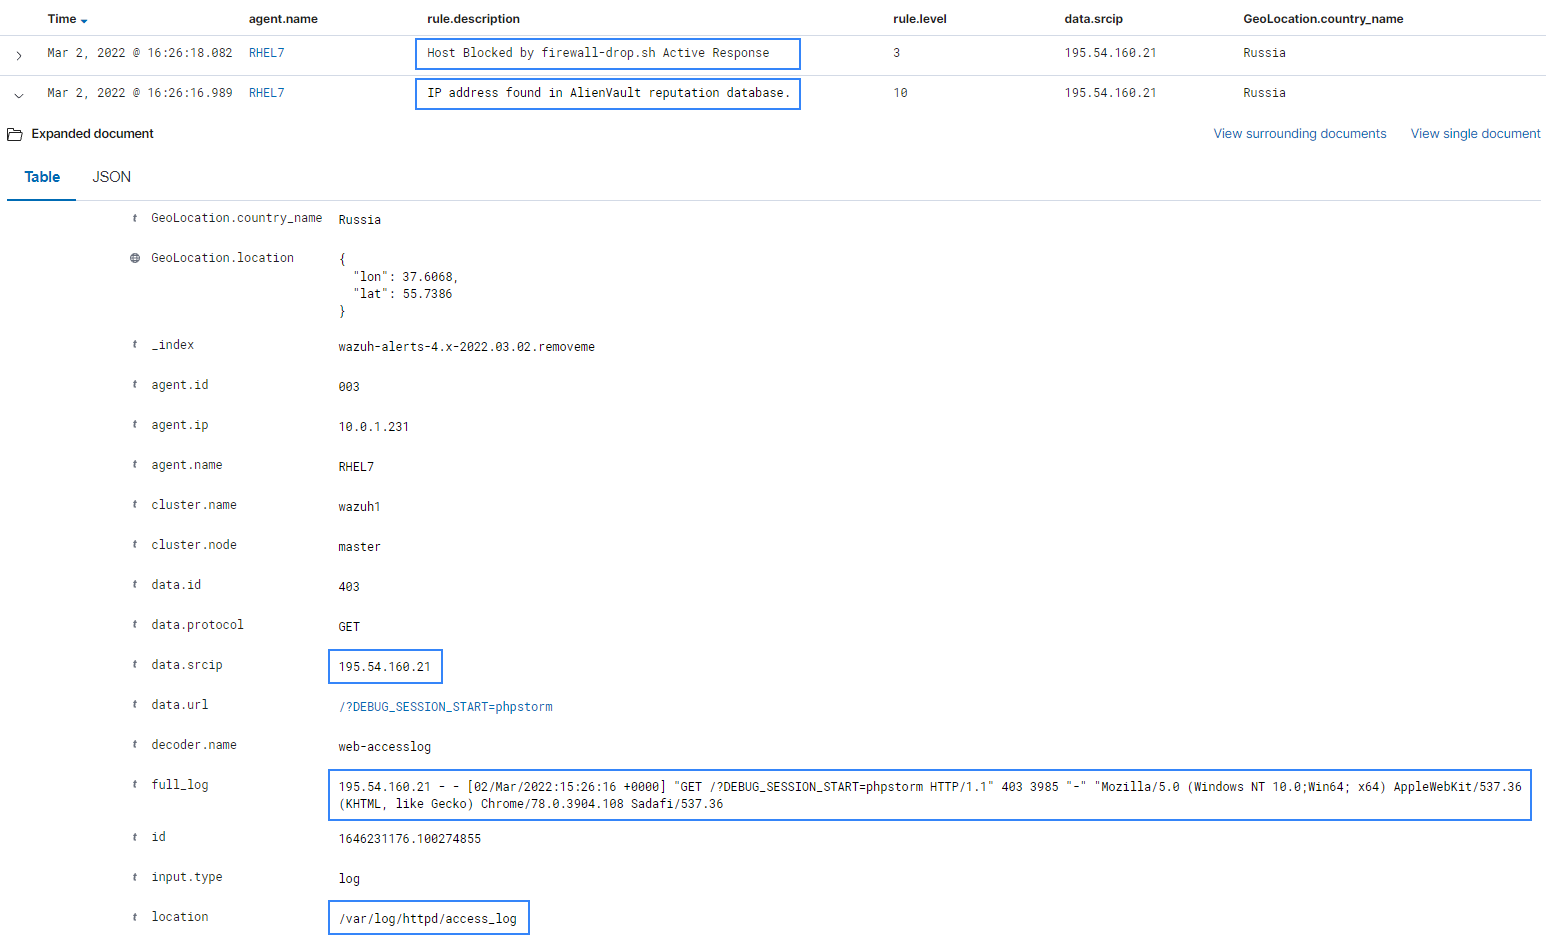
Log data collection
Log data collection is the real-time process of making sense out of the records generated by servers or devices. This component can receive logs through text files or Windows event logs. It can also directly receive logs via remote syslog which is useful for firewalls and other such devices.
The purpose of this process is the identification of application or system errors, mis-configurations, intrusion attempts, policy violations or security issues.
The memory and CPU requirements of the SIEM agent are insignificant since its primary duty is to forward events to the manager. However, on the SIEM manager, CPU and memory consumption can increase rapidly depending on the events per second (EPS) that the manager has to analyze.
How it works
Log files The Log analysis engine can be configured to monitor specific files on the servers.
Linux:
<localfile>
  <location>/var/log/example.log</location>
  <log_format>syslog</log_format>
</localfile>
Windows:
<localfile>
  <location>C:\myapp\example.log</location>
  <log_format>syslog</log_format>
</localfile>
Windows event logs Wazuh can monitor classic Windows event logs, as well as the newer Windows event channels. Event log:
<localfile>
  <location>Security</location>
  <log_format>eventlog</log_format>
</localfile>
Event channel:
<localfile>
  <location>Microsoft-Windows-PrintService/Operational</location>
  <log_format>eventchannel</log_format>
</localfile>
Remote syslog In order to integrate network devices such as routers, firewalls, etc, the log analysis component can be configured to receive log events through syslog. To do that we have two methods available:
One option is for SIEM to receive syslog logs by a custom port:
<ossec_config>
  <remote>
    <connection>syslog</connection>
    <port>513</port>
    <protocol>udp</protocol>
    <allowed-ips>192.168.2.0/24</allowed-ips>
  </remote>
</ossec_config>
<connection>syslog</connection> indicates that the manager will accept incoming syslog messages from across the network.
<port>513</port> defines the port that Wazuh will listen to retrieve the logs. The port must be free.
<protocol>udp</protocol> defines the protocol to listen the port. It can be UDP or TCP.
<allowed-ips>192.168.2.0/24</allowed-ips>defines the network or IP from which syslog messages will be accepted.
The other option store the logs in a plaintext file and monitor that file with SIEM. If a /etc/rsyslog.conf configuration file is being used and we have defined where to store the syslog logs we can monitor them in SIEM ossec.conf using a <localfile> block with syslog as the log format.
<localfile>
  <log_format>syslog</log_format>
  <location>/custom/file/path</location>
</localfile>
<log_format>syslog</log_format> indicates the source log format, in this case, syslog format.
<location>/custom/file/path</location> indicates where we have stored the syslog logs.
Analysis Pre-decoding
In the pre-decoding phase of analysis, static information from well-known fields all that is extracted from the log header.
Feb 14 12:19:04 localhost sshd[25474]: Accepted password for rromero from 192.168.1.133 port 49765 ssh2
Extracted information:
- hostname: ‘localhost’
- program_name: ‘sshd’
Decoding
In the decoding phase, the log message is evaluated to identify what type of log it is and known fields for that specific log type are then extracted. Sample log and its extracted info:
Feb 14 12:19:04 localhost sshd[25474]: Accepted password for rromero from 192.168.1.133 port 49765 ssh2
Extracted information:
- program name: sshd
- dstuser: rromero
- srcip: 192.168.1.133
Rule matching In the next phase, the extracted log information is compared to the ruleset to look for matches: For the previous example, rule 5715 is matched:
<rule id="5715" level="3">
  <if_sid>5700</if_sid>
  <match>^Accepted|authenticated.$</match>
  <description>sshd: authentication success.</description>
  <group>authentication_success,pci_dss_10.2.5,</group>
</rule>
Alert Once a rule is matched, the manager will create an alert as below:
** Alert 1487103546.21448: - syslog,sshd,authentication_success,pci_dss_10.2.5,
2017 Feb 14 12:19:06 localhost->/var/log/secure
Rule: 5715 (level 3) -> 'sshd: authentication success.'
Src IP: 192.168.1.133
User: rromero
Feb 14 12:19:04 localhost sshd[25474]: Accepted password for rromero from 192.168.1.133 port 49765 ssh2
By default, alerts will be generated on events that are important or of security relevance. To store all events even if they do not match a rule, enable the <logall> option.
Alerts will be stored at /var/ossec/logs/alerts/alerts.(json|log) and events at /var/ossec/logs/archives/archives.(json|log). Logs are rotated and an individual directory is created for each month and year.
How to collect Windows logs
Windows events can be gathered and forwarded to the manager, where they are processed and alerted if they match any rule. There are two formats to collect Windows logs:
- Eventlog (supported by every Windows version)
- Eventchannel (for Windows Vista and later versions)
Windows logs are descriptive messages which come with relevant information about events that occur in the system. They are collected and shown at the Event Viewer, where they are classified by the source that generated them.
This information is gathered by the Windows agent, including the event description, the system standard fields and the specific eventdata information from the event. Once an event is sent to the manager, it is processed and translated to JSON format, which leads to an easier way of querying and filtering the event fields.
Eventlog uses as well the Windows API to obtain events from Windows logs and return the information in a specific format.
Windows Eventlog vs Windows Eventchannel Eventlog is supported on every Windows version and can monitor any logs except for particular Applications and Services Logs, this means that the information that can be retrieved is reduced to System, Application and Security channels. On the other hand, Eventchannel is maintained since Windows Vista and can monitor the Application and Services logs along with the basic Windows logs. In addition, the use of queries to filter by any field is supported for this log format.
Monitor the Windows Event Log with Wazuh To monitor a Windows event log, it is necessary to provide the format as “eventlog” and the location as the name of the event log.
<localfile>
    <location>Security</location>
    <log_format>eventlog</log_format>
</localfile>
These logs are obtained through Windows API calls and sent to the manager where they will be alerted if they match any rule.
Monitor the Windows Event Channel with Wazuh Windows event channels can be monitored by placing their name at the location field from the localfile block and “eventchannel” as the log format.
<localfile>
    <location>Microsoft-Windows-PrintService/Operational</location>
    <log_format>eventchannel</log_format>
</localfile>
Available channels and providers Table below shows available channels and providers to monitor included in the Wazuh ruleset:
| Nr. | Source | Channel location | Provider name | Description |
|---|---|---|---|---|
1 |
Application |
Application |
Any |
This log retrieves every event related to system applications management and is one of the main Windows administrative channels along with Security and System. |
2 |
Security |
Security |
Any |
This channel gathers information related to users and groups creation, login, logoff and audit policy modifications. |
3 |
System |
System |
Any |
The System channel collects events associated with kernel and service control. |
4 |
Sysmon |
Microsoft-Windows-Sysmon/Operational |
Microsoft-Windows-Sysmon |
Sysmon monitors system activity as process creation and termination, network connection and file changes. |
5 |
Windows Defender |
Microsoft-Windows-Windows Defender/Operational |
Microsoft-Windows-Windows Defender |
The Windows Defender log file shows information about the scans passed, malware detection and actions taken against them. |
6 |
McAfee |
Application |
McLogEvent |
This source shows McAfee scan results, virus detection and actions taken against them. |
7 |
EventLog |
System |
Eventlog |
This source retrieves information about audit and Windows logs. |
8 |
Microsoft Security Essentials |
System |
Microsoft Antimalware |
This software gives information about real-time protection for the system, malware-detection scans and antivirus settings. |
9 |
Remote Access |
File Replication Service |
Any |
Other channels (they are grouped in a generic Windows rule file). |
10 |
Terminal Services |
Service Microsoft-Windows-TerminalServices-RemoteConnectionManager |
Any |
Other channels (they are grouped in a generic Windows rule file). |
When monitoring a channel, events from different providers can be gathered. At the ruleset this is taken into account to monitor logs from McAfee, Eventlog or Security Essentials.
Windows ruleset redesign
In order to ease the addition of new rules, the eventchannel ruleset has been classified according to the channel from which events belong. This will ensure an easier way of maintaining the ruleset organized and find the better place for custom rules. To accomplish this, several modifications have been added:
- Each eventchannel file contains a specific channel’s rules.
- A base file includes every parent rule filtering by the specific channels monitored.
- Rules have been updated and improved to match the new JSON events, showing relevant information at the rule’s description and facilitating the way of filtering them.
- New channel’s rules have been added. By default, the monitored channels are System, Security and Application, these channels have their own file now and include a fair set of rules.
- Every file has their own rule ID range in order to get it organized. There are a hundred IDs set for the base rules and five hundred for each channel file.
- In case some rules can’t be classified easily or there are so few belonging to a specific channel, they are included at a generic Windows rule file.
To have a complete view of which events are equivalent to the old ones from eventlog and the previous version of eventchannel, this table classifies every rule according to the source in which they were recorded, including their range of rule IDs and the file where they are described.
| Nr. | Source | Rule IDs | Rule file |
|---|---|---|---|
1 |
Base rules |
60000 - 60099 |
0575-win-base_rules.xml |
2 |
Security |
60100 - 60599 |
0580-win-security_rules.xml |
3 |
Application |
60600 - 61099 |
0585-win-application_rules.xml |
4 |
System |
61100 - 61599 |
0590-win-system_rules.xml |
5 |
Sysmon |
61600 - 62099 |
0595-win-sysmon_rules.xml |
6 |
Windows Defender |
62100 - 62599 |
0600-win-wdefender_rules.xml |
7 |
McAfee |
62600 - 63099 |
0605-win-mcafee_rules.xml |
8 |
Eventlog |
63100 - 63599 |
0610-win-ms_logs_rules.xml |
9 |
Microsoft Security Essentials |
63600 - 64099 |
0615-win-ms-se_rules.xml |
10 |
Others |
64100 - 64599 |
0620-win-generic_rules.xml |
Configuration
Basic usage
Log data collection is configured in the ossec.conf file primarily in the localfile, remote and global sections. Configuration of log data collection can also be completed in the agent.conf file to centralize the distribution of these configuration settings to relevant agents.
As in this basic usage example, provide the name of the file to be monitored and the format:
<localfile>
  <location>/var/log/messages</location>
  <log_format>syslog</log_format>
</localfile>
Monitoring logs using wildcard patterns for file names
Wazuh supports posix wildcard patterns, just like listing files in a terminal. For example, to analyze every file that ends with a .log inside the /var/log directory, use the following configuration:
<localfile>
    <location>/var/log/*.log</location>
    <log_format>syslog</log_format>
</localfile>
Monitoring date-based logs
For log files that change according to the date, you can also specify a strftime format to replace the day, month, year, etc. For example, to monitor the log files like C:\Windows\app\log-08-12-15.log, where 08 is the year, 12 is the month and 15 the day (and it is rolled over every day), configuration is as follows:
<localfile>
    <location>C:\Windows\app\log-%y-%m-%d.log</location>
    <log_format>syslog</log_format>
</localfile>
Using environment variables
Environment variables like %WinDir% can be used in the location pattern. The following is an example of reading logs from an IIS server:
<localfile>
    <location>%SystemDrive%\inetpub\logs\LogFiles\W3SVC1\u_ex%y%m%d.log</location>
    <log_format>iis</log_format>
</localfile>
Using multiple outputs
Log data is sent to the agent socket by default, but it is also possible to specify other sockets as output. ossec-logcollector uses UNIX type sockets to communicate allowing TCP or UDP protocols.
To add a new output socket we need to specify it using the tag <socket> as shown in the following example configuration:
<socket>
    <name>custom_socket</name>
    <location>/var/run/custom.sock</location>
    <mode>tcp</mode>
    <prefix>custom_syslog: </prefix>
</socket>

<socket>
    <name>test_socket</name>
    <location>/var/run/test.sock</location>
</socket>
Once the socket is defined, it’s possible to add the destination socket for each localfile:
<localfile>
    <log_format>syslog</log_format>
    <location>/var/log/messages</location>
    <target>agent,test_socket</target>
</localfile>

<localfile>
    <log_format>syslog</log_format>
    <location>/var/log/messages</location>
    <target>custom_socket,test_socket</target>
</localfile>
File integrity monitoring
How it works
The FIM module is located in the SIEM agent, where runs periodic scans of the system and stores the checksums and attributes of the monitored files and Windows registry keys in a local FIM database. The module looks for the modifications by comparing the new files’ checksums to the old checksums. All detected changes are reported to the SIEM manager.
The new FIM synchronization mechanism ensures the file inventory in the SIEM manager is always updated with respect to the SIEM agent, allowing servicing FIM-related API queries regarding the Wazuh agents. The FIM synchronization is based on periodic calculations of integrity between the SIEM agent’s and the SIEM manager’s databases, updating in the SIEM manager only those files that are outdated, optimizing the data transfer of FIM. Anytime the modifications are detected in the monitored files and/or registry keys, an alert is generated.
By default, each SIEM agent has the syscheck enabled and preconfigured but it is recommended to review and amend the configuration of the monitored host.
File integrity monitoring results for the whole environment can be observed in Energylogserver app in the SIEM > Overview > Integrity monitoring:

Configuration
Syscheck component is configured both in the SIEM manager’s and in the SIEM agent’s ossec.conf file. This capability can be also configured remotely using centralized configuration and the agent.conf file. The list of all syscheck configuration options is available in the syscheck section.
Configuring syscheck - basic usage
To configure syscheck, a list of files and directories must be identified. The check_all attribute of the directories option allows checks of the file size, permissions, owner, last modification date, inode and all the hash sums (MD5, SHA1 and SHA256). By default, syscheck scans selected directories, whose list depends on the default configuration for the host’s operating system.
<syscheck>
  <directories check_all="yes">/etc,/usr/bin,/usr/sbin</directories>
  <directories check_all="yes">/root/users.txt,/bsd,/root/db.html</directories>
</syscheck>
It is possible to hot-swap the monitored directories. This can be done for Linux, in both the SIEM agent and the SIEM manager, by setting the monitoring of symbolic links to directories. To set the refresh interval, use syscheck.symlink_scan_interval option found in the internal configuration of the monitored SIEM agent.
Once, the directory path is removed from the syscheck configuration and the SIEM agent is being restarted, the data from the previously monitored path is no longer stored in the FIM database.
Configuring scan time By default, syscheck scans when the SIEM starts, however, this behavior can be changed with the scan_on_start option.
For the schedluled scans, syscheck has an option to configure the frequency of the system scans. In this example, syscheck is configured to run every 10 hours:
<syscheck>
  <frequency>36000</frequency>
  <directories>/etc,/usr/bin,/usr/sbin</directories>
  <directories>/bin,/sbin</directories>
</syscheck>
There is an alternative way to schedule the scans using the scan_time and the scan_day options. In this example, the scan will run every Saturday at the 10pm. Configuring syscheck that way might help, for example, to set up the scans outside the environment production hours:
<syscheck>
  <scan_time>10pm</scan_time>
  <scan_day>saturday</scan_day>
  <directories>/etc,/usr/bin,/usr/sbin</directories>
  <directories>/bin,/sbin</directories>
</syscheck>
Configuring real-time monitoring
Real-time monitoring is configured with the realtime attribute of the directories option. This attribute only works with the directories rather than with the individual files. Real-time change detection is paused during periodic syscheck scans and reactivates as soon as these scans are complete:
<syscheck>
  <directories check_all="yes" realtime="yes">c:/tmp</directories>
</syscheck>
Configuring who-data monitoring
Who-data monitoring is configured with the whodata attribute of the directories option. This attribute replaces the realtime attribute, which means that whodata implies real-time monitoring but adding the who-data information. This functionality uses Linux Audit subsystem and the Microsoft Windows SACL, so additional configurations might be necessary. Check the auditing who-data entry to get further information:
<syscheck>
  <directories check_all="yes" whodata="yes">/etc</directories>
</syscheck>
Configuring reporting new files To report new files added to the system, syscheck can be configured with the alert_new_files option. By default, this feature is enabled on the monitored SIEM agent, but the option is not present in the syscheck section of the configuration:
<syscheck>
  <alert_new_files>yes</alert_new_files>
</syscheck>
Configuring reporting file changes
To report the exact content that has been changed in a text file, syscheck can be configured with the report_changes attribute of the directories option. Report_changes should be used with caution as Wazuh copies every single monitored file to a private location.
<syscheck>
  <directories check_all="yes" realtime="yes" report_changes="yes">/test</directories>
</syscheck>
If some sentive files exist in the monitored with report_changes path, nodiff option can be used. This option disables computing the diff for the listed files, avoiding data leaking by sending the files content changes through alerts:
<syscheck>
  <directories check_all="yes" realtime="yes" report_changes="yes">/test</directories>
  <nodiff>/test/private</nodiff>
</syscheck>
Configuring ignoring files and Windows registry entries
In order to avoid false positives, syscheck can be configured to ignore certain files and directories that do not need to be monitored by using the ignore option:
<syscheck>
  <ignore>/etc/random-seed</ignore>
  <ignore>/root/dir</ignore>
  <ignore type="sregex">.log$|.tmp</ignore>
</syscheck>
Similar functionality, but for the Windows registries can be achieved by using the registry_ignore option:
<syscheck>
 <registry_ignore>HKEY_LOCAL_MACHINE\Security\Policy\Secrets</registry_ignore>
 <registry_ignore type="sregex">\Enum$</registry_ignore>
</syscheck>
Configuring ignoring files via rules An alternative method to ignore specific files scanned by syscheck is by using rules and setting the rule level to 0. By doing that the alert will be silenced:
<rule id="100345" level="0">
  <if_group>syscheck</if_group>
  <match>/var/www/htdocs</match>
  <description>Ignore changes to /var/www/htdocs</description>
</rule>
Configuring the alert severity for the monitored files With a custom rule, the level of a syscheck alert can be altered when changes to a specific file or file pattern are detected:
<rule id="100345" level="12">
  <if_group>syscheck</if_group>
  <match>/var/www/htdocs</match>
  <description>Changes to /var/www/htdocs - Critical file!</description>
</rule>
Configuring maximum recursion level allowed It is possible to configure the maximum recursion level allowed for a specific directory by using the recursion_level attribute of the directories option. recursion_level value must be an integer between 0 and 320.
An example configuration may look as follows:
<syscheck>
  <directories check_all="yes">/etc,/usr/bin,/usr/sbin</directories>
  <directories check_all="yes">/root/users.txt,/bsd,/root/db.html</directories>
  <directories check_all="yes" recursion_level="3">folder_test</directories>
</syscheck>
Configuring syscheck process priority
To adjust syscheck CPU usage on the monitored system the process_priority option can be used. It sets the nice value for syscheck process. The default process_priority is set to 10.
Setting process_priority value higher than the default, will give syscheck lower priority, less CPU resources and make it run slower. In the example below the nice value for syscheck process is set to maximum:
<syscheck>
  <process_priority>19</process_priority>
</syscheck>
Setting process_priority value lower than the default, will give syscheck higher priority, more CPU resources and make it run faster. In the example below the nice value for syscheck process is set to minimum:
<syscheck>
  <process_priority>-20</process_priority>
</syscheck>
Configuring where the database is to be stored When the SIEM agent starts it performs a first scan and generates its database. By default, the database is created in disk:
<syscheck>
  <database>disk</database>
</syscheck>
Syscheck can be configured to store the database in memory instead by changing value of the database option:
<syscheck>
  <database>memory</database>
</syscheck>
The main advantage of using in memory database is the performance as reading and writing operations are faster than performing them on disk. The corresponding disadvantage is that the memory must be sufficient to store the data.
Configuring synchronization Synchronization can be configured to change the synchronization interval, the number of events per second, the queue size and the response timeout:
<syscheck>
  <synchronization>
    <enabled>yes</enabled>
    <interval>5m</interval>
    <max_interval>1h</max_interval>
    <response_timeout>30</response_timeout>
    <queue_size>16384</queue_size>
    <max_eps>10</max_eps>
  </synchronization>
</syscheck>
Active response
How it works
When is an active response triggered?
An active response is a script that is configured to execute when a specific alert, alert level or rule group has been triggered. Active responses are either stateful or stateless responses. Stateful responses are configured to undo the action after a specified period of time while stateless responses are configured as one-time actions.
Where are active response actions executed?
Each active response specifies where its associated command will be executed: on the agent that triggered the alert, on the manager, on another specified agent or on all agents, which also includes the manager(s).
Active response configuration Active responses are configured in the manager by modifying the ossec.conf file as follows:
Create a command
- In order to configure an active response, a command must be defined that will initiate a certain script in response to a trigger.
- To configure the active response, define the name of a command using the pattern below and then reference the script to be initiated. Next, define what data element(s) will be passed to the script.
- Custom scripts that have the ability to receive parameters from the command line may also be used for an active response.
Example:
<command>
  <name>host-deny</name>
  <executable>host-deny.sh</executable>
  <expect>srcip</expect>
  <timeout_allowed>yes</timeout_allowed>
</command>
In this example, the command is called host-deny and initiates the host-deny.sh script. The data element is defined as srcip. This command is configured to allow a timeout after a specified period of time, making it a stateful response.
Define the active response
The active response configuration defines when and where a command is going to be executed. A command will be triggered when a specific rule with a specific id, severity level or source matches the active response criteria. This configuration will further define where the action of the command will be initiated, meaning in which environment (agent, manager, local, or everywhere).
Example:
<active-response>
  <command>host-deny</command>
  <location>local</location>
  <level>7</level>
  <timeout>600</timeout>
</active-response>
In this example, the active response is configured to execute the command that was defined in the previous step. The where of the action is defined as the local host and the when is defined as any time the rule has a level higher than 6. The timeout that was allowed in the command configuration is also defined in the above example. The active response log can be viewed at
/var/ossec/logs/active-responses.log
Default Active response scripts
Wazuh is pre-configured with the following scripts for Linux:
| Nr. | Script name | Description |
|---|---|---|
1 |
disable-account.sh |
Disables an account by setting passwd-l |
2 |
firewall-drop.sh |
Adds an IP to the iptables deny list |
3 |
firewalld-drop.sh |
Adds an IP to the firewalld drop list |
4 |
host-deny.sh |
Adds an IP to the /etc/hosts.deny file |
5 |
ip-customblock.sh |
Custom OSSEC block, easily modifiable for custom response |
6 |
ipfw_mac.sh |
Firewall-drop response script created for the Mac OS |
7 |
ipfw.sh |
Firewall-drop response script created for ipfw |
8 |
npf.sh |
Firewall-drop response script created for npf |
9 |
ossec-slack.sh |
Posts modifications on Slack |
10 |
ossec-tweeter.sh |
Posts modifications on Twitter |
11 |
pf.sh |
Firewall-drop response script created for pf |
12 |
restart-ossec.sh |
Automatically restarts Wazuh when ossec.conf has been changed |
13 |
route-null.sh |
Adds an IP to null route |
The following pre-configured scripts are for Windows:
| Nr. | Script name | Description |
|---|---|---|
1 |
netsh.cmd |
Blocks an ip using netsh |
2 |
restart-ossec.cmd |
Restarts ossec agent |
32 |
route-null.cmd |
Adds an IP to null route |
Configuration
Basic usage.
An active response is configured in the ossec.conf file in the Active Response and Command sections.
In this example, the restart-ossec command is configured to use the restart-ossec.sh script with no data element. The active response is configured to initiate the restart-ossec command on the local host when the rule with ID 10005 fires. This is a Stateless response as no timeout parameter is defined.
Command:
<command>
  <name>restart-ossec</name>
  <executable>restart-ossec.sh</executable>
  <expect></expect>
</command>
Active response:
<active-response>
  <command>restart-ossec</command>
  <location>local</location>
  <rules_id>10005</rules_id>
</active-response>
Windows automatic remediation.
In this example, the win_rout-null command is configured to use the route-null.cmd script using the data element srcip. The active response is configured to initiate the win_rout-null command on the local host when the rule has a higher alert level than 7. This is a Stateful response with a timeout set at 900 seconds.
Command:
<command>
  <name>win_route-null</name>
  <executable>route-null.cmd</executable>
  <expect>srcip</expect>
  <timeout_allowed>yes</timeout_allowed>
</command>
Active response:
<active-response>
  <command>win_route-null</command>
  <location>local</location>
  <level>8</level>
  <timeout>900</timeout>
</active-response>
Block an IP with PF.
In this example, the pf-block command is configured to use the pf.sh script using the data element srcip. The active response is configured to initiate the pf-block command on agent 001 when a rule in either the “authentication_failed” or “authentication_failures” rule group fires. This is a Stateless response as no timeout parameter is defined.
Command:
<command>
  <name>pf-block</name>
  <executable>pf.sh</executable>
  <expect>srcip</expect>
</command>
Active response:
<active-response>
  <command>pf-block</command>
  <location>defined-agent</location>
  <agent_id>001</agent_id>
  <rules_group>authentication_failed|authentication_failures</rules_group>
</active-response>
Add an IP to the iptables deny list.
In this example, the firewall-drop command is configured to use the firewall-drop.sh script using the data element srcip. The active response is configured to initiate the firewall-drop command on all systems when a rule in either the “authentication_failed” or “authentication_failures” rule group fires. This is a Stateful response with a timeout of 700 seconds. The <repeated_offenders> tag increases the timeout period for each subsequent offense by a specific IP address.
Command:
<command>
  <name>firewall-drop</command>
  <executable>firewall-drop.sh</executable>
  <expect>srcip</expect>
</command>
Active response:
<active-response>
  <command>firewall-drop</command>
  <location>all</location>
  <rules_group>authentication_failed|authentication_failures</rules_group>
  <timeout>700</timeout>
  <repeated_offenders>30,60,120</repeated_offenders>
</active-response>
Active response for a specified period of time . The action of a stateful response continues for a specified period of time.
In this example, the host-deny command is configured to use the host-deny.sh script using the data element srcip. The active response is configured to initiate the host-deny command on the local host when a rule with a higher alert level than 6 is fired.
Command:
<command>
  <name>host-deny</name>
  <executable>host-deny.sh</executable>
  <expect>srcip</expect>
  <timeout_allowed>yes</timeout_allowed>
</command>
Active response:
<active-response>
  <command>host-deny</command>
  <location>local</location>
  <level>7</level>
  <timeout>600</timeout>
</active-response>
Active response that will not be undone. The action of a stateless command is a one-time action that will not be undone.
In this example, the mail-test command is configured to use the mail-test.sh script with no data element. The active response is configured to initiate the mail-test command on the server when the rule with ID 1002 fires.
Command:
<command>
  <name>mail-test</name>
  <executable>mail-test.sh</executable>
  <timeout_allowed>no</timeout_allowed>
  <expect></expect>
</command>
Active response:
<active-response>
    <command>mail-test</command>
    <location>server</location>
    <rules_id>1002</rules_id>
 </active-response>
Vulnerability detection
How it works
To be able to detect vulnerabilities, now agents are able to natively collect a list of installed applications, sending it periodically to the manager (where it is stored in local sqlite databases, one per agent). Also, the manager builds a global vulnerabilities database, from publicly available CVE repositories, using it later to cross-correlate this information with the agent’s applications inventory data.
The global vulnerabilities database is created automatically, currently pulling data from the following repositories:
- https://canonical.com: Used to pull CVEs for Ubuntu Linux distributions.
- https://access.redhat.com: Used to pull CVEs for Red Hat and CentOS Linux distributions.
- https://www.debian.org: Used to pull CVEs for Debian Linux distributions.
- https://nvd.nist.gov/: Used to pull CVEs from the National Vulnerability Database.
This database can be configured to be updated periodically, ensuring that the solution will check for the very latest CVEs.
Once the global vulnerability database (with the CVEs) is created, the detection process looks for vulnerable packages in the inventory databases (unique per agent). Alerts are generated when a CVE (Common Vulnerabilities and Exposures) affects a package that is known to be installed in one of the monitored servers. A package is labeled as vulnerable when its version is contained within the affected range of a CVE.
Running a vulnerability scan
Enable the agent module used to collect installed packages on the monitored system.
It can be done by adding the following block of settings to your shared agent configuration file:
<wodle name="syscollector">
  <disabled>no</disabled>
  <interval>1h</interval>
  <os>yes</os>
  <packages>yes</packages>
</wodle>
If you want to scan vulnerabilities in Windows agents, you will also have to add the
hotfixesscan:<wodle name="syscollector"> <disabled>no</disabled> <interval>1h</interval> <os>yes</os> <packages>yes</packages> <hotfixes>yes</hotfixes> </wodle>
Enable the manager module used to detect vulnerabilities.
You can do this adding a block like the following to your manager configuration file:
<vulnerability-detector>
    <enabled>yes</enabled>
    <interval>5m</interval>
    <ignore_time>6h</ignore_time>
    <run_on_start>yes</run_on_start>

    <provider name="canonical">
        <enabled>yes</enabled>
        <os>trusty</os>
        <os>xenial</os>
        <os>bionic</os>
        <os>focal</os>
        <update_interval>1h</update_interval>
    </provider>

    <provider name="debian">
        <enabled>yes</enabled>
        <os>wheezy</os>
        <os>stretch</os>
        <os>jessie</os>
        <os>buster</os>
        <update_interval>1h</update_interval>
    </provider>

    <provider name="redhat">
        <enabled>yes</enabled>
        <update_from_year>2010</update_from_year>
        <update_interval>1h</update_interval>
    </provider>

    <provider name="nvd">
        <enabled>yes</enabled>
        <update_from_year>2010</update_from_year>
        <update_interval>1h</update_interval>
    </provider>

</vulnerability-detector>
Remember to restart the manager to apply the changes.
You can also check the vulnerability dashboards to have an overview of your agents’ status.

Tenable.sc
Tenable.sc is vulnerability management tool, which make a scan systems and environments to find vulnerabilities. The Logstash collector can connect to Tebable.sc API to get results of the vulnerability scan and send it to the Elasticsarch index. Reporting and analysis of the collected data is carried out using a prepared dashboard [Vulnerability] Overview Tenable
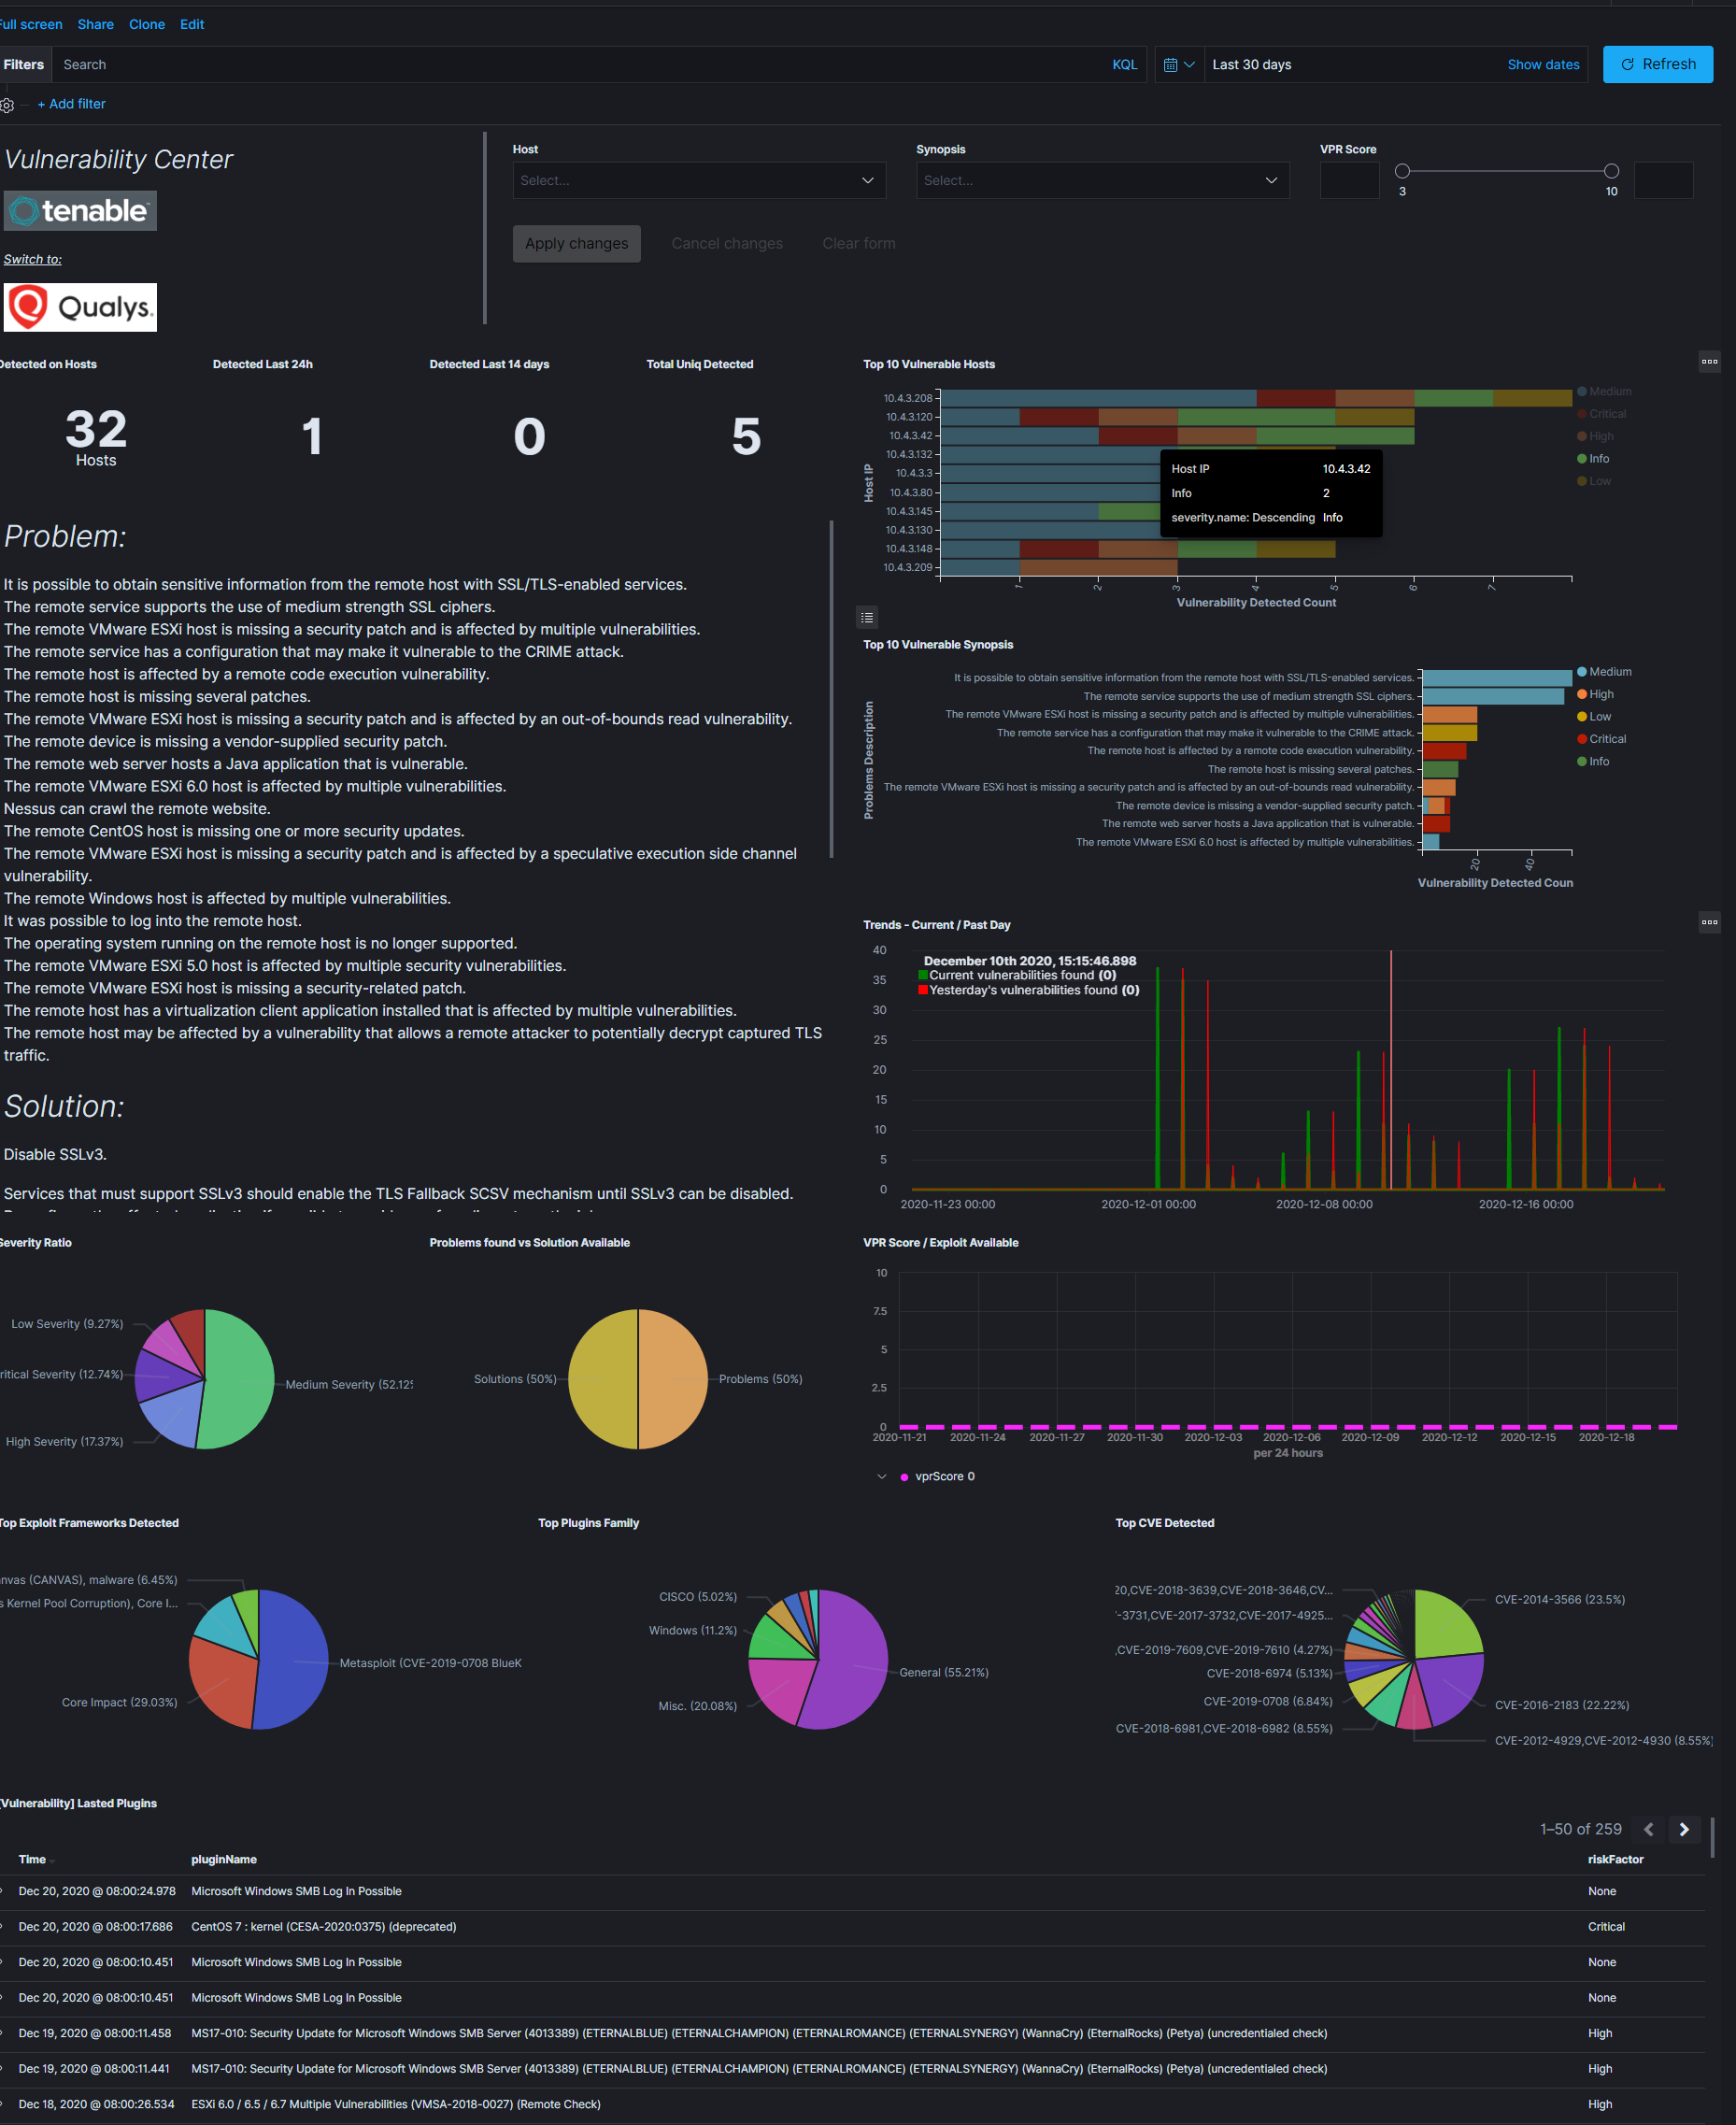
Configuration
enable pipeline in Logstash configuration:
vim /etc/logstash/pipelines.ymluncomment following lines:
- pipeline.id: tenable.sc
  path.config: "/etc/logstash/conf.d/tenable.sc/*.conf"
configure connection to Tenable.sc manager:
vim /etc/logstash/conf.d/tenable.sc/venv/main.pyset of the connection parameters:
- TENABLE_ADDR - IP address and port Tenable.sc manger;
- TENABLE_CRED - user and password;
- LOGSTASH_ADDR = IP addresss and port Logstash collector;
example:
TENABLE_ADDR = ('10.4.3.204', 443)
TENABLE_CRED = ('admin', 'passowrd')
LOGSTASH_ADDR = ('127.0.0.1', 10000)
Qualys Guard
Qualys Guard is vulnerability management tool, which make a scan systems and environments to find vulnerabilities. The Logstash collector can connect to Qualys Guard API to get results of the vulnerability scan and send it to the Elasticsarch index. Reporting and analysis of the collected data is carried out using a prepared dashboard [Vulnerability] Overview Tenable
Configuration
enable pipeline in Logstash configuration:
vim /etc/logstash/pipelines.ymluncomment following lines:
- pipeline.id: qualys
  path.config: "/etc/logstash/conf.d/qualys/*.conf"
configure connection to Qualys Guard manager:
vim /etc/logstash/conf.d/qualys/venv/main.pyset of the connection parameters:
- LOGSTASH_ADDR - IP address and port of the Logstash collector;
- hostname - IP address and port of the Qualys Guard manger;
- username - user have access to Qualys Guard manger;
- password - password for user have access to Qualys Guard manger.
example:
LOGSTASH_ADDR = ('127.0.0.1', 10001)

# connection settings
conn = qualysapi.connect(
    username="emcas5ab1",
    password="PASSW0RD$",
    hostname="qualysguard.qg2.apps.qualys.eu"
)
UEBA
Energy Logserver system allows building and maintaining user’s database model (UBA) and computers (EBA), and uses build in mechanisms of Machine Learning and Artificial Intelligence. Both have been implemented withing UEBA module.
The UEBA module enables premium features of Energy Logserver SIEM Plan. This is module which collects knowledge and functionalities which were always available in our system. This cybersecurity approach helps analytics to discover threads in user and entities behaviour. Module tracks user or resource actions and scans common behaviour patterns. With UEBA system provides deep knowledge of daily trends in actions enabling SOC teams to detect any abnormal and suspicious activities. UEBA differs a lot from regular SIEM approach based on logs analytics in time.
The module focus on actions and not the logs itself. Every user, host or other resource is identified as an entity in the system and its behaviour describes its work. Energy Logserver provide new data schema that mark each action over time. Underlying Energy search engine analyse incoming data in order to identify log corresponding to action. We leave the log for SIEM use cases, but incoming data is associated with an action categories. New data model stores actions for each entity and mark them down as metadata stored in individual index.
Once tracking is done, SOC teams can investigate patterns for single action among many entities or many actions for a single user/entity. This unique approach creates an activity map for everyone working in the organization and for any resource. Created dataset is stored in time. All actions can be analysed for understanding the trend and comparing it with historical profile. UEBA is designed to give information about the common type of action that user or entity performs and allows to identify specific time slots for each. Any differences noted, abnormal occurances of an event can be a subject of automatic alerts. UEBA comes with defined dashboards which shows discovered actions and metrics for them.
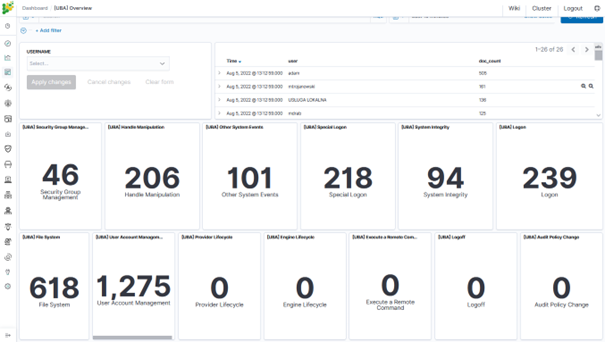
It is easy to filter presented data with single username/host or a group of users/hosts using query syntax. With help of saved searches SOC can create own outlook to stay focused on users at high risk of an attack. Energy Logserver is made for working with data. UEBA gives new analytics approach, but what is more important it brings new metrics that we can work with. Artificial Intelligence functionality build in Energy Logserver help to calculate forecast for each action over single user or entire organization. In the same time thanks to extended set of rule types, Energy Logserver can correlate behavioral analysis with other data collected from environment. Working with Energy Logserver SIEM Plan with UEBA module greatly enlarge security analytics scope.
BCM Remedy
Energy Logserver creates incidents that require handling based on notifications from the Alert module. This can be done, for example, in the BMC Remedy system using API requests.
BMC Remedy configuration details: https://docs.bmc.com/docs/ars91/en/bmc-remedy-ar-system-rest-api-overview-609071509.html .
To perform this incident notification in an external system. You need to select in the configuration of the alert rule “Alert Method” “Command” and in the “Path to script/command” field enter the correct request.
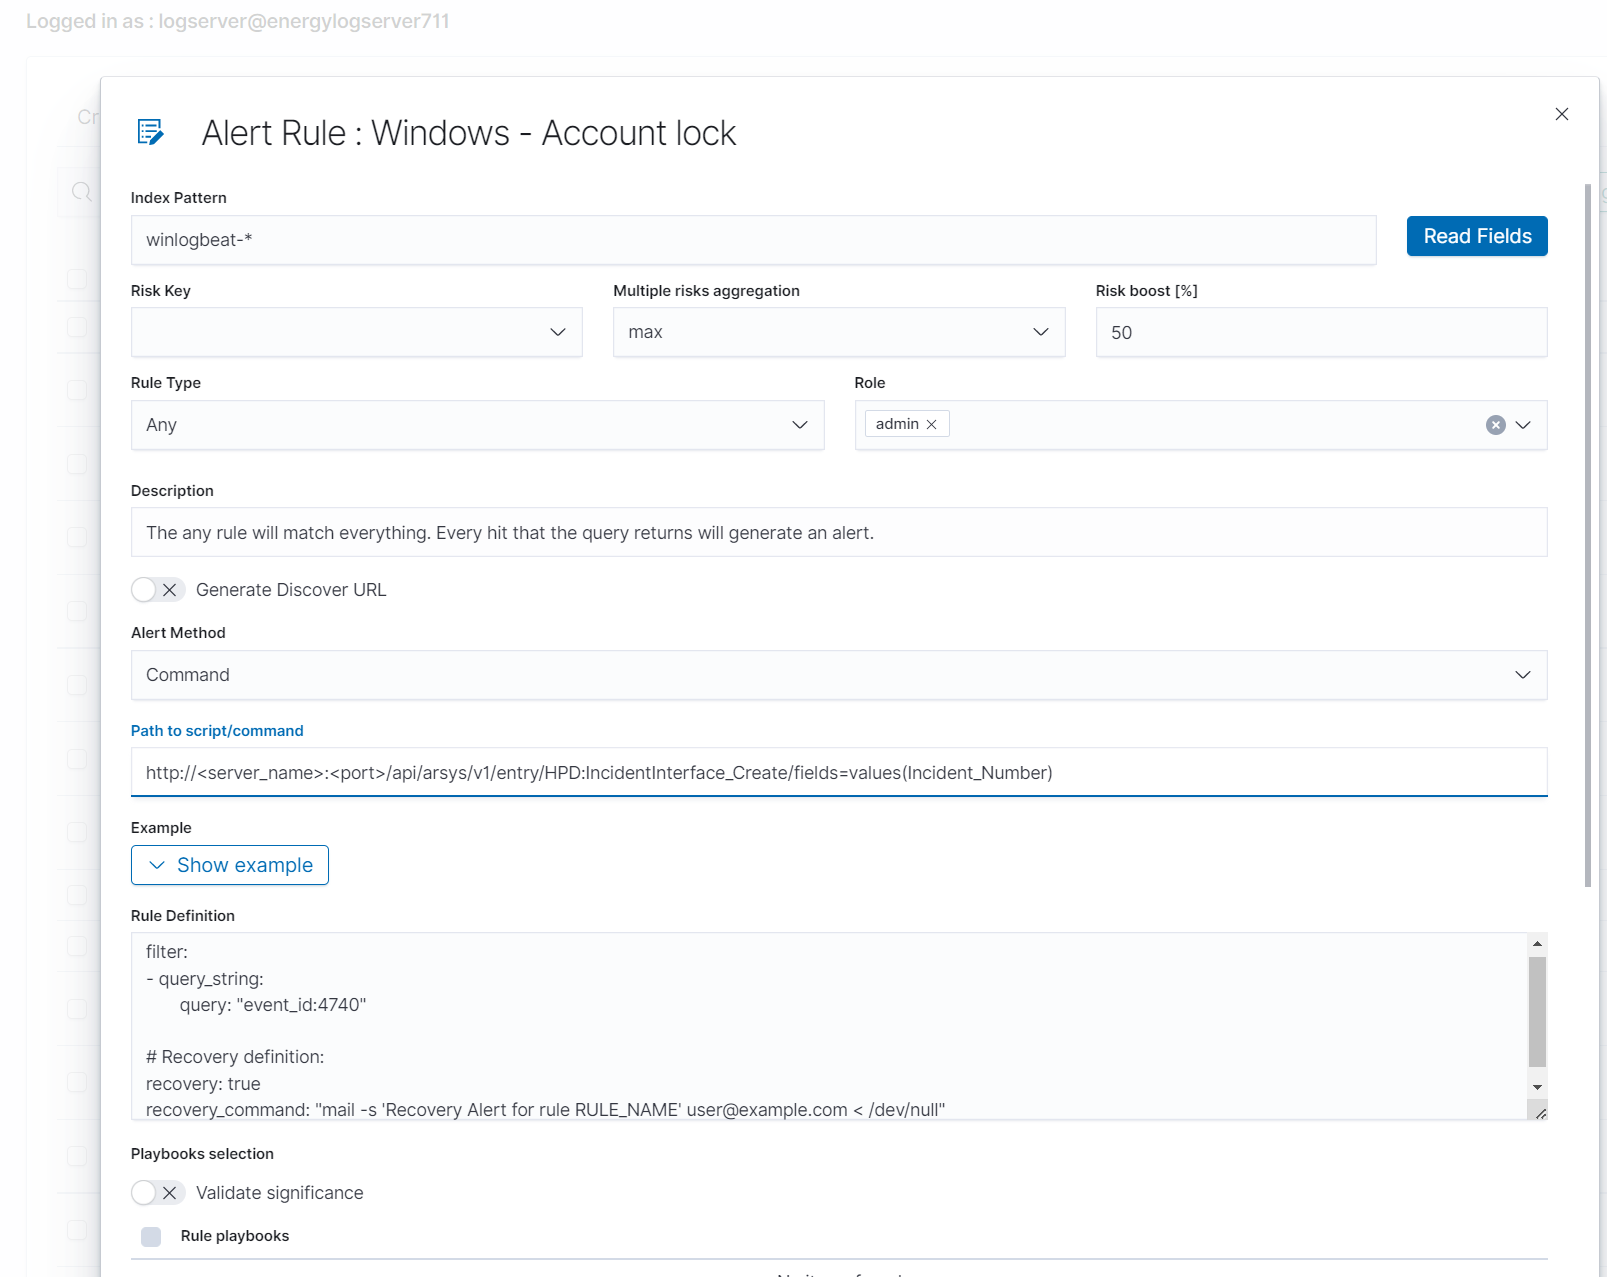
SIEM Virtus Total integration
This integration utilizes the VirusTotal API to detect malicious content within the files monitored by File Integrity Monitoring. This integration functions as described below:
- FIM looks for any file addition, change, or deletion onthe monitored folders. This module stores the hash of thesefiles and triggers alerts when any changes are made.
- When the VirusTotal integration is enabled, it istriggered when an FIM alert occurs. From this alert, themodule extracts the hash field of the file.
- The module then makes an HTTP POST request to theVirusTotal database using the VirusTotal API for comparisonbetween the extracted hash and the information contained inthe database.
- A JSON response is then received that is the result ofthis search which will trigger one of the following alerts:
- Error: Public API request rate limit reached.
- Error: Check credentials.
- Alert: No records in VirusTotal database.
- Alert: No positives found.
- Alert: X engines detected this file.
The triggered alert is logged in the integration.log file and stored in the alerts.log file with all other alerts.
Find examples of these alerts in the VirusTotal integrationalerts_ section below.
Configuration
Follow the instructions from :ref:manual_integration to enable the Integrator daemon and configure the VirusTotal integration.
This is an example configuration to add on the ossec.conf file:
  <integration>
    <name>virustotal</name>
    <api_key>API_KEY</api_key> <!-- Replace with your   sTotal API key -->
    <group>syscheck</group>
    <alert_format>json</alert_format>
  </integration>
SIEM Custom integration
The integrator tool is able to connect SIEM module with other external software.
This is an example configuration for a custom integration in ossec.conf:
  <!--Custom external Integration -->
  <integration>
    <name>custom-integration</name>
    <hook_url>WEBHOOK</hook_url>
    <level>10</level>
    <group>multiple_drops|authentication_failures</group>
    <api_key>APIKEY</api_key> <!-- Replace with your external service API key -->
    <alert_format>json</alert_format>
  </integration>
To start the custom integration, the ossec.conf file, including the block integration component, has to be modified in the manager. The following parameters can be used:
- name: Name of the script that performs the integration. In the case of a custom integration like the one discussed in this article, the name must start with “custom-“.
- hook_url: URL provided by the software API to connect to the API itself. Its use is optional, since it can be included in the script.
- api_key: Key of the API that enables us to use it. Its use is also ptional for the same reason the use of the hook_url is optional.
- level: Sets a level filter so that the script will not receive alerts below a certain level.
- rule_id: Sets a filter for alert identifiers.
- group: Sets an alert group filter.
- event_location: Sets an alert source filter.
- alert_format: Indicates that the script receives the alerts in JSON format (recommended). By default, the script will receive the alerts in full_log format.
License Service
License service configuration is required when using the SIEM Plan license. To configure the License Service, set the following parameters in the configuration file:
hosts - Elasticsearch cluster hosts IP, password - password for Logserver user, https - true or false.
vi /opt/license-service/license-service.conf
elasticsearch_connection:
  hosts: ["els_host_IP:9200"]

  username: logserver
  password: "logserver_password"

  https: true