Alerting System
Overview
Alerting in Energy Logserver is the early warning system, automatically monitoring log data and generating notifications when security events occur. It provides continuous surveillance of your environment.
What is Alerting?
Alerting transforms raw log data into actionable security intelligence by detecting patterns, anomalies, and known threat indicators in real-time, supporting compliance and incident response.
Straightforward explanation:
What it is: An automated security event detection system.
How it works: Define rules; the system monitors data and alerts when matches occur.
What it does: Enables early threat detection, incident response, and compliance monitoring.
Alerting Interface Overview
Access: ELS Console → SIEM → Alerts
The Alerts workspace exposes six tabs:
Create Alert Rule: form for defining a new alert rule.
Alert Rules List: all existing rules, grouped by the Group Name assigned at creation time.
Alert Status: last execution status for every rule (module state, hits, matches, duration).
Playbook: library of response procedures that can be attached to alert rules.
Risks: risk categories and (field, value) to category assignments that drive the risk score on triggered alerts.
Incidents: triggered alerts ordered by time, with the calculated risk score per incident.
How the pieces fit together
Alert Rules detect conditions and emit events into the
.siem-*indices.Incidents are those triggered events, annotated with a per-record risk score derived from Risks (Risk Key value looked up in the Risk List, aggregated, multiplied by the rule’s Risk boost).
Playbooks are text and script artefacts kept in the Playbook library; a rule may attach any number of playbooks that are shown next to the triggered incident.
Creating Your First Alert
Energy Logserver allows you to create alerts, i.e., monitoring queries. These are constant queries that run in the background, and when the conditions specified in the alert are met, the specified action is taken.
For example, if you want to know when more than 20 “status:500” response codes from your homepage appear within one hour, then create an alert that checks the number of occurrences of the “status:500” query for a specific index every 5 minutes. If the condition is met, an action is sent, such as a message to an email address or launching a script.
Enabling the Alert Module
SMTP Server Configuration
To configure the SMTP server for email notifications, you should:
Edit
/opt/alert/config.yamland add the following section:# email conf smtp_host: "mail.example.com" smtp_port: 587 smtp_ssl: false from_addr: "siem@example.com" smtp_auth_file: "/opt/alert/smtp_auth_file.yml"
Add the new
/opt/alert/smtp_auth_file.ymlfile:user: "user" password: "password"
Restart the
alertservice:systemctl restart alert
Alert Creation
Navigation: ELS Console → SIEM → Alerts → Create Alert Rule
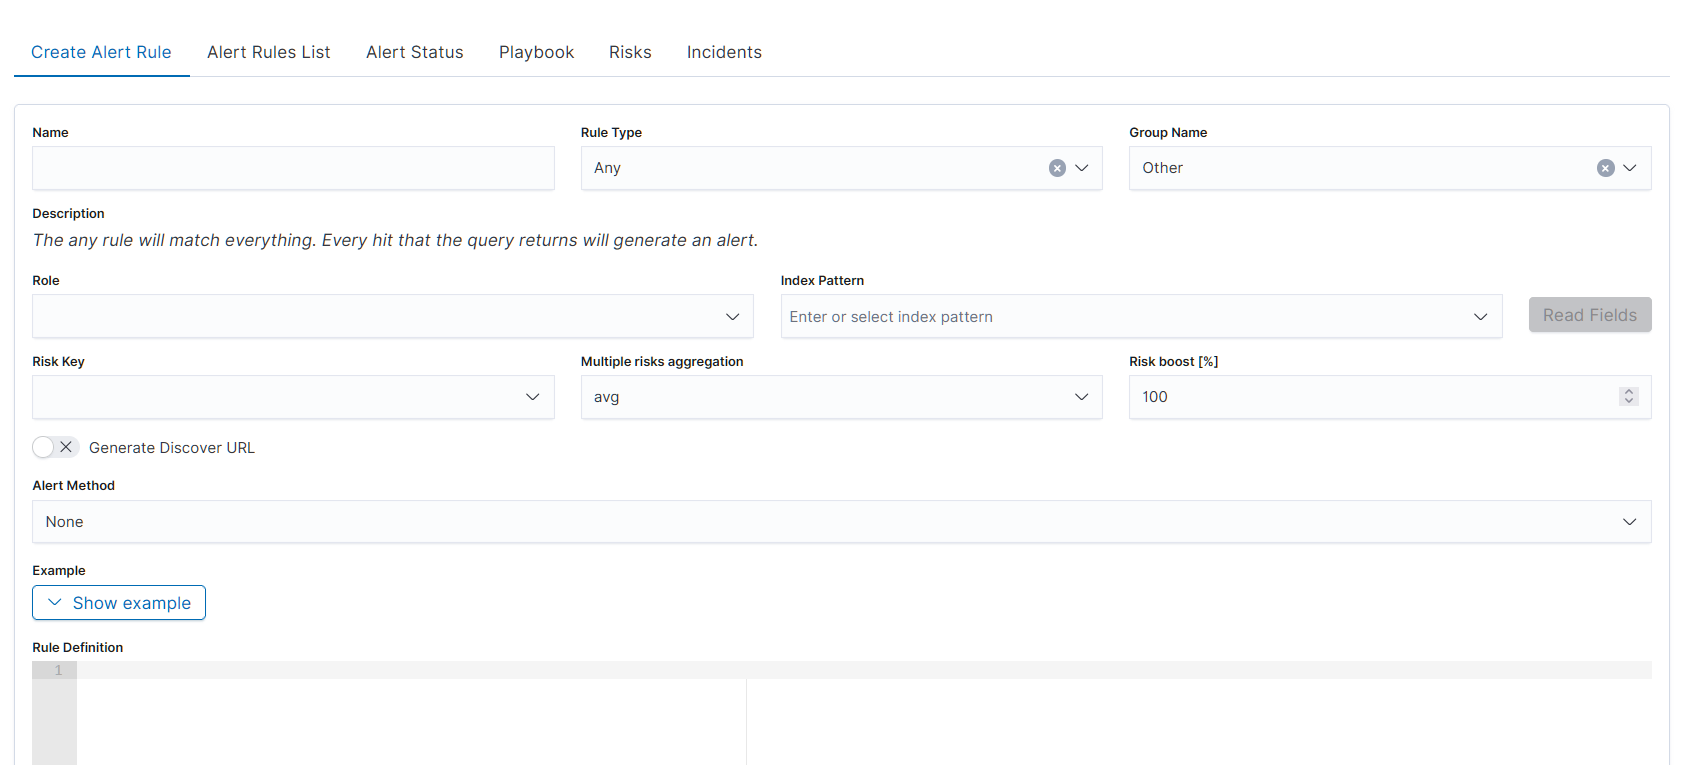
The alert creation form is a single-page form with the following fields:
Basic Identity
Name: descriptive name for the alert rule
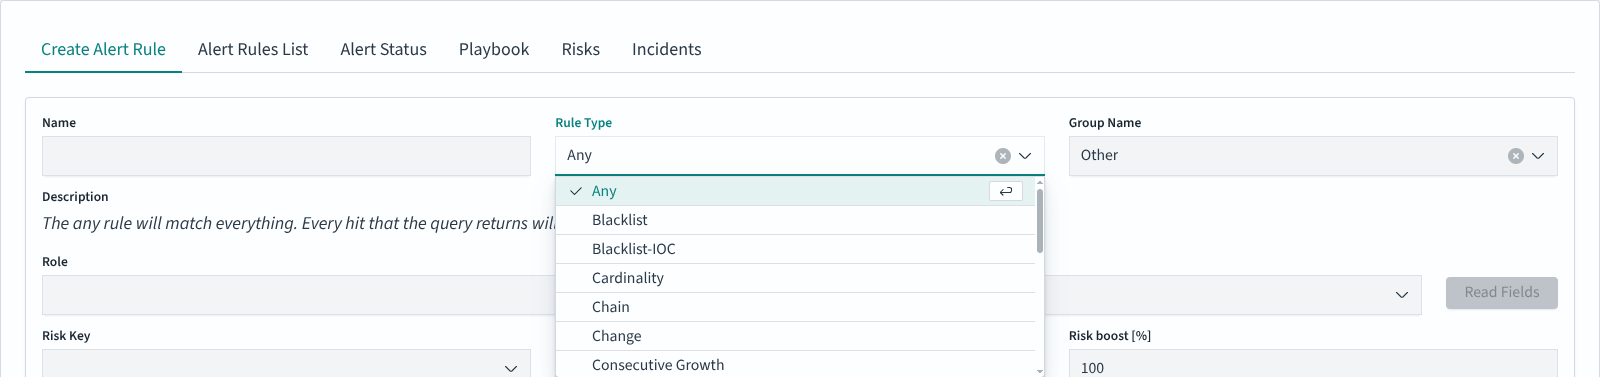
Rule Type: type of detection logic. The dropdown lists 19 types: Any, Blacklist, Blacklist-IOC, Cardinality, Chain, Change, Consecutive Growth, Difference, Difference Multi Pattern, Find Match, Flatline, Frequency, Logical, Metric Aggregation, New term, Percentage Match, Spike, Unique Long Term, Whitelist. Selecting a Rule Type updates the Description field dynamically with an explanation of the selected type.
Group Name: organizes alerts into groups for management (e.g., Linux, Windows Security, Netflow, Correlated)
Description: read-only field, auto-populated based on selected Rule Type
Scope
Role: user role scope for the alert
Index Pattern: index pattern to query (e.g.,
windows-security-*)Read Fields: button that loads available fields from the selected index pattern
Risk Settings
Risk Key: field used as the risk key for scoring
Multiple risks aggregation: aggregation method: avg, custom, max, min, sum. Default: avg
Risk boost [%]: percentage multiplier for risk scoring. Default: 100
Discovery
Generate Discover URL: toggle (off by default). When enabled, generates a Discover link attached to the alert notification
Note
If you reference the Discover link directly in the Rule Definition body instead of using this toggle, use the field name
discovery_url. The earlier namekibana_discovery_urlwas removed in 7.9.0 and no longer resolves.
Notification
Alert Method: delivery method for alert notifications. Available options: Command, Email, Energy SOAR, ITRS OP5 Monitor, Jira, None, ServiceNow, Slack, Syslog, TheHive Project, User, WebHook Connector
Rule Definition
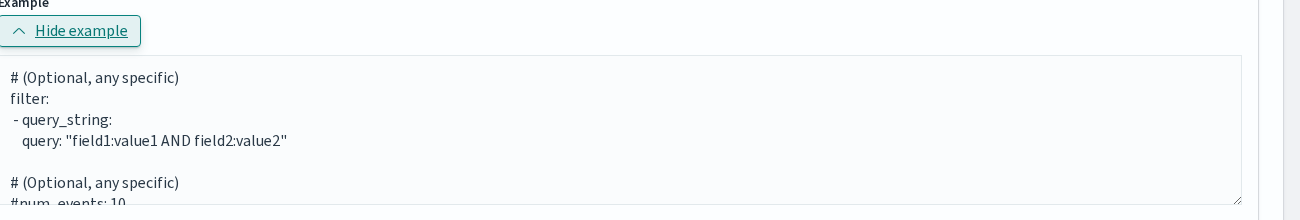
Example: collapsible section with a YAML example for the selected Rule Type. Click Show example to expand the example pane with a ready-made snippet matching the current Rule Type; copy the blocks you need into the Rule Definition editor below.
Rule Definition: code editor for writing the alert rule in YAML format
Playbooks
Playbooks: toggle (off by default). When enabled, the form reveals two adjacent lists (Available playbooks and Rule’s playbooks) populated from the Playbook library. Use the arrow icon in each row to move a playbook between lists; the paginated Available playbooks list supports 5 rows per page.
Sort by significance: toggle shown next to Playbooks. When enabled, the Rule’s playbooks list is reordered by the significance weight stored with each playbook (higher weight first).
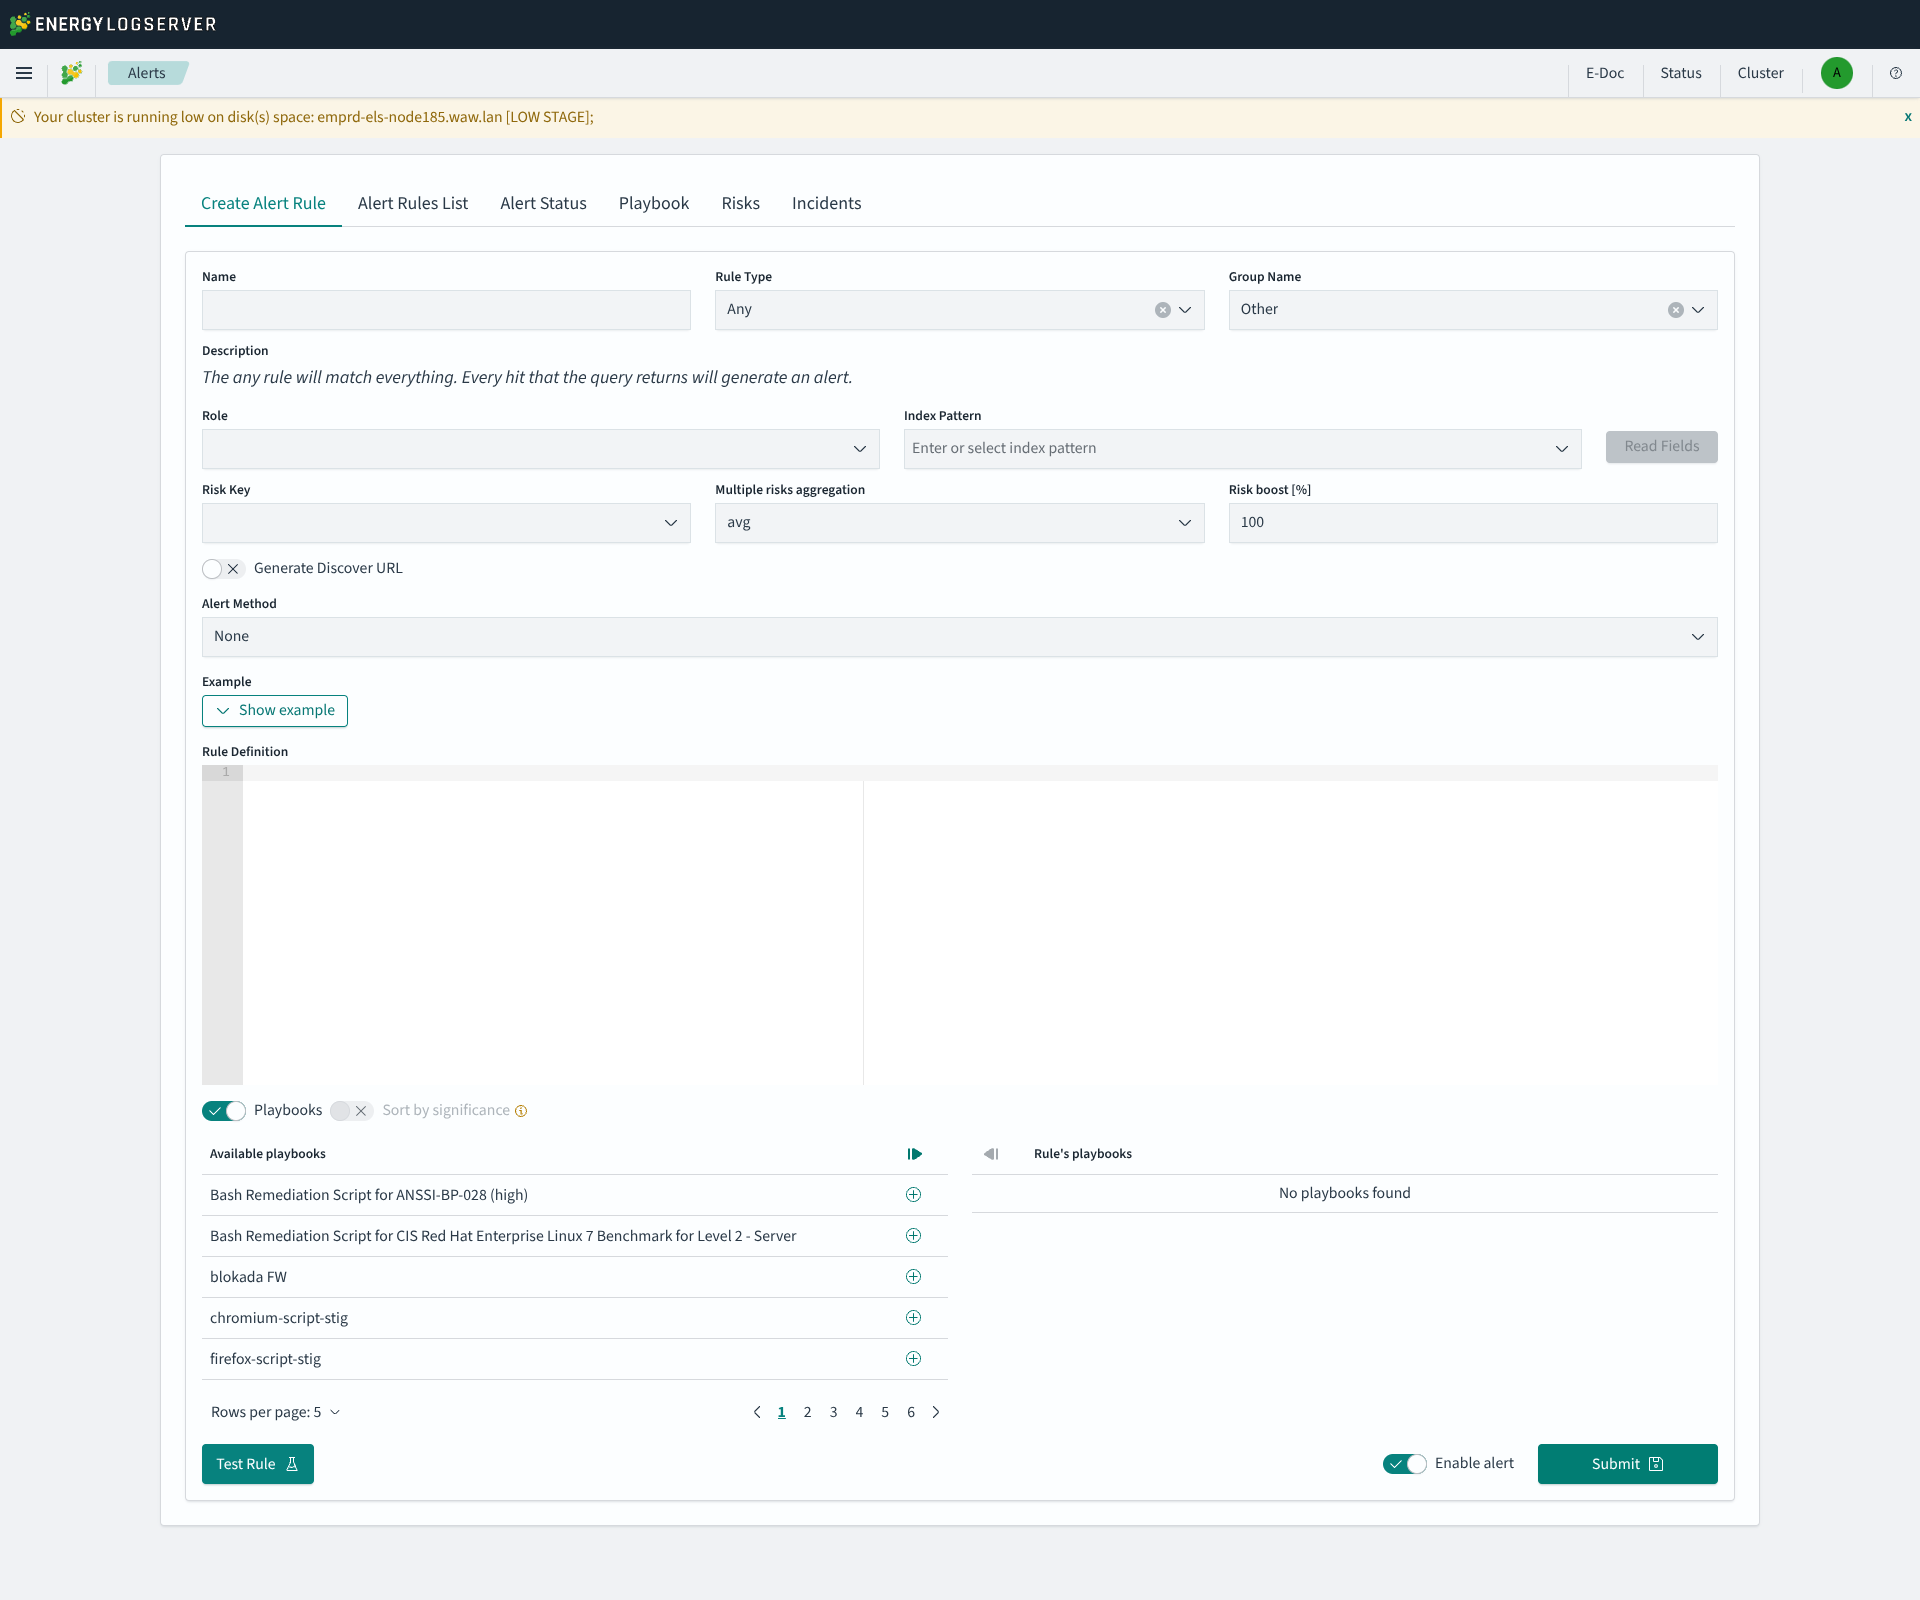
Form Actions
Test Rule: runs a syntax test and a dry-run of the rule without saving it. The form is validated first (Name, Role and Index Pattern are required); if anything is missing a toast such as
Form is not properly filled. Missing: alert name; index pattern;is shown. On success the result appears inline next to the button, for exampleSyntax test OK. The alarm has not been triggered. Risk evaluated: 0. No notification is dispatched and the rule is not persisted.
Enable alert: toggle to set the alert as active upon creation (on by default)
Submit: saves and creates the alert rule
List of Alert Rules
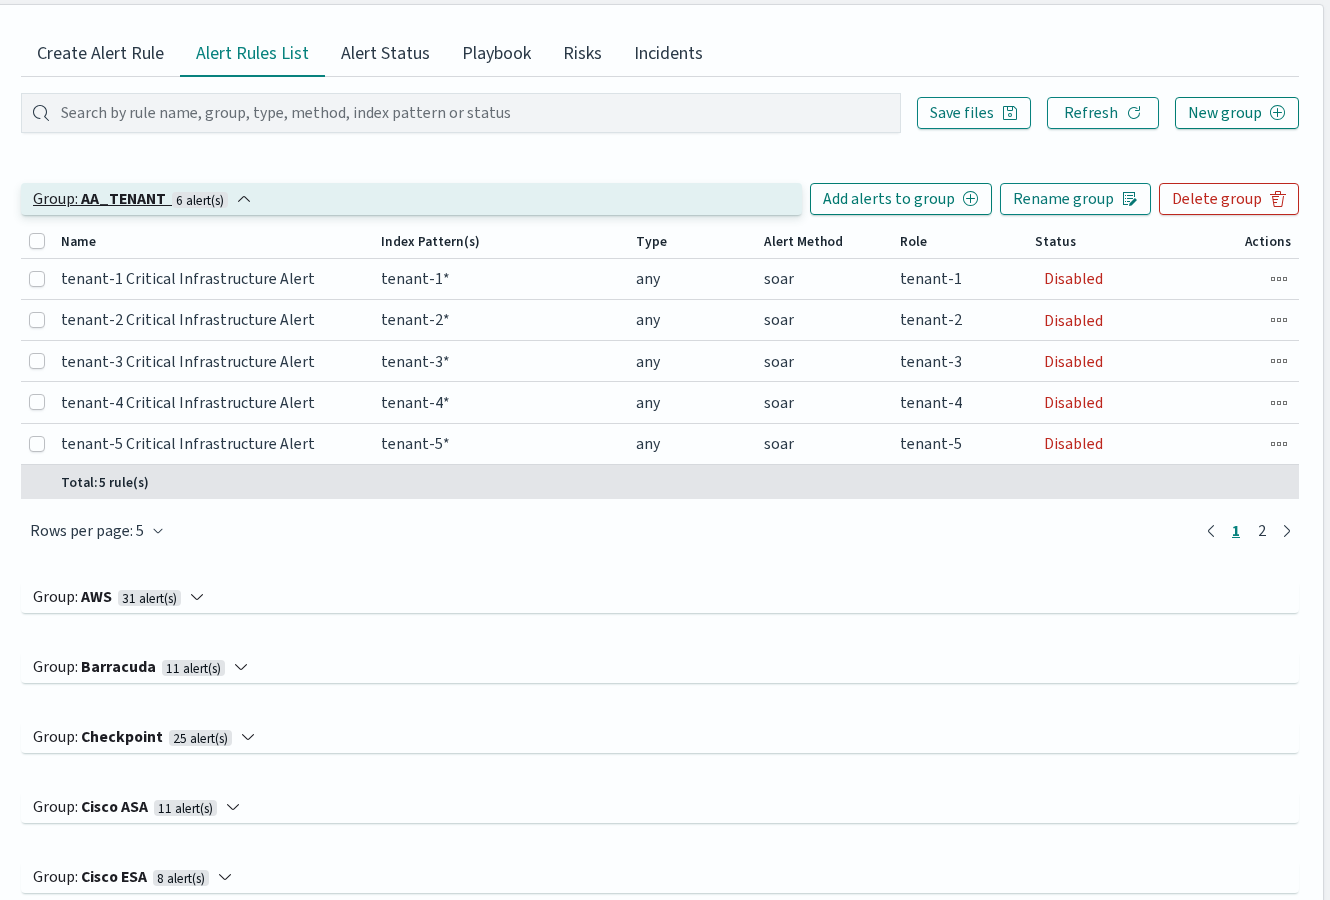
The Alert Rules List tab displays all created alert rules organized in collapsible groups. The toolbar provides a search bar for filtering by rule name, group, type, method, index pattern, or status, as well as buttons for saving rule files, refreshing the list, and creating new groups.
Each group can be expanded to show individual rules. Group-level actions include Add alerts to group, Rename group, and Delete group.
Each alert rule row contains the following columns: Name, Group, Index Pattern(s), Type, Alert Method, Role, and Status. The Status column is a clickable toggle that enables or disables the rule directly.
Per-rule actions are available as icon buttons: Run once (executes the rule against historical data with a configurable date range), Show (opens read-only view), Update (opens the rule for editing), and Delete (removes the rule after confirmation).
When multiple rules are selected via checkboxes, a bulk action bar appears with options to Enable, Disable, Change roles, Change group, or Delete the selected rules.
Alerts Status
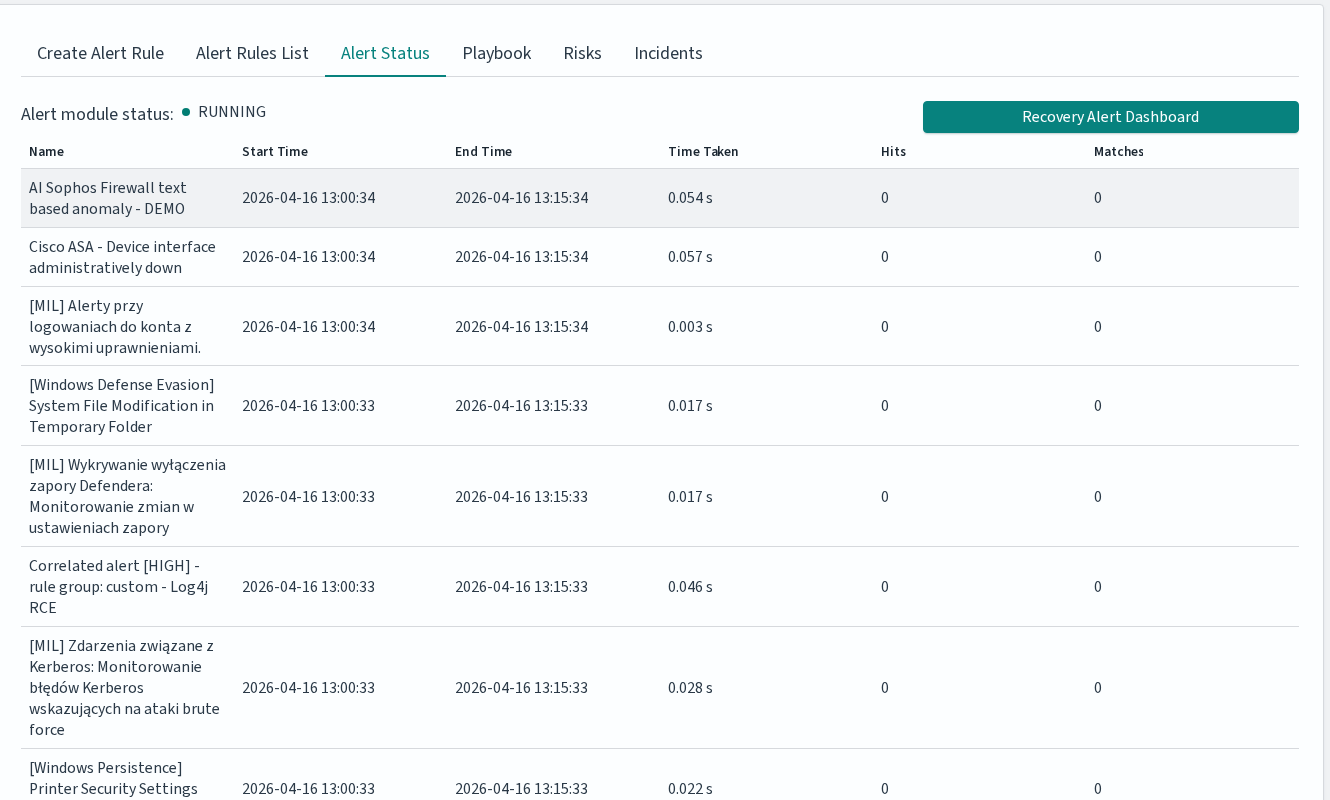
The Alert Status tab displays the alert module status (Running or Stopped) and a table with the following columns:
Column |
Description |
|---|---|
Name |
Alert rule name |
Start Time |
When the rule check started |
End Time |
When the rule check finished |
Time Taken |
Duration of the check in seconds |
Hits |
Number of matching events found |
Matches |
Number of times the rule condition was met |
The Recovery Alert Dashboard button restores the default alert dashboard if it has been modified or deleted.
Alert Rule Types
Alert rule types define how the system detects events. Available types:
Basic Alerts
Any: Triggers on any matching event.
Blacklist: The blacklist rule will check a certain field against a blacklist, and match if it is in the blacklist.
Blacklist-IOC: The blacklist rule will check a certain field against a blacklist, and match if it is in the blacklist (can be used for large files).
Cardinality: This rule matches when the total number of unique values for a certain field within a time frame is higher or lower than a threshold.
Change: This rule will monitor a certain field and match if that field changes. The field must change with respect to the last event with the same query_key.
Consecutive Growth: Rule matches for value difference between two aggregations calculated for different periods in time.
Difference: This rule calculates percentage difference between aggregations for two non-overlapping time windows.
Required parameters:
type: difference- Enable the rule.compare_key: value- Field for aggregation calculation.threshold_pct: 10- Alert triggers when percentage difference exceeds this value.delta_min: 3- Difference in minutes between calculated aggregations.agg_min: 1- Aggregation bucket in minutes.
Optional parameters:
query_key: hostname- If present, calculates aggregation for each unique query_key (must be of type keyword).
Calculation:
For current time
x, historical and present time windows are defined as:<x - agg_min - delta_min; x - delta_min> <= <x - agg_min; x>, wherex - delta_min <= x - agg_min => delta_min >= agg_min.Percentage difference:
d = | avg_now - avg_history | / max(avg_now, avg_history) * 100(ifavg_now - avg_history != 0,avg_now != 0,avg_history != 0); otherwise,d = 0.avg_nowis the arithmetic mean of<x - agg_min; x>, andavg_historyis the arithmetic mean of<x - agg_min - delta_min; x - delta_min>.
Difference Multi Pattern: The rule matches the difference in values between two aggregations from two index patterns calculated in a unit of time.
Find Match: Rule matches when, in a defined period of time, two correlated documents match certain strings.
Flatline: Triggers when event count drops below threshold.
Frequency: This rule matches when there are at least a certain number of events in a given time frame.
Metric Aggregation: Aggregates metrics and alerts on thresholds.
New Term: Detects new values in a monitored field.
Percentage Match: This rule matches when the percentage of documents in the match bucket within a calculation window is higher or lower than a threshold.
Spike: Detects sudden increases in event frequency.
Unique Long Term: This rule matches when there are values of compare_key in each checked timeframe.
Whitelist: Similar to blacklist, this rule will compare a certain field to a whitelist, and match if the list does not contain the term.
Advanced Alerts
Chain: Combines multiple rules. Rule matches when a complex, logical criteria is met. Rule can be used for alert data correlation.
Example:
Alerts that must occur:
Linux - Login Failure: Must appear 10 times.
AND
Linux - Login Success: Must appear 1 time.
If the sequence of these alerts occurs within 5 minutes and the values of the “username” field are related, the alert rule is triggered. The order of occurrence is important.
Logical: Rule matches when a complex, logical criteria is met. Rule can be used for alert data correlation.
Example:
Alerts that must occur:
Switch - Port is off-line: Must appear 5 times.
OR
Switch - Port is on-line: Must appear 5 times.
If both alerts are met within 5 minutes and the values of the “port_number” field are related, the alert rule is triggered. Logical connectives such as OR, AND, NOR, NAND, XOR can be used.
Rule type options reference
Every rule type accepts options from two shared groups, common options and additional options: plus its own required and rule-specific optional parameters shown in the matrix below (Req = required, Opt = optional, empty cell = not applicable to this rule type).
Common options (apply to all rule types)
Alerter-specific settings (alerta_*, alertmanager_*, jira_*, kibana_discover_*, etc.) are not listed here.
Option |
Type |
Description |
|---|---|---|
|
string |
Rule name; defaults to the rule filename |
|
string |
Human-readable description |
|
string |
Rule type ( |
|
array |
Query DSL filters applied to every search |
|
string |
Index pattern to query |
|
integer |
1 (highest) to 5 (lowest), default 2 |
|
string |
Owner of the rule |
|
string or array |
Dimension to group matches by |
|
string |
Event timestamp field; default |
|
time |
Minimum time between alerts for the same rule; default 1 min. Not honored by |
|
string |
Override the key used for realert grouping |
|
time |
Maximum realert time when applying exponential backoff |
|
time |
Aggregate matches within this time window into one alert |
|
time |
Query window size; default from |
|
time |
Delay before querying newly arrived data |
|
boolean |
Display timestamps in server local time |
|
array |
Fields to include in matches; default |
|
array |
Explicit subset of fields |
|
array |
Fields whose top N values are listed in the alert |
|
integer |
N for |
|
string |
Custom alert message template |
|
array |
Fields substituted into |
|
object |
Named keyword substitutions for |
|
enum |
|
|
string |
Placeholder for missing fields in alert text; default |
|
array |
Python class paths to run on each match |
|
array |
Python class paths providing custom Jinja filters |
|
array |
Fields shown in the alert summary table |
|
enum |
|
|
boolean |
Re-scan the full timeframe for every query |
|
string or array |
Rule file(s) to inherit from |
Additional options
These options apply to every rule type.
Option |
Type |
Description |
|---|---|---|
|
boolean |
When |
|
string |
Shell command to execute on recovery |
|
time |
Escalate the alert if it is not acknowledged within this window |
|
array |
Users to notify on escalation |
|
object |
Object with a |
|
string |
Comma-separated event fields whose values look up the risk category |
|
enum |
Combine multiple risk values with |
|
integer |
Multiplier applied to the aggregated risk score, in percent (GUI: “Risk boost [%]”) |
Rule type options reference
| Option | Any | Blacklist | Whitelist | Change | Frequency | Spike | Spike Aggregation | Flatline | New Term | Cardinality | Metric Aggregation | Percentage Match | Blacklist IOC | Chain | Consecutive Growth | Difference | Diff Multi Pattern | Find Match | Logical | Unique Long Term |
|---|---|---|---|---|---|---|---|---|---|---|---|---|---|---|---|---|---|---|---|---|
realert |
Opt | Opt | Opt | Opt | Opt | Opt | Opt | Opt | Opt | Opt | Opt | Opt | n/h | Opt | Opt | n/h | Opt | Opt | Opt | Opt |
compare_key |
Req | Req | Req | Req | Req | Req | Req | Req | ||||||||||||
blacklist |
Req | |||||||||||||||||||
whitelist |
Req | |||||||||||||||||||
ignore_null |
Req | Req | ||||||||||||||||||
query_key |
Req | Opt | Opt | Opt | Req | Req | Req | |||||||||||||
num_events |
Req | |||||||||||||||||||
timeframe |
Opt | Req | Req | Req | Req | Req | Req | Req | ||||||||||||
spike_height |
Req | Req | ||||||||||||||||||
spike_type |
Req | Req | ||||||||||||||||||
threshold |
Req | |||||||||||||||||||
fields |
Req* | |||||||||||||||||||
cardinality_field |
Req | |||||||||||||||||||
metric_agg_key |
Req | Req | ||||||||||||||||||
metric_agg_type |
Req | Req | ||||||||||||||||||
match_bucket_filter |
Req | |||||||||||||||||||
use_count_query |
Opt | Opt | Opt | Opt | ||||||||||||||||
use_terms_query |
Opt | Opt | Opt | Opt | Opt | |||||||||||||||
terms_size |
Opt | Opt | Opt | Opt | Opt | |||||||||||||||
attach_related |
Opt | |||||||||||||||||||
alert_on_new_data |
Opt | Opt | ||||||||||||||||||
threshold_ref |
Opt | Opt | ||||||||||||||||||
threshold_cur |
Opt | Opt | ||||||||||||||||||
field_value |
Opt | |||||||||||||||||||
forget_keys |
Opt | |||||||||||||||||||
terms_window_size |
Opt | |||||||||||||||||||
alert_on_missing_field |
Opt | |||||||||||||||||||
window_step_size |
Opt | |||||||||||||||||||
use_keyword_postfix |
Opt | |||||||||||||||||||
max_cardinality |
Opt | |||||||||||||||||||
min_cardinality |
Opt | |||||||||||||||||||
bucket_interval |
Opt | Opt | Opt | |||||||||||||||||
use_run_every_query_size |
Opt | Opt | ||||||||||||||||||
allow_buffer_time_overlap |
Opt | Opt | ||||||||||||||||||
sync_bucket_interval |
Opt | Opt | ||||||||||||||||||
metric_format_string |
Opt | |||||||||||||||||||
metric_agg_script |
Opt | Opt | ||||||||||||||||||
percentile_range |
Opt | Opt | ||||||||||||||||||
max_threshold |
Opt | |||||||||||||||||||
min_threshold |
Opt | |||||||||||||||||||
min_doc_count |
Opt | Opt | ||||||||||||||||||
min_percentage |
Opt | |||||||||||||||||||
max_percentage |
Opt | |||||||||||||||||||
min_denominator |
Opt | |||||||||||||||||||
percentage_format_string |
Opt | |||||||||||||||||||
blacklist-ioc |
Req | |||||||||||||||||||
operator |
Req | Req | ||||||||||||||||||
rule_names |
Req | Req | ||||||||||||||||||
correlate_body |
Req | Req | ||||||||||||||||||
start_value |
Req | |||||||||||||||||||
end_value |
Req | |||||||||||||||||||
invert |
Req | |||||||||||||||||||
no_of_timeperiods |
Req | |||||||||||||||||||
threshold_pct |
Req | Req | ||||||||||||||||||
delta_min |
Req | |||||||||||||||||||
agg_min |
Req | Req | ||||||||||||||||||
pattern_key1 |
Req | |||||||||||||||||||
pattern_key2 |
Req | |||||||||||||||||||
split_results |
Opt | |||||||||||||||||||
count |
Opt | |||||||||||||||||||
corelate_field_names |
Opt | Opt | ||||||||||||||||||
overwrite_timestamp_field |
Opt | Opt | ||||||||||||||||||
skip_old_data_collection |
Opt | Opt | ||||||||||||||||||
time_period |
Opt | Opt | ||||||||||||||||||
compare_key1 |
Req* | |||||||||||||||||||
compare_key2 |
Req* | |||||||||||||||||||
pattern_agg_type1 |
Opt | |||||||||||||||||||
pattern_agg_type2 |
Opt | |||||||||||||||||||
pattern_filter1 |
Opt | |||||||||||||||||||
pattern_filter2 |
Opt | |||||||||||||||||||
pattern_qk1 |
Opt | |||||||||||||||||||
pattern_qk2 |
Opt |
* fields for New Term is technically optional in the schema but the engine enforces at runtime that either fields or query_key is set, omitting both causes rule load failure.
* compare_key1 / compare_key2 for Diff Multi Pattern are optional when pattern_agg_type1 / pattern_agg_type2 is count, but required for any other aggregation type (default avg). Rule load fails otherwise.
corelate_field_names is spelled with a single r in the rule engine. Use this exact spelling, correlate_field_names silently disables correlation.
Spike Aggregation (SpkA) is defined in source and schema but is not selectable in the Alert Rule Wizard, use raw YAML or the API.
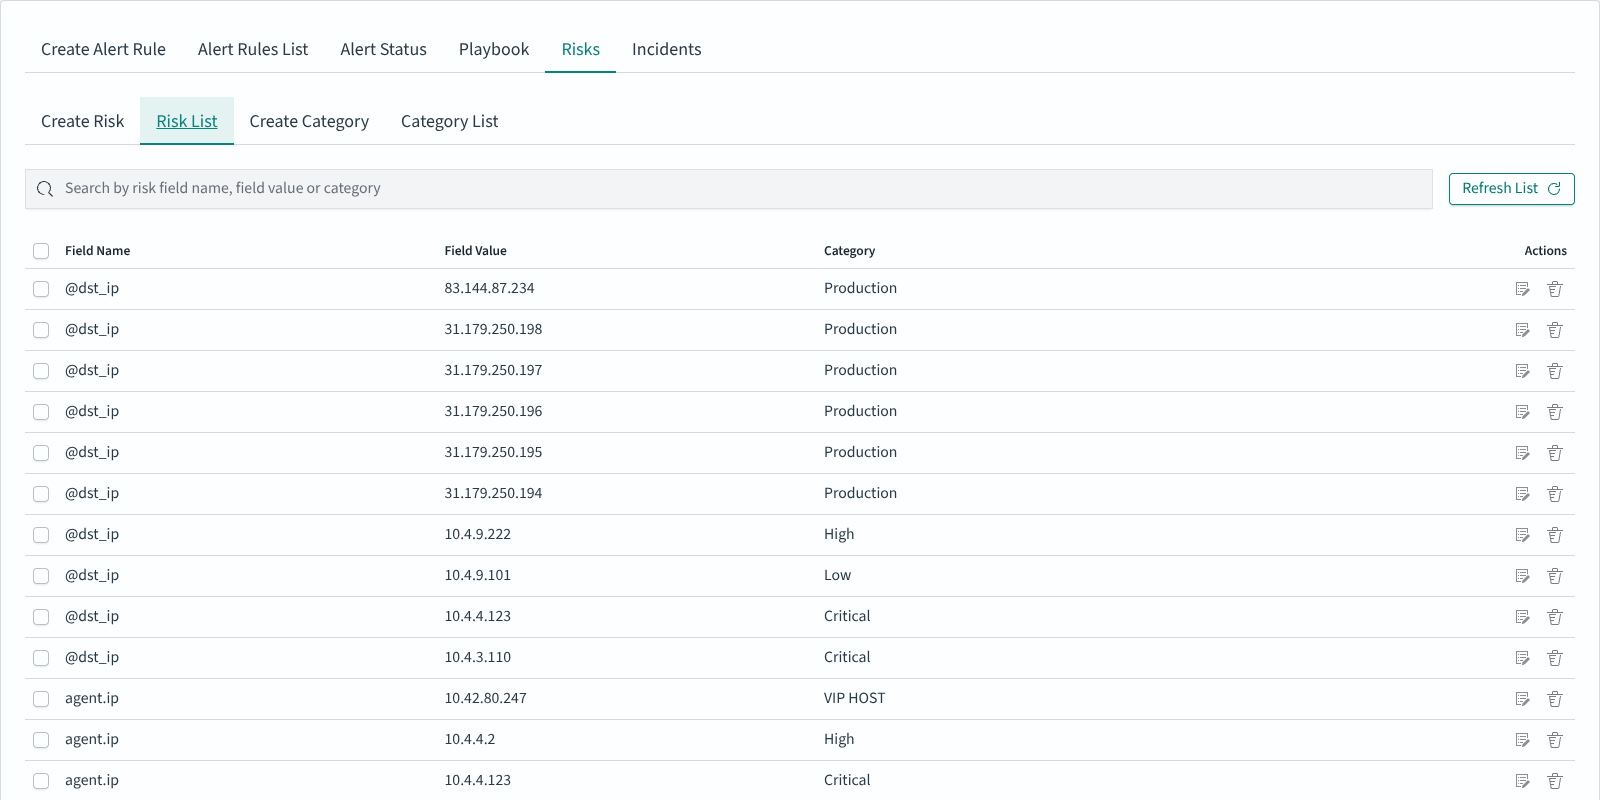
Risk Framework
The Risk Framework assigns a numeric risk score to every incident by mapping field values from the event to user-defined risk Categories. The Risks tab under Alerts is where these mappings live.
Navigation: ELS Console → SIEM → Alerts → Risks
The tab has four sub-tabs:
Sub-tab |
Purpose |
|---|---|
Create Risk |
Assign one or many field values to a category |
Risk List |
Browse, edit and delete existing (field name, field value, category) assignments |
Create Category |
Define a new risk category and its numeric value |
Category List |
Browse and edit existing categories |
Risk Categories
A Risk Category is a named bucket with a numeric weight. Shipped categories commonly include Production, High, Low, Critical, VIP HOST; installations can define additional categories under Create Category.
Defining risk values
Open Risks → Create Risk.
Pick an Index Pattern and click Read Fields to load the fields.
Choose the field whose values should carry risk (for example
agent.ip,@dst_ip,user.name).Set the Time Range (default: last 15 minutes) and click Read Values to load values actually seen in that range.
Select one or many values, pick the Category (or
uncategorized), and click Submit.
The result appears in Risk List:
Scoring incidents
The risk score for a matched event is computed as follows:
The rule’s Risk Key is read from the YAML as
risk_key. It can be a single field name or a comma-separated list of field names.For every risk key field, the event’s value is looked up in the Risk List (index defined by
writeback_index; defaultalert). The lookup returns the category id, and the category id resolves to a numericcategoryvalue.The collected values are aggregated according to Multiple risks aggregation, stored in YAML as
risk_key_aggregationwith uppercase values:MIN,MAX,SUM,AVG. The GUI also shows acustomoption, a value not recognised by the aggregator falls through toMAX, which is the same behaviour as not settingrisk_key_aggregationat all.The aggregate is divided by 100, multiplied by the rule’s Risk boost [%] (YAML:
rule_importance) also divided by 100, then multiplied by 100. In plain terms:risk = aggregate × rule_importance ÷ 100. With the defaultrule_importance = 100the final score equals the aggregate category value.
The final number is stored on the incident record (in the alert writeback index by default) and shown in the Risk column on the Incidents tab.
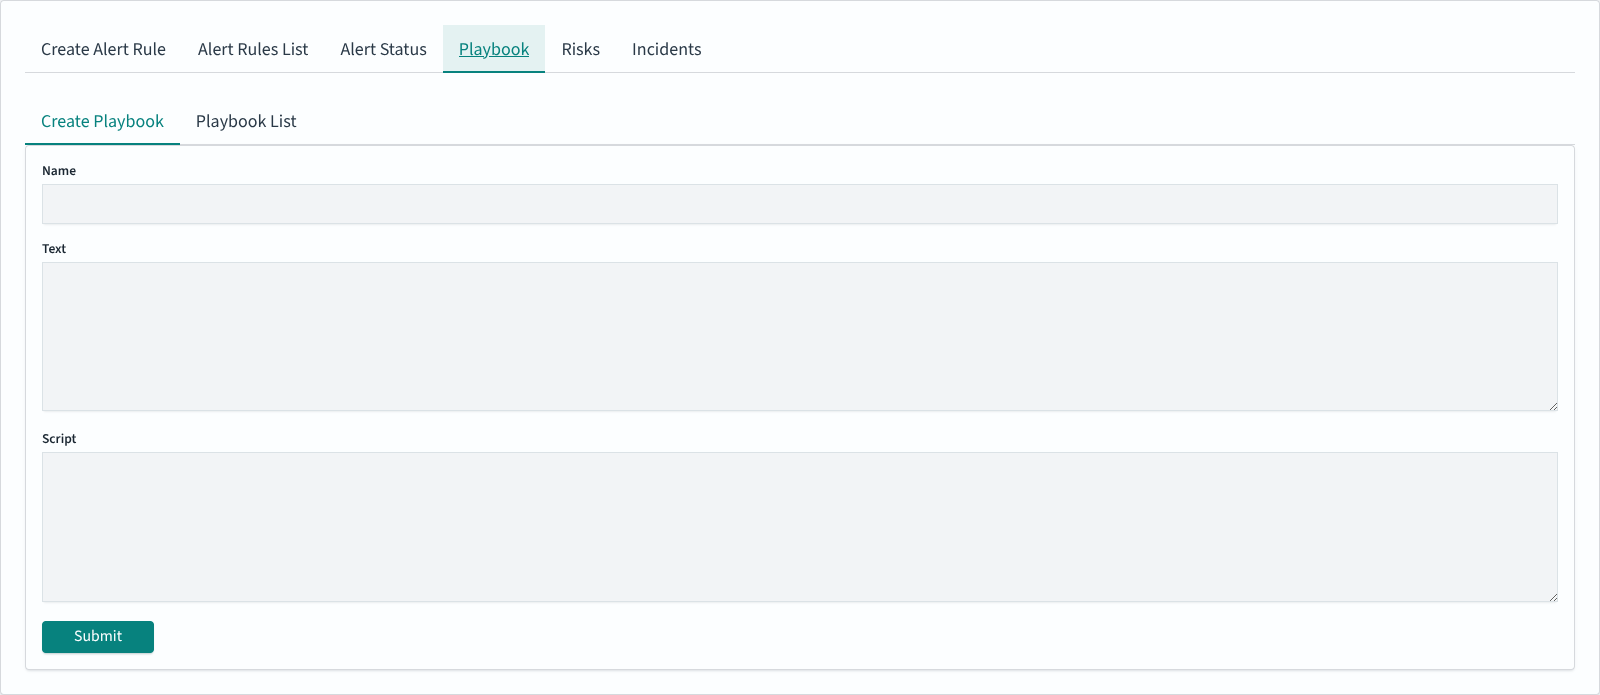
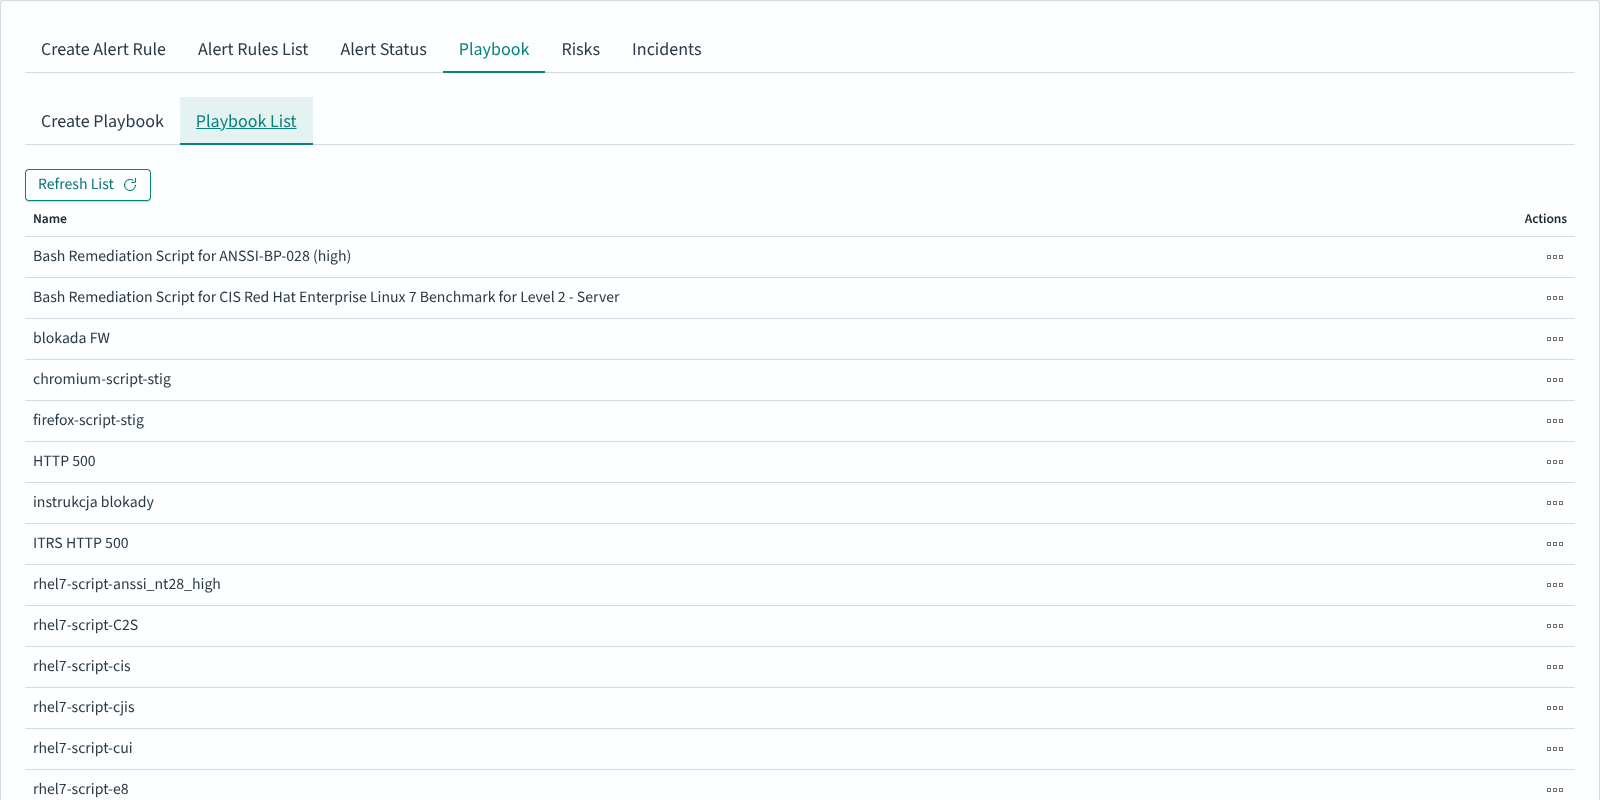
Playbooks
Playbooks are reusable response procedures attached to alert rules. Each playbook pairs a human-readable description with an optional executable script.
Navigation: ELS Console → SIEM → Alerts → Playbook
Creating a playbook
The Create Playbook sub-tab accepts three fields:
Field |
Purpose |
|---|---|
Name |
Identifier shown in the Playbook list and in the Available playbooks chooser |
Text |
Runbook content for the operator (Markdown-friendly, shown verbatim alongside a triggered incident) |
Script |
Optional script body displayed as read-only text alongside the incident. Typical uses include Bash remediation snippets for CIS or ANSSI benchmarks (see the shipped |
Click Submit to save. The new entry appears in Playbook List:
Attaching playbooks to an alert rule
In Create Alert Rule, enable the Playbooks toggle, then use the arrow icons to move playbooks from Available playbooks into Rule’s playbooks. Multiple playbooks can be attached. When the rule triggers an incident, the attached playbooks are shown alongside the incident in the Incidents tab for the operator to review and act on. Playbook scripts are not executed automatically by the system.
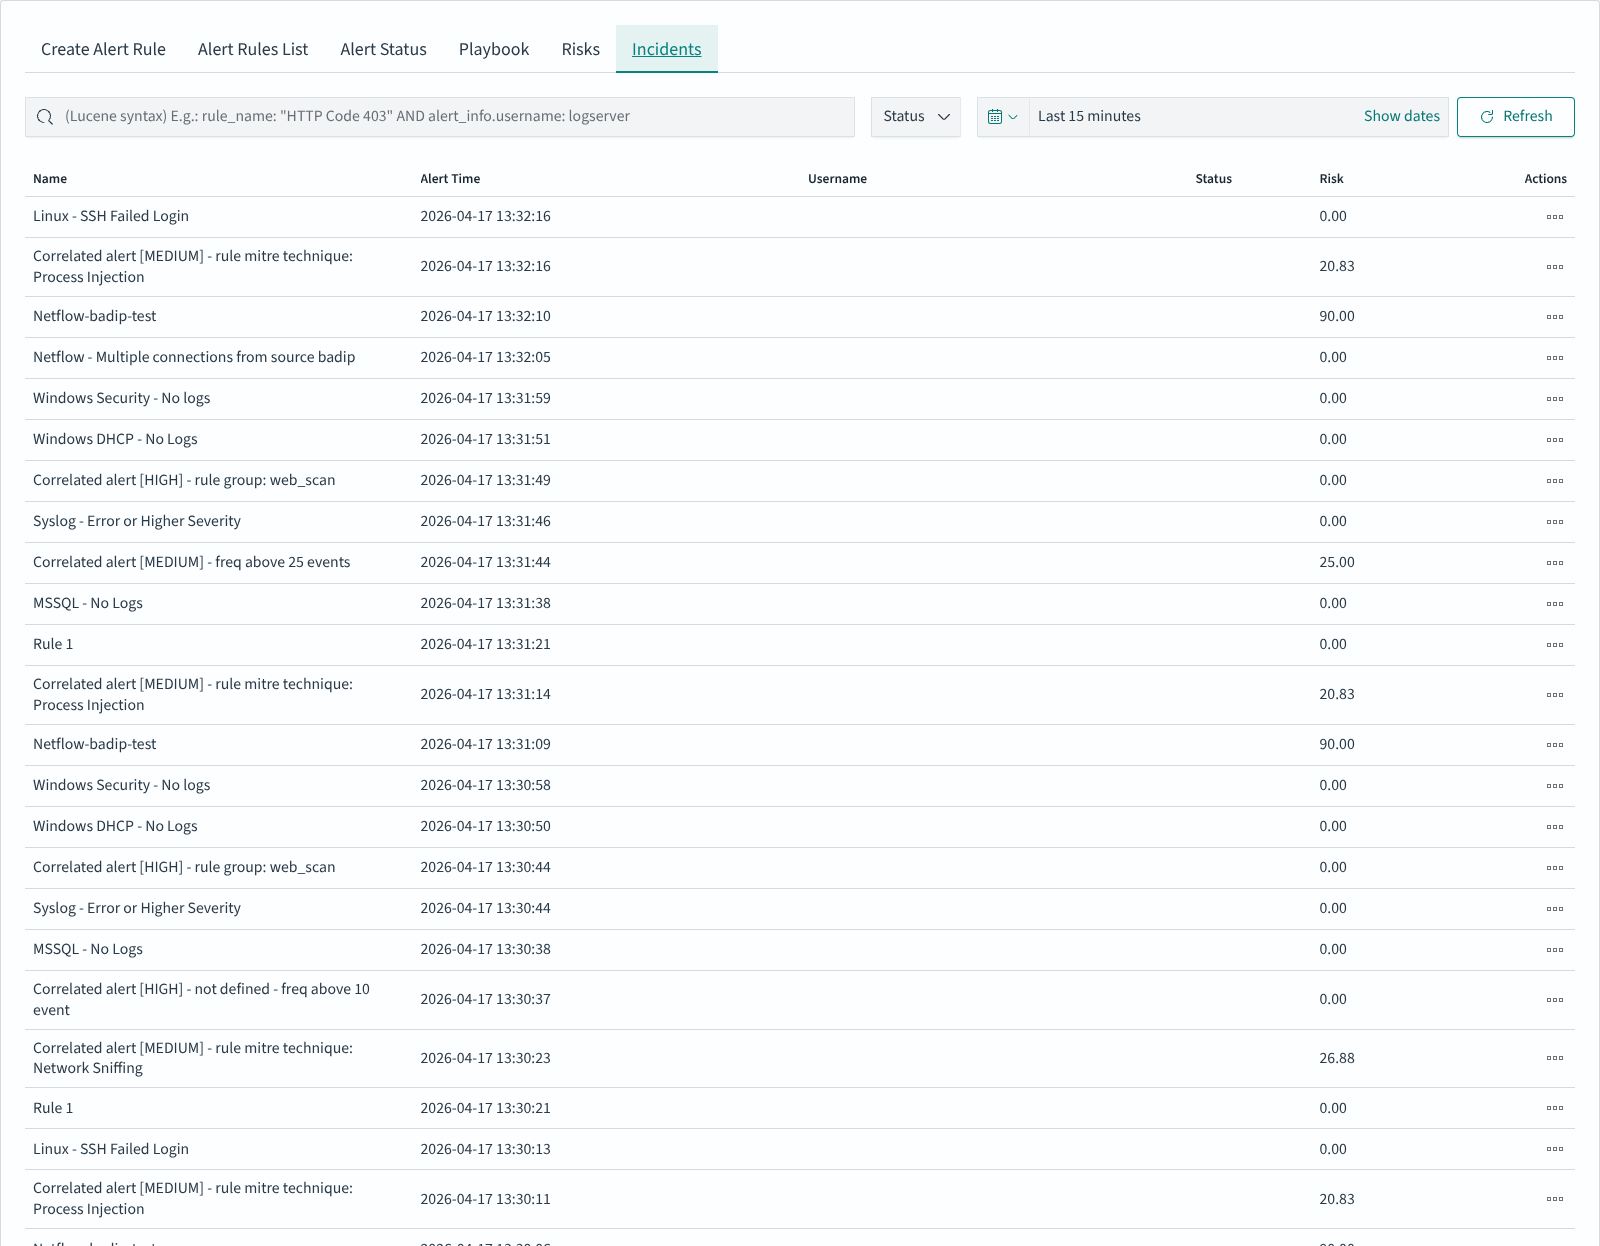
Incidents
The Incidents tab lists triggered alerts in reverse chronological order. It is the operator-facing view: what fired, when, who is responsible, and how much risk the incident carries.
Navigation: ELS Console → SIEM → Alerts → Incidents
The table columns:
Column |
Description |
|---|---|
Name |
Rule name that triggered the incident |
Alert Time |
Timestamp of the trigger |
Username |
Field value from the event used as actor (often |
Status |
Incident handling state, filter via the Status dropdown at the top |
Risk |
Calculated risk score (see Risk Framework) |
Actions |
Per-row icon menu: open the incident, view attached playbooks, change status |
The search field accepts Lucene syntax and is evaluated against the alert writeback index (default name alert, configurable in /opt/alert/config.yaml via writeback_index); the date-range picker on the right bounds the result set (default: last 15 minutes). Use Refresh to re-fetch.
Working with Pre-built Alert Groups
Navigation: ELS Console → SIEM → Alert Rules
Energy Logserver ships with a library of pre-built alert rule groups organized by vendor, platform, and use case. These groups can be enabled selectively based on your environment.
For a rule-by-rule catalogue of the alerts each integration installs, including detection type and index pattern, see Predefined Alert Rules.
Available Groups
Vendor-specific:
Group |
Rules |
Description |
|---|---|---|
AWS |
33 |
Amazon Web Services security events |
Checkpoint |
25 |
Check Point firewall events |
Cisco ASA |
11 |
Cisco ASA firewall events |
Cisco ESA |
8 |
Cisco Email Security Appliance events |
Cisco VPN |
5 |
Cisco VPN connection events |
F5 |
3 |
F5 load balancer events |
FireEye |
16 |
FireEye threat detection events |
Forcepoint |
6 |
Forcepoint web/email security events |
Fudo |
5 |
Fudo PAM privileged access events |
Infoblox |
14 |
Infoblox DNS/DHCP/IPAM events |
Juniper |
5 |
Juniper network device events |
McAfee |
6 |
McAfee endpoint security events |
Mikrotik |
5 |
MikroTik router events |
QualysGuard |
6 |
Qualys vulnerability scanner events |
Infrastructure:
Group |
Rules |
Description |
|---|---|---|
Cluster-Health |
25 |
ELS Data Node cluster health monitoring |
HTTP |
9 |
HTTP traffic anomaly detection |
Switch |
10 |
Network switch events |
Operating systems and services:
Group |
Rules |
Description |
|---|---|---|
Linux |
25 |
Linux system security events |
Microsoft Windows |
1 |
General Windows security events |
Microsoft Windows DHCP |
11 |
Windows DHCP server events |
Microsoft Windows DNS |
12 |
Windows DNS server events |
Exchange |
6 |
Microsoft Exchange mail server events |
Microsoft MsSQL |
6 |
Microsoft SQL Server events |
MySQL |
10 |
MySQL database events |
PostgreSQL |
11 |
PostgreSQL database events |
Postfix |
6 |
Postfix mail server events |
Squid |
7 |
Squid proxy events |
Security and correlation:
Group |
Rules |
Description |
|---|---|---|
Correlated |
30 |
Cross-source correlated security events |
Empowered AI |
31 |
AI-driven anomaly detection rules |
Ransomware |
8 |
Ransomware activity detection |
Using Pre-built Groups
Browse the available groups in the Alert Rules List.
Expand a group to review included rules.
Enable or disable individual rules as needed.
Customize rule thresholds and parameters if required.
Save changes and monitor alert activity.
Escalation and Recovery
Escalate
The escalate_users parameter assigns alert notifications to a specific user or group of users. The escalate_after parameter escalates the notification recipient after a defined period of time.
Example:
escalate_users: ["user1", "user2"]
escalate_after:
  days: 2
In this example, user1 and user2 receive an escalation notification two days after the initial alert.
Recovery
The recovery parameter defines an additional action to perform after the conditions that triggered the initial alert are no longer met.
recovery: true
recovery_command: "command"
Field values can be referenced in the recovery command using two syntaxes:
%{field_name}, pulls the value from the alert match (e.g.%{@timestamp_recovery})${field_name}, pulls the value from the rule definition (e.g.${name})
The @timestamp_recovery variable contains the time at which the recovery was executed.
Example:
recovery: true
recovery_command: "echo \"%{@timestamp_recovery};;${name}_${ci};${alert_severity};RECOVERY\" >> /var/log/em_integration/events.log"
To send a recovery email notification:
recovery: true
recovery_command: "mail -s 'Recovery Alert for rule ${name}' user@example.com < /dev/null"