User Manual
Introduction
Energy Logserver is an innovation solution allowing for centralized IT systems events. It allows for an immediate review, analysis, and reporting of system logs - the amount of data does not matter. Energy Logserver is a response to the huge demand for the storage and analysis of large amounts of data from IT systems.Energy Logserver is an innovation solution that responds to the need to effectively process large amounts of data coming from the IT environments of today’s organizations. Based on the open-source project Elasticsearch valued on the market, we have created an efficient solution with powerful data storage and searching capabilities. The System has been enriched with functionality that ensures the security of stored information, verification of users, data correlation and visualization, alerting, and reporting.
Energy Logserver project was created to centralize events of all IT areas in the organization. We focused on creating a tool that functionality is most expected by IT departments. Because an effective licensing model has been applied, the solution can be implemented in the scope expected by the customer even with a very large volume of data. At the same time, the innovation architecture allows for servicing a large portion of data, which cannot be dedicated to solutions with limited scalability.
Elasticsearch
Elasticsearch is a NoSQL database solution that is the heart of our system. Text information sent to the system, application, and system logs are processed by Logstash filters and directed to Elasticsearch. This storage environment creates, based on the received data, their respective layout in a binary form, called a data index. The Index is kept on Elasticsearch nodes, implementing the appropriate assumptions from the configuration, such as:
- Replication index between nodes,
- Distribution index between nodes.
The Elasticsearch environment consists of nodes:
- Data node - responsible for storing documents in indexes,
- Master node - responsible for the supervision of nodes,
- Client node - responsible for cooperation with the client.
Data, Master, and Client elements are found even in the smallest Elasticsearch installations, therefore often the environment is referred to as a cluster, regardless of the number of nodes configured. Within the cluster, Elasticsearch decides which data portions are held on a specific node.
Index layout, their name, and set of fields are arbitrary and depend on the form of system usage. It is common practice to put data of a similar nature to the same type of index that has a permanent first part of the name. The second part of the name often remains the date the index was created, which in practice means that the new index is created every day. This practice, however, is conventional and every index can have its rotation convention, name convention, construction scheme, and its own set of other features. As a result of passing the document through the
The Indexes are built with elementary parts called shards. It is good practice to create Indexes with the number of shards that is the multiple of the Elasticsearch data nodes number. Elasticsearch in the 7.x version has a new feature called Sequence IDs that guarantees more successful and efficient shard recovery. \
Elasticsearch uses mapping to describe the fields or properties that documents of that type may have. Elasticsearch in the 7.x version restricts indices to a single type.
Kibana
Kibana lets you visualize your Elasticsearch data and navigate the Elastic Stack. Kibana gives you the freedom to select the way you give shape to your data. And you don’t always have to know what you’re looking for. Kibana core ships with the classics: histograms, line graphs, pie charts, sunbursts, and more. Plus, you can use Vega grammar to design your visualizations. All leverage the full aggregation capabilities of Elasticsearch. Perform advanced time series analysis on your Elasticsearch data with our curated time series UIs. Describe queries, transformations, and visualizations with powerful, easy-to-learn expressions. Kibana 7.x has two new features - a new “Full-screen” mode for viewing dashboards, and a new “Dashboard-only” mode which enables administrators to share dashboards safely.
Logstash
Logstash is an open-source data collection engine with real-time pipelining capabilities. Logstash can dynamically unify data from disparate sources and normalize the data into destinations of your choice. Cleanse and democratize all your data for diverse advanced downstream analytics and visualization use cases.
While Logstash originally drove innovation in log collection, its capabilities extend well beyond that use case. Any type of event can be enriched and transformed with a broad array of input, filter, and output plugins, with many native codecs further simplifying the ingestion process. Logstash accelerates your insights by harnessing a greater volume and variety of data.
Logstash 7.x version supports native support for multiple pipelines. These pipelines are defined in a pipelines.yml file which is loaded by default. Users will be able to manage multiple pipelines within Kibana. This solution uses Elasticsearch to store pipeline configurations and allows for on-the-fly reconfiguration of Logstash pipelines.
ELK
“ELK” is the acronym for three open-source projects: Elasticsearch, Logstash, and Kibana. Elasticsearch is a search and analytics engine. Logstash is a server‑side data processing pipeline that ingests data from multiple sources simultaneously, transforms it, and then sends it to a “stash” like Elasticsearch. Kibana lets users visualize data with charts and graphs in Elasticsearch. The Elastic Stack is the next evolution of the ELK Stack.
Data source
Where does the data come from?
Energy Logserver is a solution allowing effective data processing from the IT environment that exists in the organization.
The Elsasticsearch engine allows the building database in which large amounts of data are stored in ordered indexes. The Logstash module is responsible for loading data into Indexes, whose function is to collect data on specific TCP/UDP ports, filter them, normalize them, and place them in the appropriate index. Additional plugins, that we can use in Logstash reinforce the work of the module and increase its efficiency, enabling the module to quickly interpret data and parse it.
Below is an example of several of the many available Logstash plugins:
exec - receive an output of the shell function as an event;
imap - read email from IMAP servers;
jdbc - create events based on JDC data;
jms - create events from Jms broker;
Both Elasticsearch and Logstash are free Open-Source solutions.
More information about the Elasticsearch module can be found at: https://github.com/elastic/elasticsearch
List of available Logstash plugins: https://github.com/elastic/logstash-docs/tree/master/docs/plugins
System services
For proper operation, Energy Logserver requires starting the following system services:
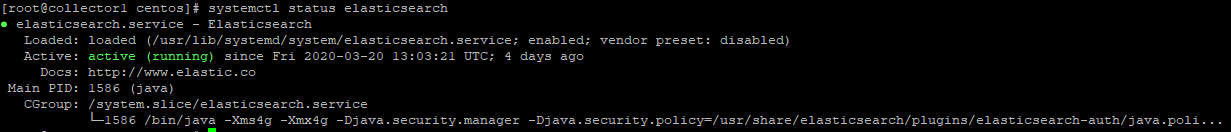
- elasticsearch.service - we can run it with a command:
systemctl start elasticsearch.service
we can check its status with a command:
systemctl status elasticsearch.service
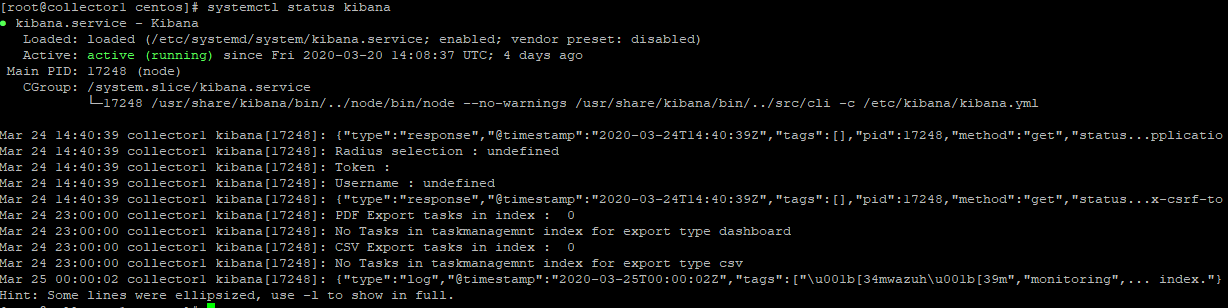
- kibana.service - we can run it with a command:
systemctl start kibana.service
we can check its status with a command:
systemctl status kibana.service
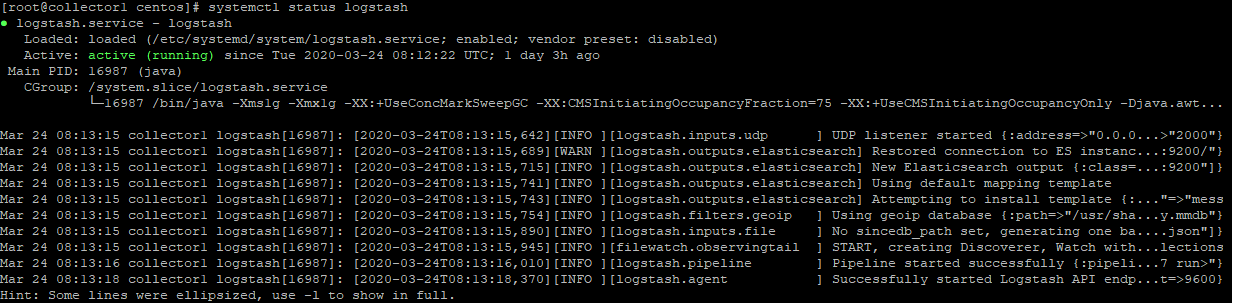
- logstash.service - we can run it with a command:
systemctl start logstash.service
we can check its status with a command:
systemctl status logstash.service
First login
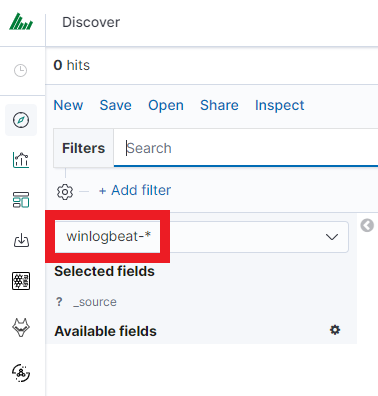
If you log in to Energy Logserver for the first time, you must specify the Index to be searched. We have the option of entering the name of your index, indicating a specific index from a given day, or using the asterisk () to indicate all of them matching a specific index pattern. Therefore, to start working with the Energy Logserver application, we log in to it (by default the user: logserver/password:logserver).
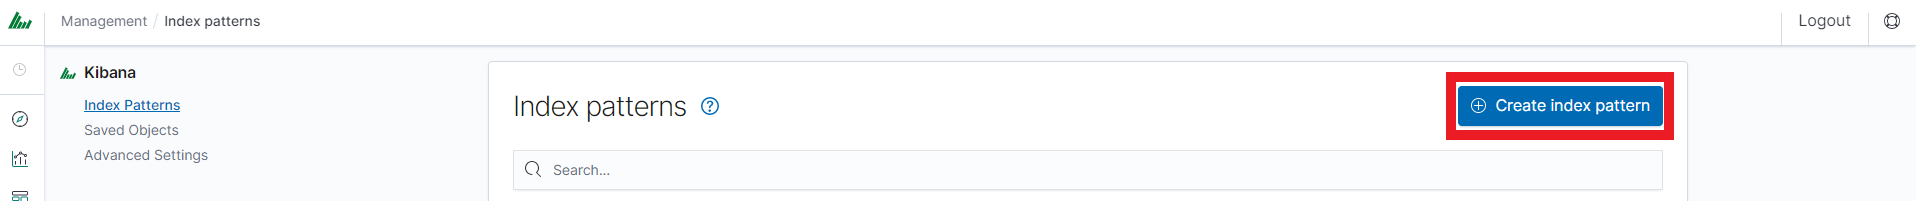
After logging in to the application click the button “Set up index pattern” to add a new index pattern in Kibana:
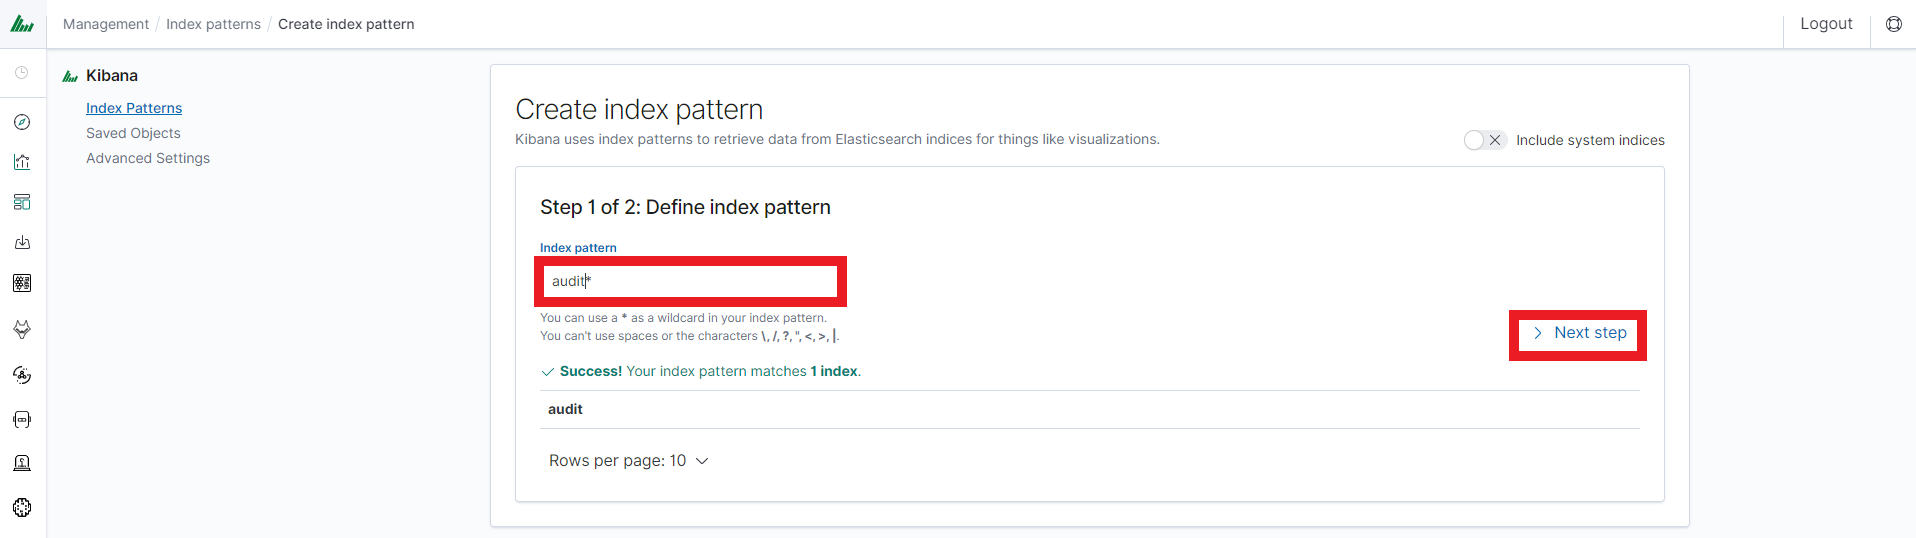
In the “Index pattern” field enter the name of the index or index pattern (after confirming that the index or sets of indexes exist) and click the “Next step” button.
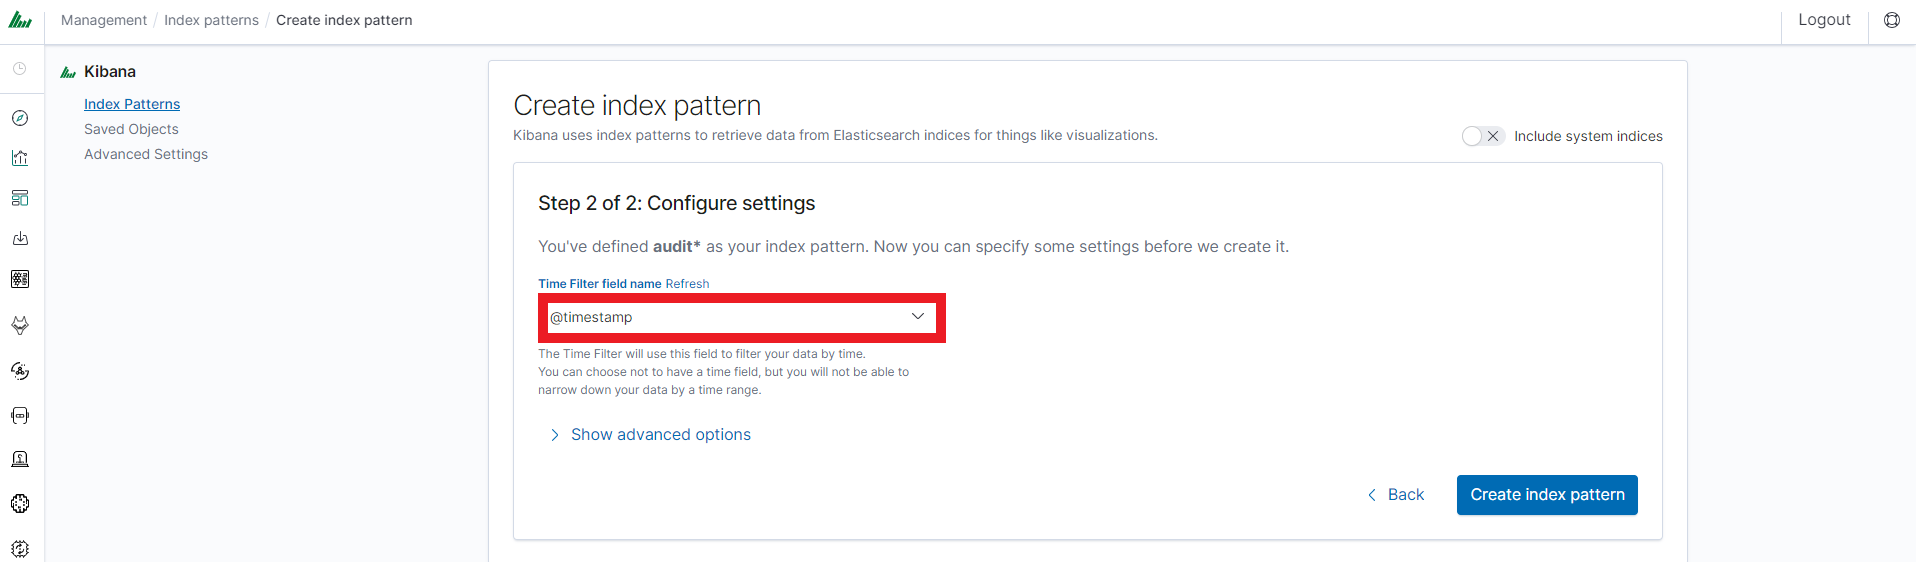
In the next step, from a drop-down menu select the “Time filter field name”, after which individual event (events) should be sorted. By default the timestamp is set, which is the time of occurrence of the event, but depending on the preferences. It may also be the time of the indexing or other selected based on the fields indicated on the event.
At any time, you can add more indexes or index patterns by going to the main tab selecting „Management” and next selecting „Index Patterns”.
Index selection
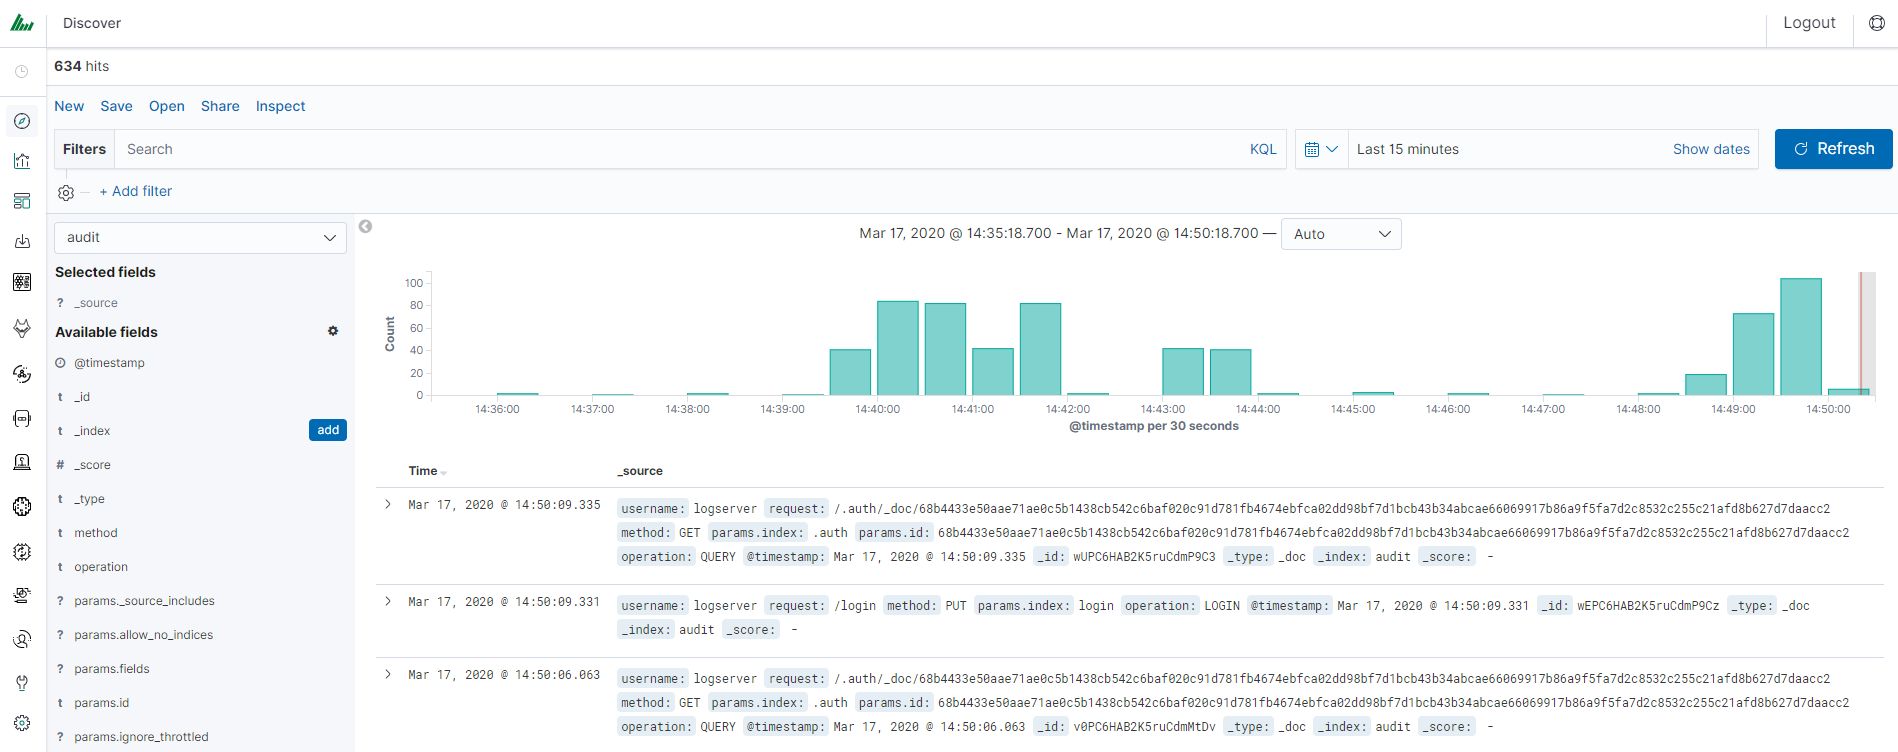
After logging into Energy Logserver, you will be going to the „Discover” tab, where you can interactively explore your data. You have access to every document in every index that matches the selected index patterns.
If you want to change the selected index, drop-down menu with the name of the current object in the left panel. Clicking on the object from the expanded list of previously created index patterns will change the searched index.
Discovery
Time settings and refresh
In the upper right corner, there is a section that defines the range of time that Energy Logserver will search in terms of conditions contained in the search bar. The default value is the last 15 minutes.
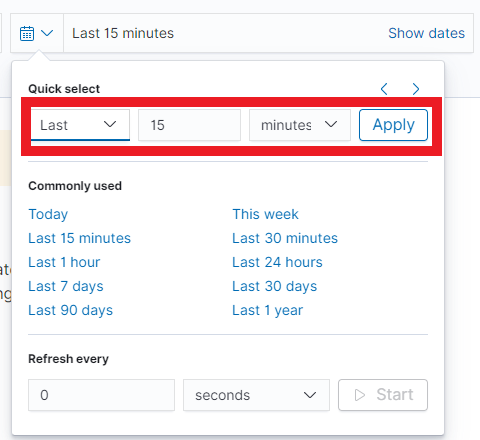
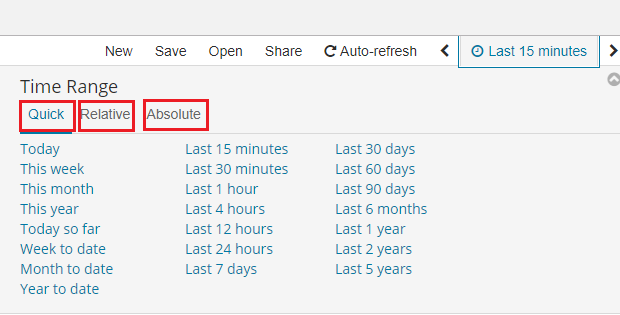
After clicking this selection, we can adjust the scope of the search by selecting one of the three tabs in the drop-down window:
- Quick: contains several predefined ranges that should be clicked.
- Relative: in this window specify the day from which Energy Logserver should search for data.
- Absolute: using two calendars we define the time range for which the search results are to be returned.
Fields
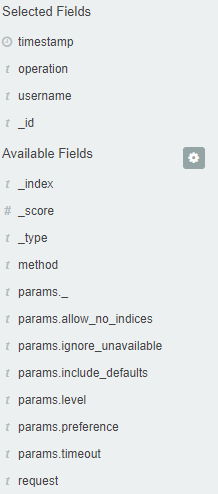
Energy Logserver in the body of searched events, recognize fields
that can be used to create more precision queries. The extracted
fields are visible in the left panel. They are divided into three types:
timestamp, marked on the clock icon; text, marked with the letter “t” , and digital, marked with a hashtag
 .
.
Pointing to them and clicking on an icon , they are automatically transferred to the „Selected Fields” column and in the place of events, a table with selected columns is created regularly. In the “Selected Fields” selection you can also delete specific fields from the table by clicking
 on the selected element.
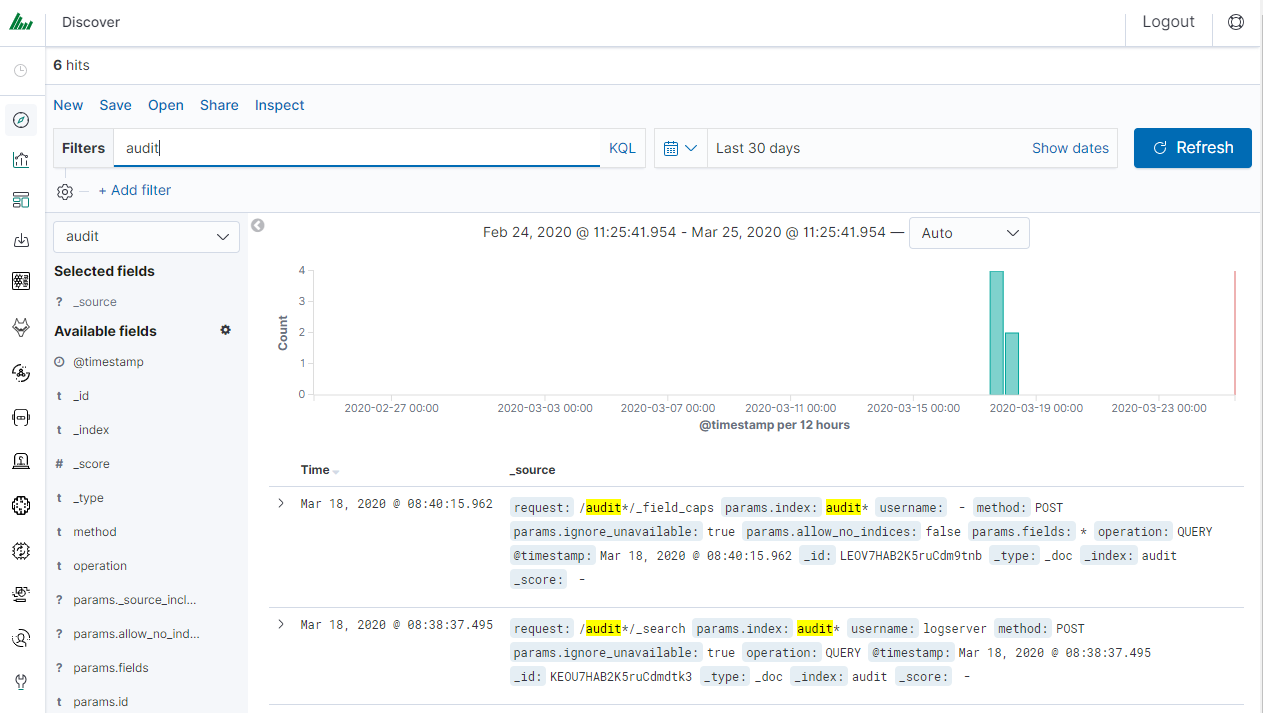
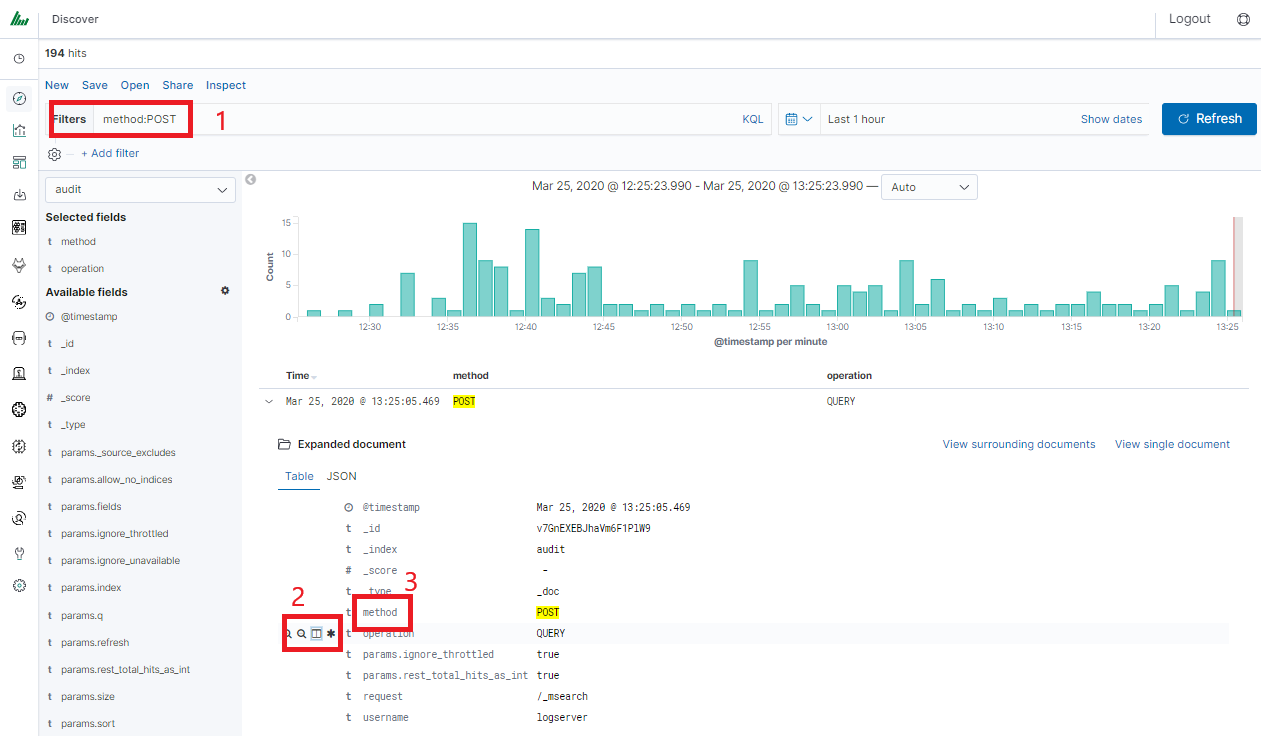
Filtering and syntax building
We use the query bar to search for interesting events. For example, after entering the word „error”, all events that contain the word will be displayed, additional highlighting them with a yellow background.
Syntax
Fields can be used similarly by defining conditions that interest us. The syntax of such queries is:
fields_name:<fields_value>
Example:
status:500
This query will display all events that contain the „status” fields with a value of 500.
Filters
The field value does not have to be a single, specific value. For digital fields we can specify a range in the following scheme:
fields_name:[<range_from TO <range_to]
Example:
status:[500 TO 599]
This query will return events with status fields that are in the range 500 to 599.
Operators
The search language used in Energy Logserver allows to you use logical operators „AND”, „OR” and „NOT”, which are key and necessary to build more complex queries.
AND is used to combine expressions, e.g.
error AND "access denied". If an event contains only one expression or the worderroranddeniedbut not the word access, then it will not be displayed.OR is used to search for the events that contain one OR other expression, e.g.
status:500 OR denied. This query will display events that contain the word „denied” or a status field value of 500. Energy Logserver uses this operator by default, so query„status:500" "denied"would return the same results.NOT is used to exclude the following expression e.g. „status:[500 TO 599] NOT status:505” will display all events that have a status field, and the value of the field is between 500 and 599 but will eliminate from the result events whose status field value is exactly 505.
The above methods can be combined by building even more complex queries. Understanding how they work and joining it, is the basis for effective searching and full use of Energy Logserver.
Example of query built from connected logical operations:
status:[500 TO 599] AND („access denied" OR error) NOT status:505
Returns in the results all events for which the value of status fields are in the range of 500 to 599, simultaneously contain the word „access denied” or „error”, omitting those events for which the status field value is 505.
Wildcards
Wildcard searches can be run on individual terms, using ? to replace a single character, and * to replace zero or more characters:
qu?ck bro*
Be aware that wildcard queries can use an enormous amount of memory and perform very badly — just think how many terms need to be queried to match the query string “a* b* c*”.
Regular expressions
Regular expression patterns can be embedded in the query string by wrapping them in forward-slashes (”/”):
name:/joh?n(ath[oa]n)/
The supported regular expression syntax is explained in Regular expression syntax https://www.elastic.co/guide/en/elasticsearch/reference/7.10/regexp-syntax.html
Fuzziness
You can run fuzzy queries using the ~ operator:
quikc~ brwn~ foks~
For these queries, the query string is normalized. If present, only certain filters from the analyzer are applied. For a list of applicable filters, see Normalizers.
The query uses the Damerau-Levenshtein distance to find all terms with a maximum of two changes, where a change is the insertion, deletion, or substitution of a single character or transposition of two adjacent characters.
The default edit distance is 2, but an edit distance of 1 should be sufficient to catch 80% of all human misspellings. It can be specified as:
quikc~1
Proximity searches
While a phrase query (e.g. “john smith”) expects all of the terms in the same order, a proximity query allows the specified words to be further apart or in a different order. In the same way that fuzzy queries can specify a maximum edit distance for characters in a word, a proximity search allows us to specify a maximum edit distance of words in a phrase:
"fox quick"~5
The closer the text in a field is to the original order specified in the query string, the more relevant that document is considered to be. When compared to the above example query, the phrase “quick fox” would be considered more relevant than “quick brown fox”.
Ranges
Ranges can be specified for date, numeric, or string fields. Inclusive ranges are specified with square brackets [min TO max] and exclusive ranges with curly brackets {min TO max}.
All days in 2012:
date:[2012-01-01 TO 2012-12-31]Numbers 1..5
count:[1 TO 5]Tags between alpha and omega, excluding alpha and omega:
tag:{alpha TO omega}Numbers from 10 upwards
count:[10 TO *]Dates before 2012
date:{* TO 2012-01-01}
Curly and square brackets can be combined:
Numbers from 1 up to but not including 5
count:[1 TO 5}Ranges with one side unbounded can use the following syntax:
    age:>10
    age:>=10
    age:<10
    age:<=10
Saving and deleting queries
Saving queries enables you to reload and use them in the future.
Save query
To save the query, click on the “Save” button under the query bar:

This will bring up a window in which we give the query a name and then
click the button .
.

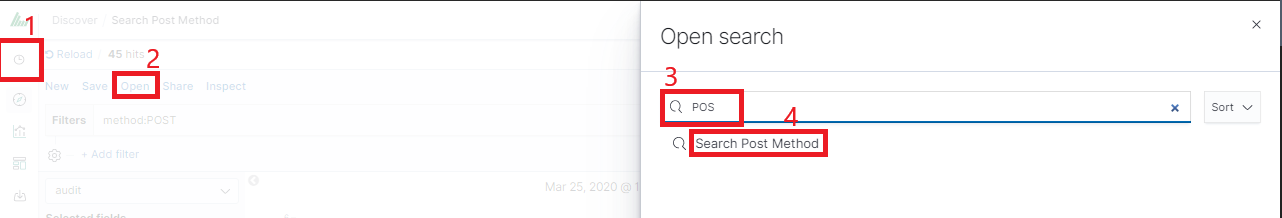
Saved queries can be opened by going to „Open” from the main menu at the top of the page, and selecting saved search from the search list:
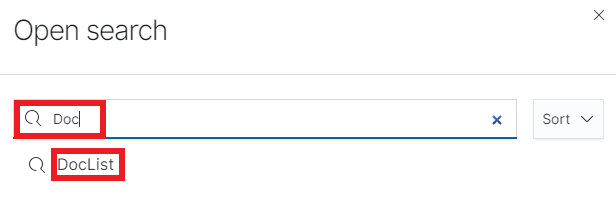
Additionally, you can use “Saved Searchers Filter..” to filter the search list.
Open query
To open a saved query from the search list, you can click on the name of the query you are interested in.
After clicking on the icon on the name of the saved query and choosing “Edit Query DSL”, we will gain access to the advanced editing mode, so that we can change the query at a lower level.
It is a powerful tool designed for advanced users, designed to modify the query and the way it is presented by Energy Logserver.
Delete query
To delete a saved query, open it from the search list, and
then click on the button .
.
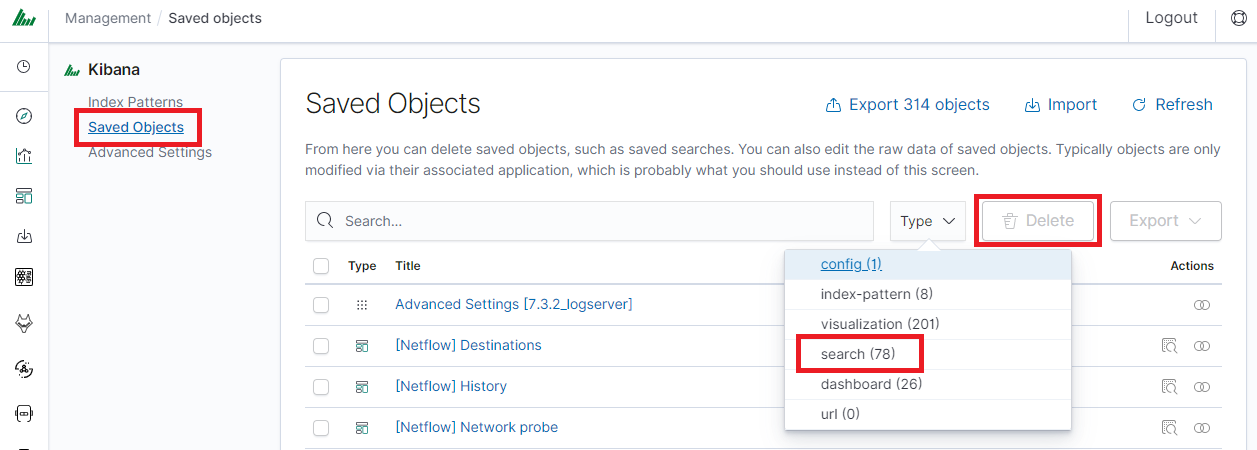
If you want to delete many saved queries simultaneously go to the “Management Object”
-> “Saved Object” -> “Searches” select it in the list (the icon to the left of the query name), and then click the “Delete” button.
From this level, you can also export saved queries in the same way. To
do this, you need to click on and choose the save location. The file will be saved in .json format. If you then want to import such a file to Energy Logserver, click on a button
 , at the top of the page and select the desired file.
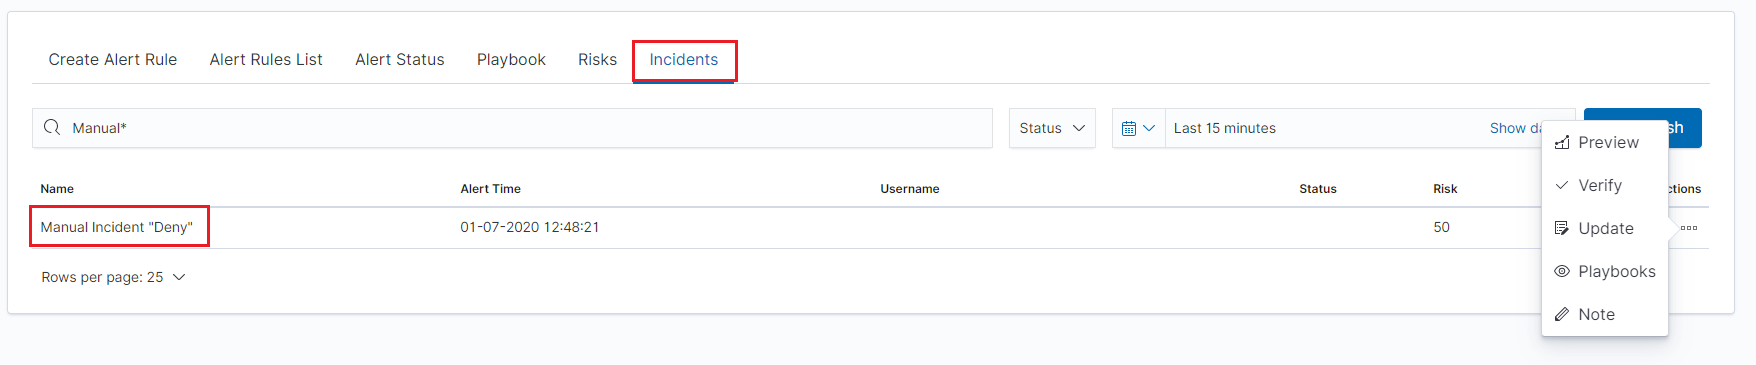
Manual incident
The Discovery module allows you to manually create incidents that are saved in the Incidents tab of the Alerts module. Manual incidents are based on search results or filtering.
For a manual incident, you can save the following parameters:
- Rule name
- Time
- Risk
- Message
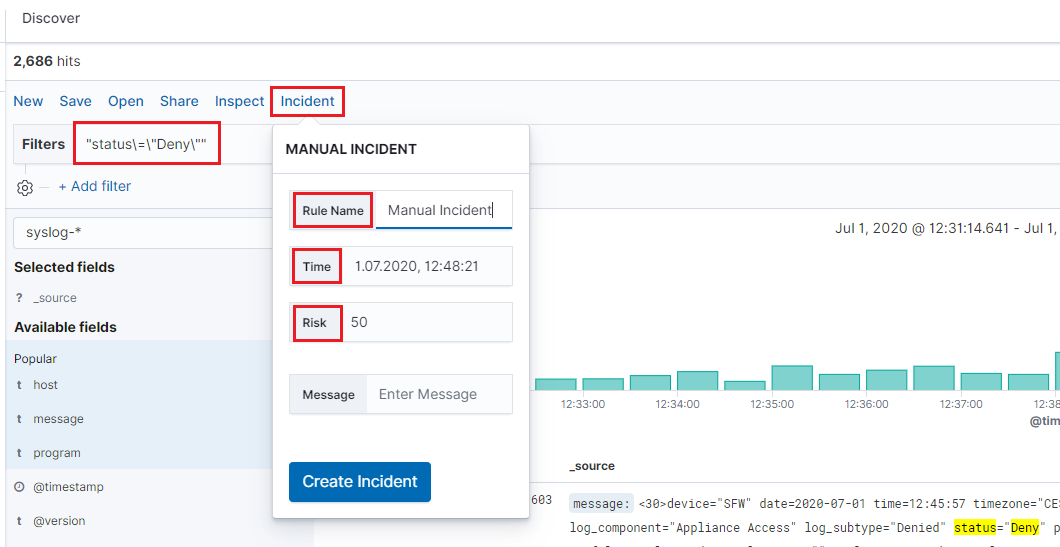
After saving the manual incident, you can go to the Incident tab in the Alert module to perform the incident handling procedure.
Change the default width of columns
To improve the readability of values in Discovery columns, you can set a minimum column width. The column width setting is in the CSS style files:
/usr/share/kibana/built_assets/css/plugins/kibana/index.dark.css
/usr/share/kibana/built_assets/css/plugins/kibana/index.light.css
To set the minimum width for the columns, e.g. 150px, add the following entry min-width: 150px in the CSS style files:
.kbnDocTableCell__dataField {
   min-width: 150px;
   white-space: pre-wrap; }
Visualizations
Visualize enables you to create visualizations of the data in your Energy Logserver indices. You can then build dashboards that display related visualizations. Visualizations are based on Energy Logserver queries. By using a series of Energy Logserver aggregations to extract and process your data, you can create charts that show you the trends, spikes, and dips.
Creating visualization
Create
To create a visualization, go to the „Visualize” tab from the main menu. A new page will appear where you can create or load visualization.
Load
To load previously created and saved visualization, you must select it from the list.
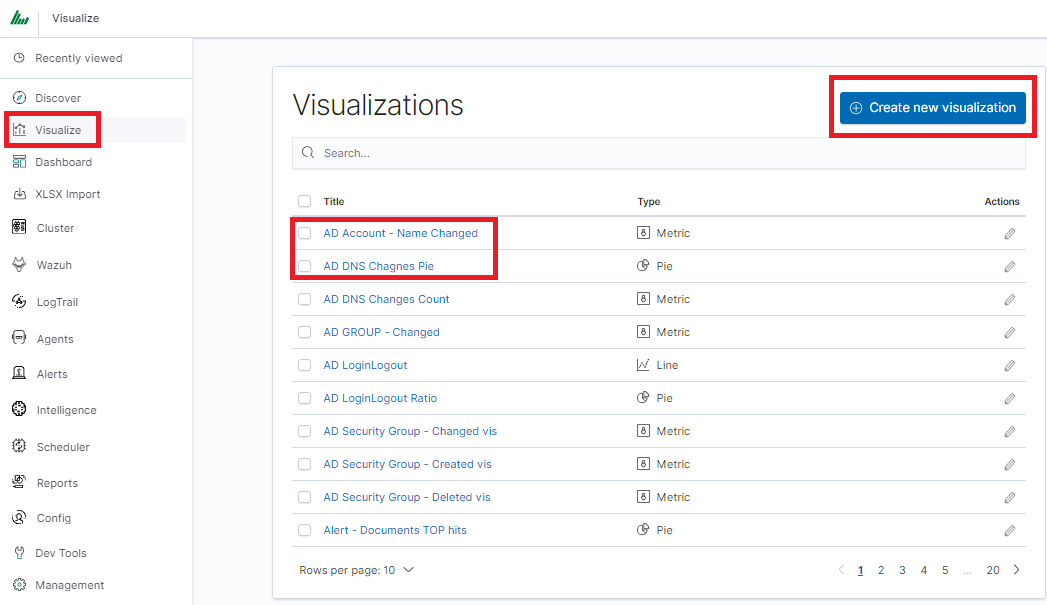
To create a new visualization, you should choose the preferred method of data presentation.
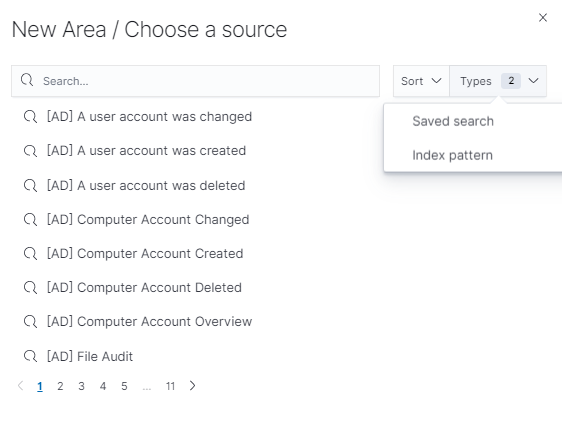
Next, specify whether the created visualization will be based on a new or previously saved query. If on a new one, select the index whose visualization should concern. If visualization is created from a saved query, you just need to select the appropriate query from the list, or (if there are many saved searches) search for them by name.
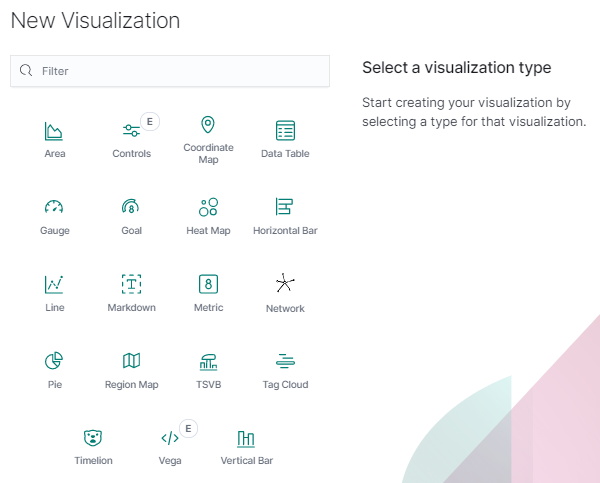
Visualization types
Before the data visualization will be created, first you have to choose the presentation method from an existing list. Currently, there are five groups of visualization types. Each of them serves different purposes. If you want to see only the current number of products sold, it is best to choose „Metric”, which presents one value.

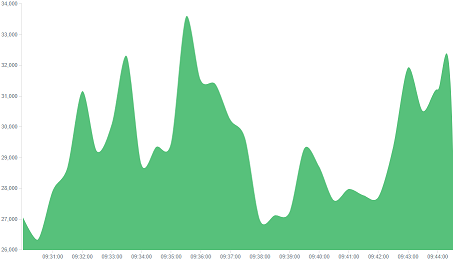
However, if we would like to see user activity trends on pages at different hours and days, a better choice will be the „Area chart”, which displays a chart with time division.
The „Markdown widget” view is used to place text e.g. information about the dashboard, explanations, and instructions on how to navigate. Markdown language was used to format the text (the most popular use is GitHub). More information and instructions can be found at this link: https://help.github.com/categories/writing-on-github/
Edit visualization and saving
Editing
Editing a saved visualization enables you to directly modify the object definition. You can change the object title, add a description, and modify the JSON that defines the object properties. After selecting the index and the method of data presentation, you can enter the editing mode. This will open a new window with an empty visualization.
At the very top, there is a bar of queries that can be edited throughout the creation of the visualization. It works in the same way as in the “Discover” tab, which means searching the raw data, but instead of the data being displayed, the visualization will be edited. The following example will be based on the „Area chart”. The visualization modification panel on the left is divided into three tabs: „Data”, “Metric & Axes” and „Panel Settings”.
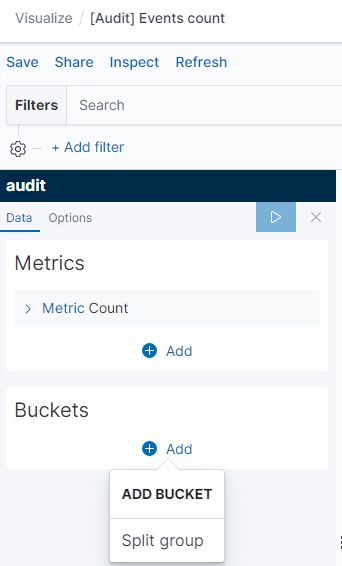
In the „Data” tab, you can modify the elements responsible for which data and how should be presented. In this tab, there are two sectors: “metrics”, in which we set what data should be displayed, and „buckets” in which we specify how they should be presented.
Select the Metrics & Axes tab to change the way each metric is shown on the chart. The data series are styled in the Metrics section, while the axes are styled in the X and Y axis sections.
In the „Panel Settings” tab, there are settings relating mainly to visual aesthetics. Each type of visualization has separate options.
To create the first graph in the char modification panel, in the „Data” tab we add X-Axis in the “buckets” sections. In „Aggregation” choose „Histogram”, in „Field” should automatically be located “timestamp” and “interval”: “Auto” (if not, this is how we set it). Click on the icon on the panel. Now our first graph should show up.
Some of the options for „Area Chart” are:
Smooth Lines - is used to smooth the graph line.

Current time marker – places a vertical line on the graph that determines the current time.
Set Y-Axis Extents – allows you to set minimum and maximum values for the Y axis, which increases the readability of the graphs. This is useful, if we know that the data will never be less than (the minimum value), or to indicate the goals of the company (maximum value).
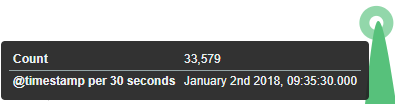
Show Tooltip – option for displaying the information window under the mouse cursor, after pointing to the point on the graph.
Saving
To save the visualization, click on the “Save” button under the query bar:
give it a name and click the button.
Load
To load the visualization, go to the “Management Object”
-> “Saved Object” -> “Visualizations” and select it from the list. From this place,
we can also go into advanced editing mode. To view the visualization
use button.
Dashboards
Dashboard is a collection of several visualizations or searches. Depending on how it is built and what visualization it contains, it can be designed for different teams e.g.:
- SOC - which is responsible for detecting failures or threats in the company;
- business - which thanks to the listings can determine the popularity of products and define the strategy of future sales and promotions;
- managers and directors - who may immediately have access to information about the performance units or branches.
Create
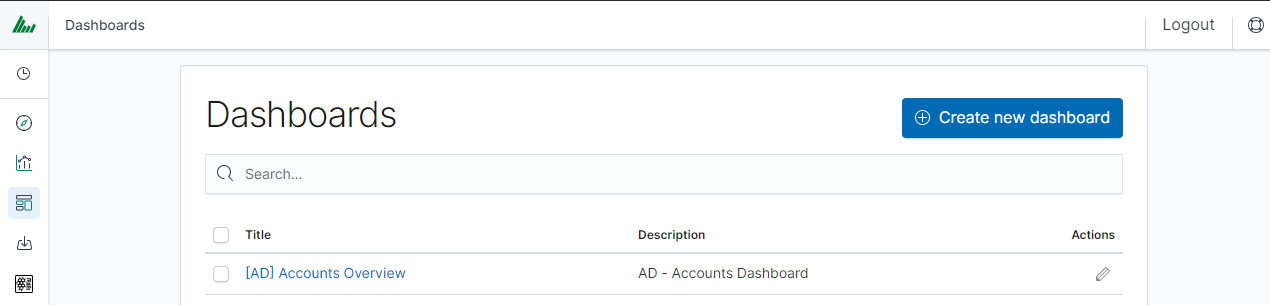
To create a dashboard from previously saved visualizations and queries, go to the „Dashboard” tab in the main menu. When you open it, a new page will appear.
Clicking on the icon “Add” at the top of the page select the “Visualization” or “Saved Search” tab.
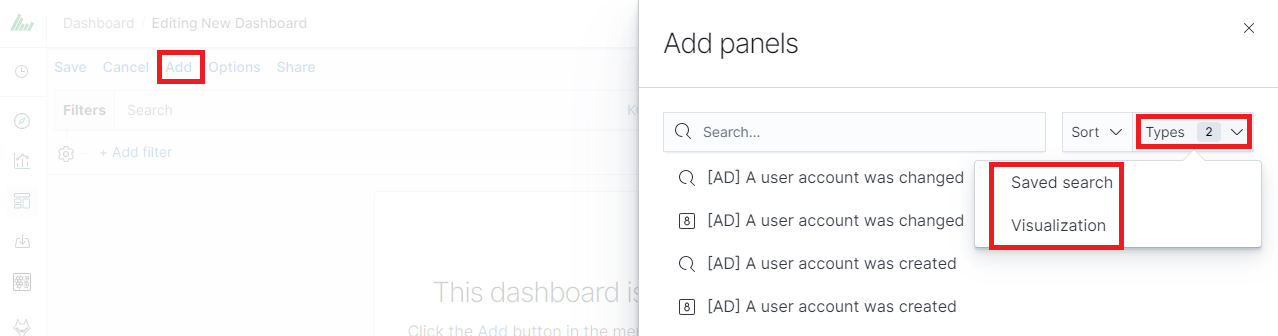
and selecting a saved query and/or visualization from the list will add them to the dashboard. If, there are a large number of saved objects, use the bar to search for them by name.
Elements of the dashboard can be enlarged arbitrarily (by clicking on the right bottom corner of the object and dragging the border) and moving (by clicking on the title bar of the object and moving it).
Saving
You may change the time period of your dashboard.
At the upper right-hand corner, you may choose the time range of your dashboard.
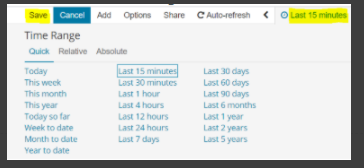
Click save and choose ‘Store time with dashboard’ if you are editing an existing dashboard. Otherwise, you may choose ‘Save as a new dashboard’ to create a new dashboard with the new time range.
To save a dashboard, click on the “Save” button at the up of the query bar and give it a name.
Load
To load the Dashboard, go to the “Management Object”
-> “Saved Object” -> “Dashboard” and select it from the list. From this place,
we can also go into advanced editing mode. To view the visualization
use button.
Sharing dashboards
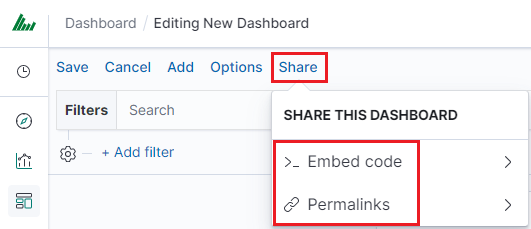
The dashboard can be shared with other Energy Logserver users as well as on any page - by placing a snippet of code. Provided that it can retrieve information from Energy Logserver.
To do this, create a new dashboard or open the saved dashboard and click on “Share” at the top of the page. A window will appear with the generated two URLs. The content of the first one “Embaded iframe” is used to provide the dashboard in the page code, and the second “Link” is a link that can be passed on to another user. There are two options for each, the first is to shorten the length of the link, and the second is to copy to the clipboard the content of the given bar.
Dashboard drill down
In the discovery tab search for a message of Your interest
Save Your search
Check Your „Shared link” and copy it
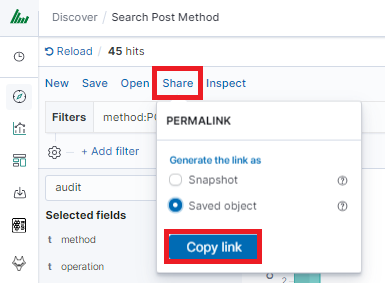
! ATTENTION ! Do not copy „?_g=()” at the end.
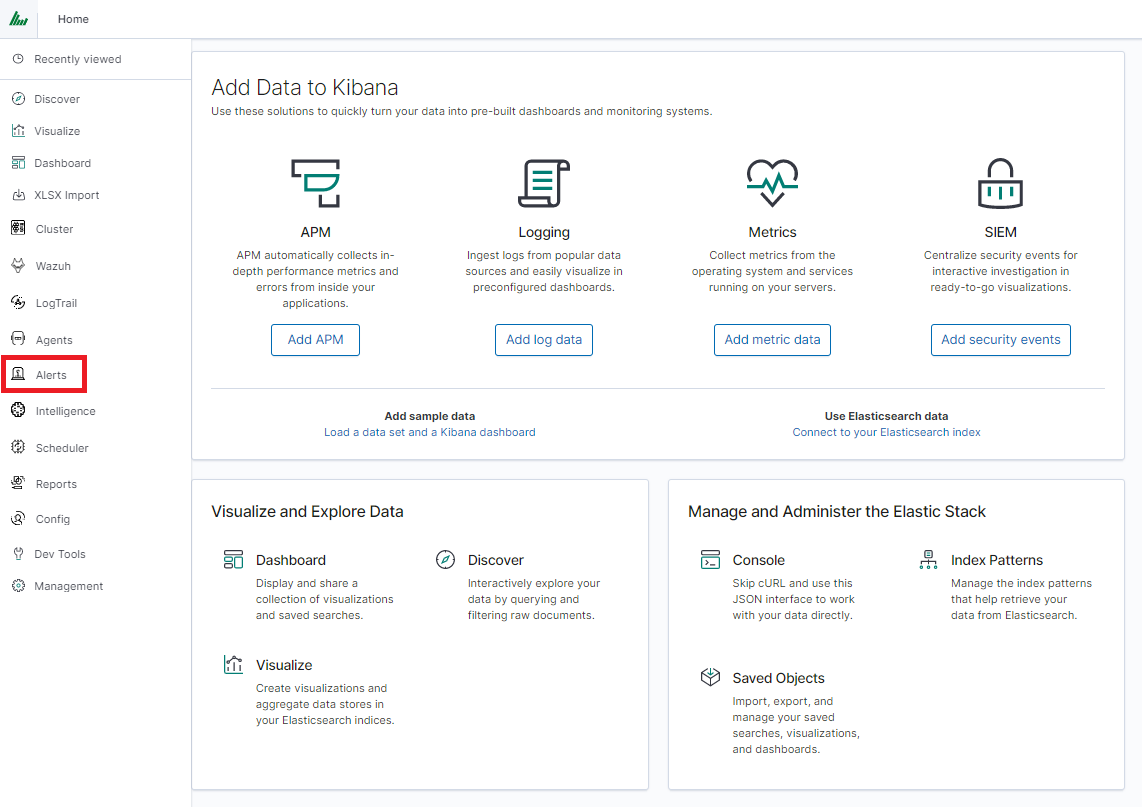
Select Alerting module
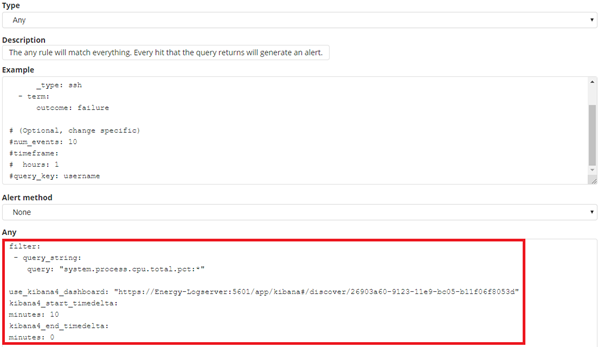
Once Alert is created use ANY frame to add the following directives:
Use_kibana4_dashboard: paste Your „shared link” here
use_kibana_dashboard: - The name of a Kibana dashboard to link to. Instead of generating a dashboard from a template, Alert can use an existing dashboard. It will set the time range on the dashboard to around the match time, upload it as a temporary dashboard, add a filter to the query_key of the alert if applicable, and put the URL to the dashboard in the alert. (Optional, string, no default).
Kibana4_start_timedelta
kibana4_start_timedelta: Defaults to 10 minutes. This option allows you to specify the start time for the generated kibana4 dashboard. This value is added in front of the event. For example,
kibana4_start_timedelta: minutes: 2
Kibana4_end_timedelta
kibana4_end_timedelta: Defaults to 10 minutes. This option allows you to specify the end time for the generated kibana4 dashboard. This value is added to the back of the event. For example,
kibana4_end_timedelta: minutes: 2
Sample:
Search for triggered alerts in the Discovery tab.
Use alert* search pattern.
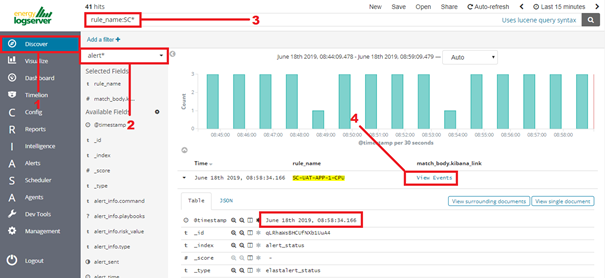
Refresh the alert that should contain url for the dashboard. Once available, the kibana_dashboard field can be exposed to dashboards giving You a real drill-down feature.
Reports
CSV Report
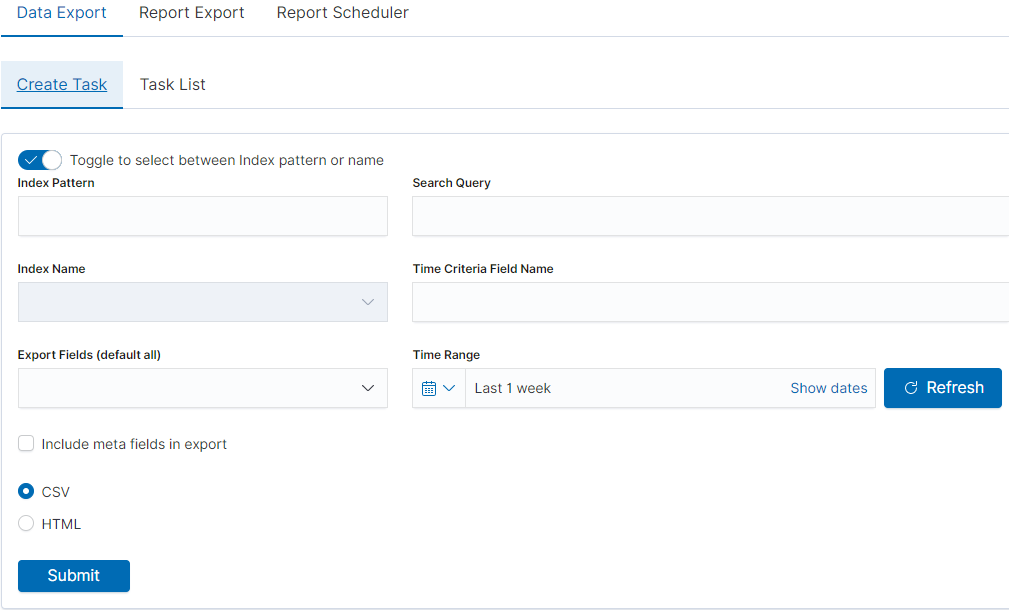
To export data to CSV Report click the Reports icon, you immediately go to the first tab - Export Data
In this tab, we have the opportunity to specify the source from which
we want to export. It can be an index pattern. After selecting it,
we confirm the selection with the Submit button, and a report is
created at the moment. The symbol
 can refresh the list of reports and see
what its status is.
can refresh the list of reports and see
what its status is.
We can also create a report by pointing to a specific index from the drop-down list of indexes.
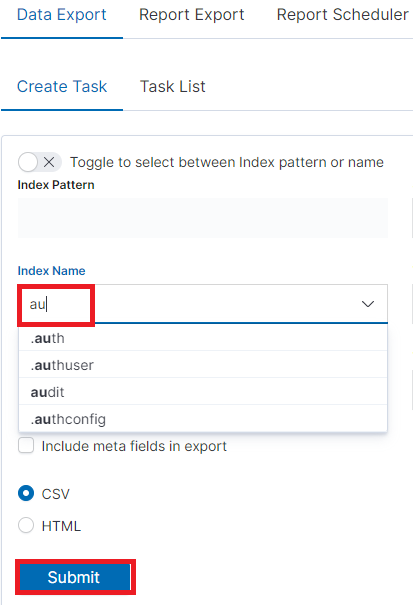
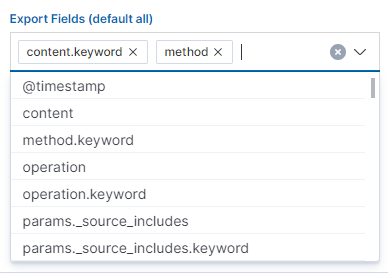
We can also check which fields are to be included in the report. The selection is confirmed by the Submit button.
When the process of generating the report (Status: Completed) is finished, we can download it (Download button) or delete it (Delete button). The downloaded report in the form of a *.csv file can be opened in the browser or saved to the disk.
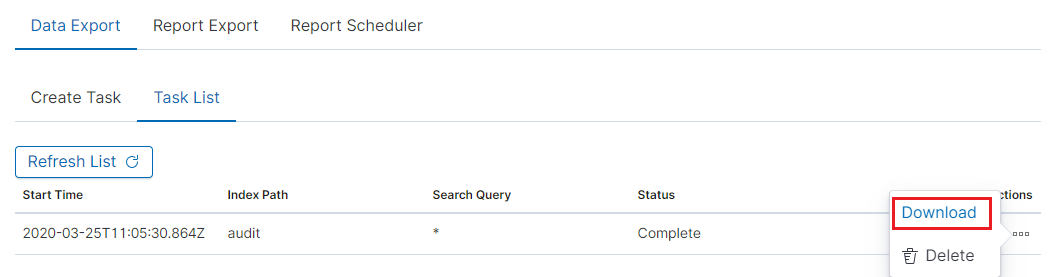
In this tab, the downloaded data has a format that we can import into other systems for further analysis.
PDF Report
In the Export Dashboard tab, we can create graphic reports in PDF files. To create such a report, just from the drop-down list of previously created and saved Dashboards, indicate the one we are interested in, and then confirm the selection with the Submit button. A newly created export with the Processing status will appear on the list under Dashboard Name. When the processing is completed, the Status changes to Complete and it will be possible to download the report.
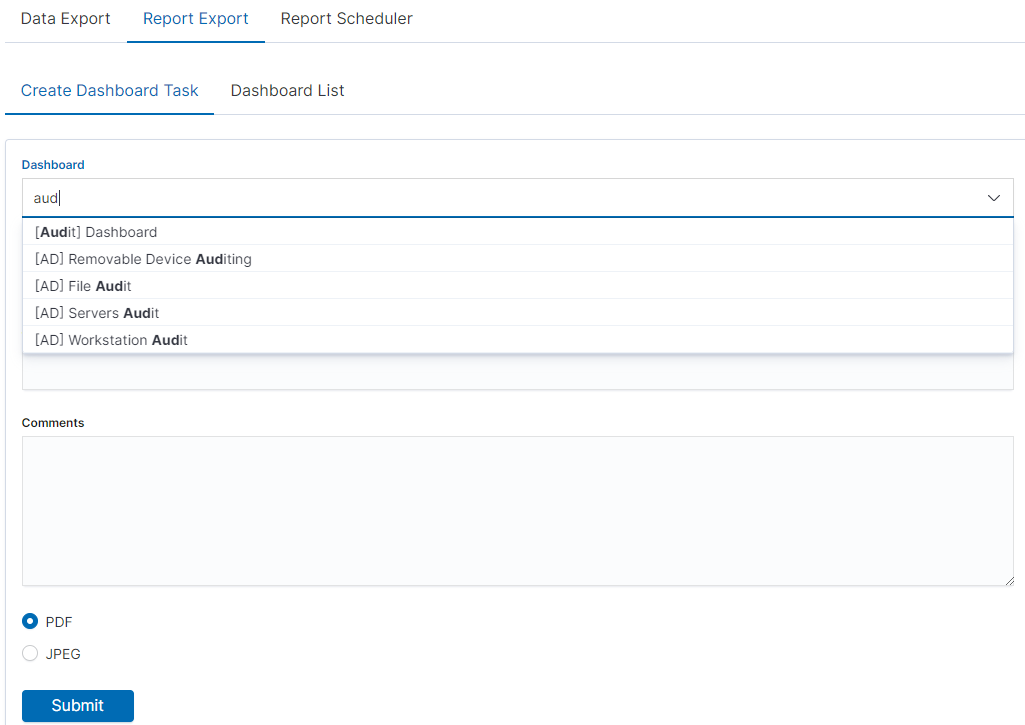
By clicking the Download button, the report is downloaded to the disk or we can open it in the PDF file browser. There is also to option of deleting the report with the Delete button.
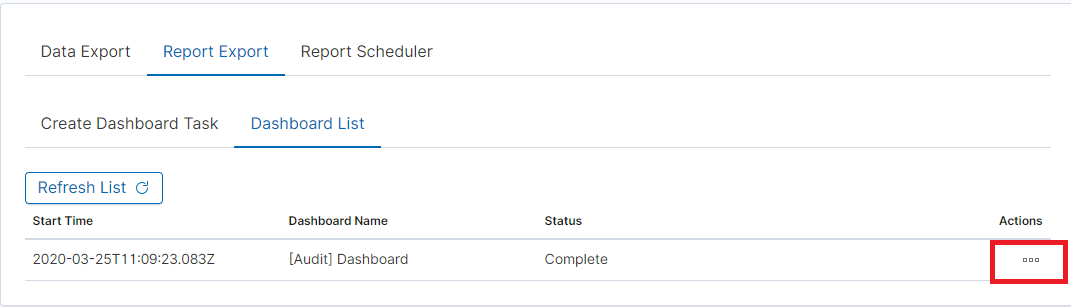
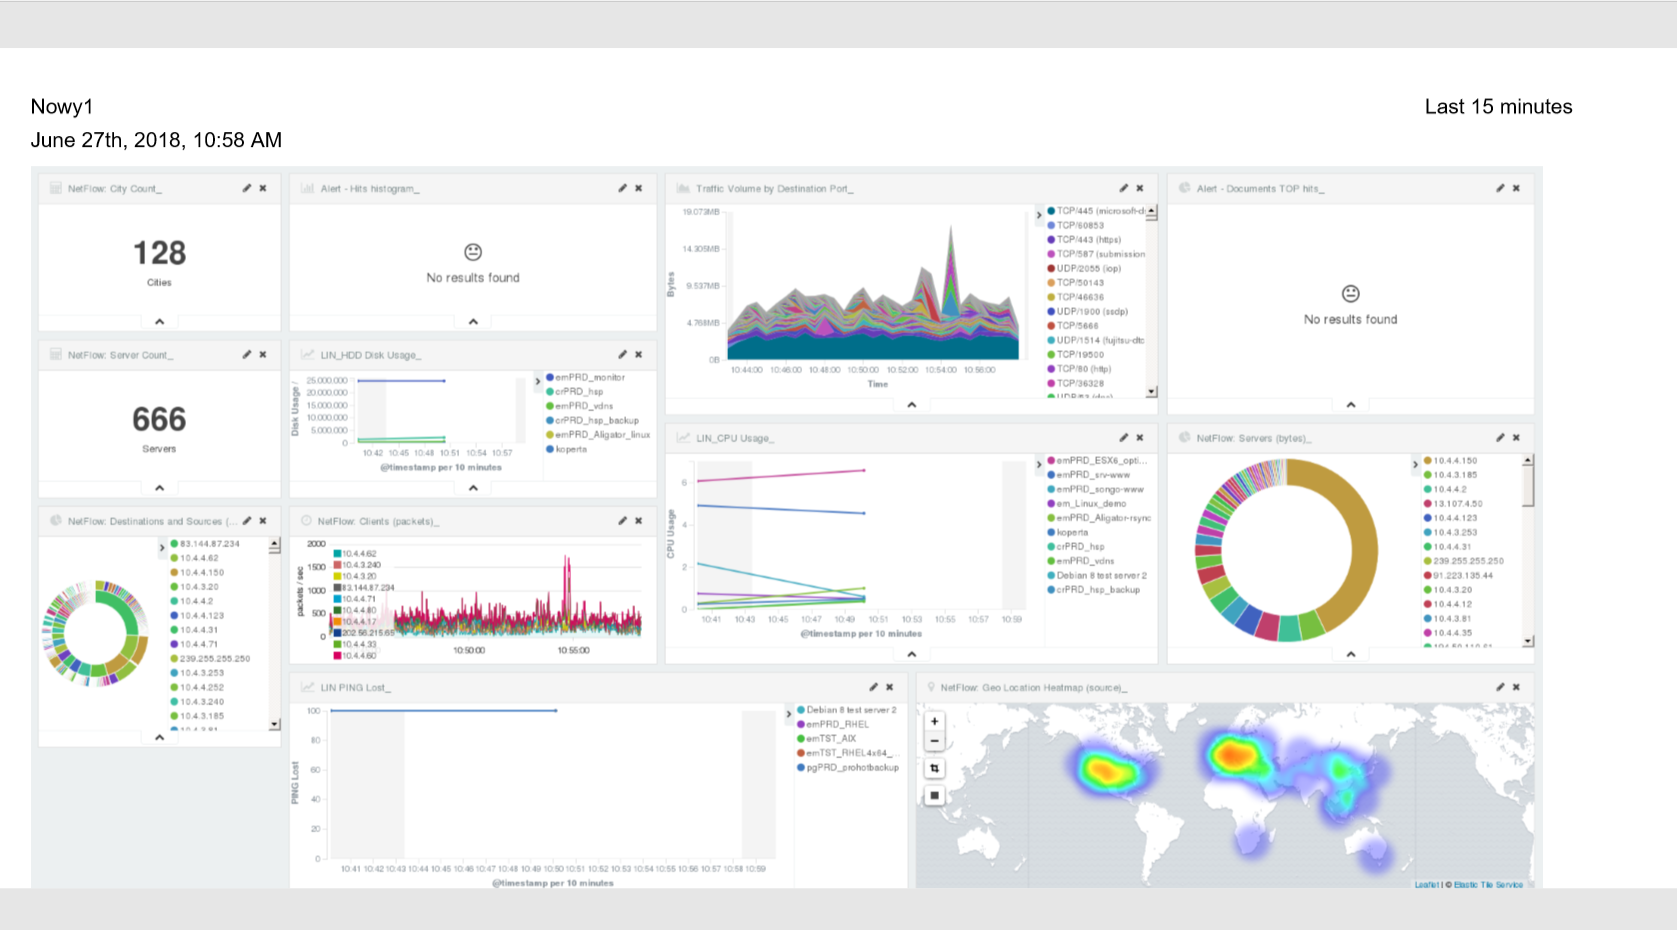
Below is an example report from the Dashboard template generated and downloaded as a PDF file.
PDF report from the table visualization
Data from a table visualization can be exported as a PDF report.
To export a table visualization data, follow these steps:
Go to the ‘Report’ module and then to the ‘Report Export’ tab,
Add the new task name in the ‘Task Name’ field,
Toggle the switch ‘Enable Data Table Export’:
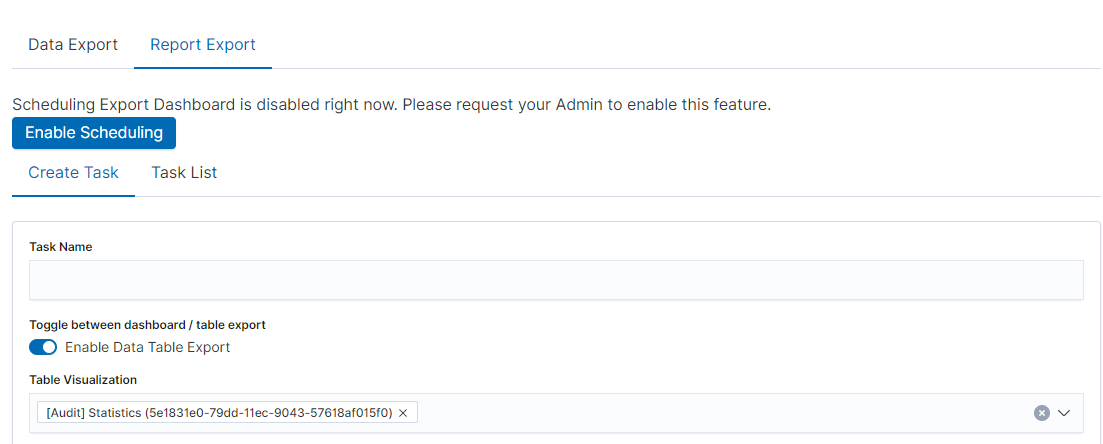
Select the table from the ‘Table Visualization’ list,
Select the time range for which the report is to be prepared,
You can select a logo from the ‘Logo’ list,
You can add a report title using the ‘Title’ field,
You can add a report comment using the ‘Comments’ field,
Select the ‘Submit’ button to start creating the report,
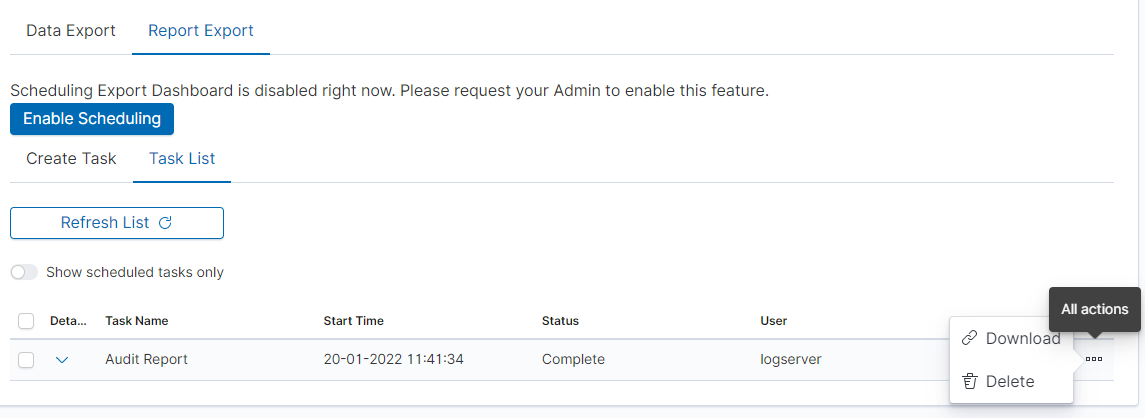
You can follow the progress in the ‘Task List’ tab,
After completing the task, the status will change to ‘Complete’ and you can download the PDF report via ‘Action’ -> ‘Download’:
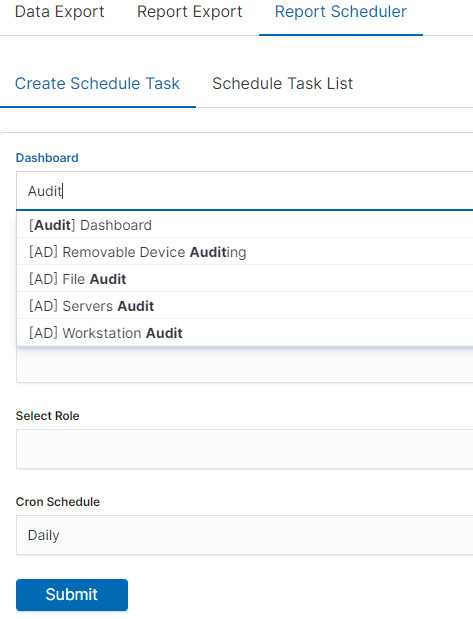
Scheduler Report (Schedule Export Dashboard)
In the Report selection, we have the option of setting the Scheduler which from the Dashboard template can generate a report at time intervals. To do this, go to the Schedule Export Dashboard tab.
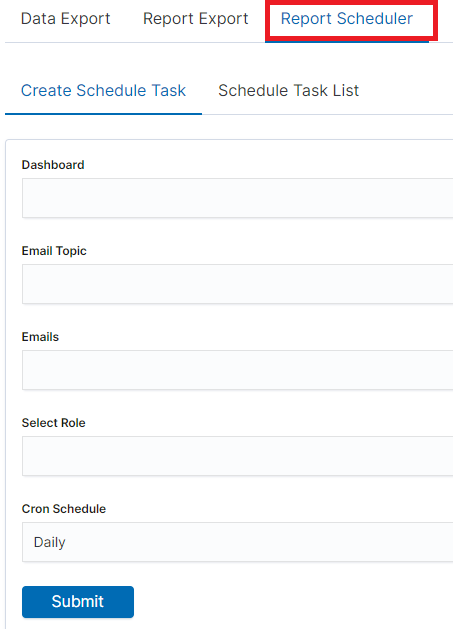
Scheduler Report (Schedule Export Dashboard)
In this tab mark the saved Dashboard.
Note: The default time period of the dashboard is last 15 minutes.
Please refer to Discovery > Time settings and refresh to change the time period of your dashboard.
In the Email Topic field, enter the Message title, in the Email field enter the email address to which the report should be sent. From the drop-down list choose at what frequency you want the report to be generated and sent. The action configured in this way is confirmed with the Submit button.
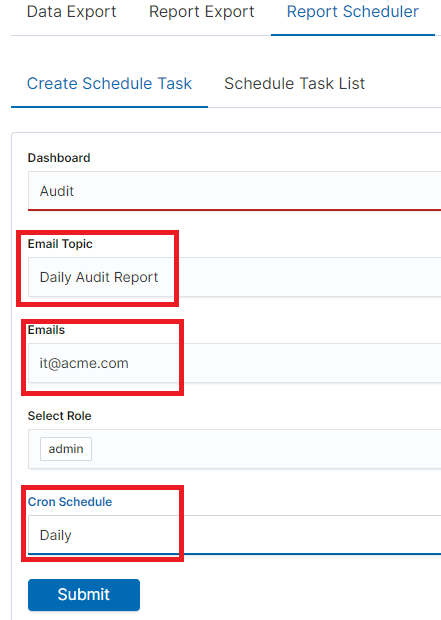
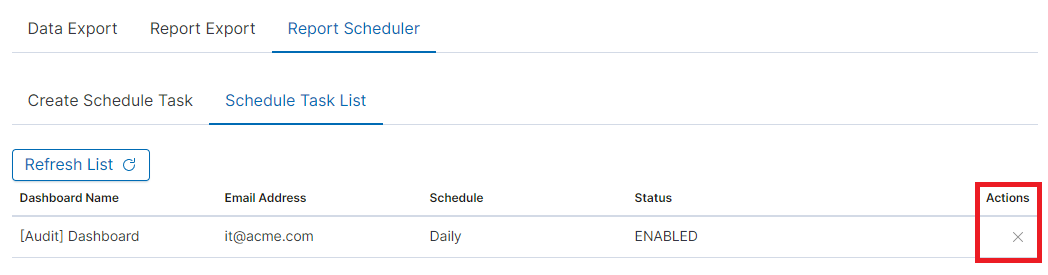
The defined action goes to the list and will generate a report to the e-mail address, with the cycle we set, until we cannot cancel it with the Cancel button.
User roles and object management
Users, roles, and settings
Energy Logserver allows to you manage users and permission for indexes and methods used by them. To do this click the “Config” button from the main menu bar.
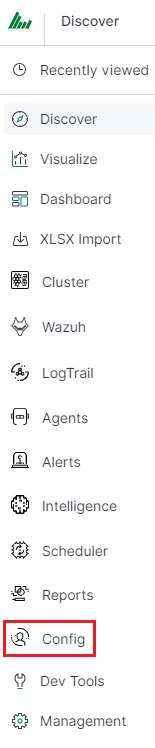
A new window will appear with three main tabs: „User Management”, „Settings” and „License Info”.
From the „User Management” level we have access to the following possibilities: Creating a user in „Create User”, displaying users in „User List”, creating new roles in „Create Role” and displaying existing roles in „List Role”.
Creating a User (Create User)
Creating user
To create a new user click on the Config icon and you immediately enter the administration panel, where the first tab is to create a new user (Create User).
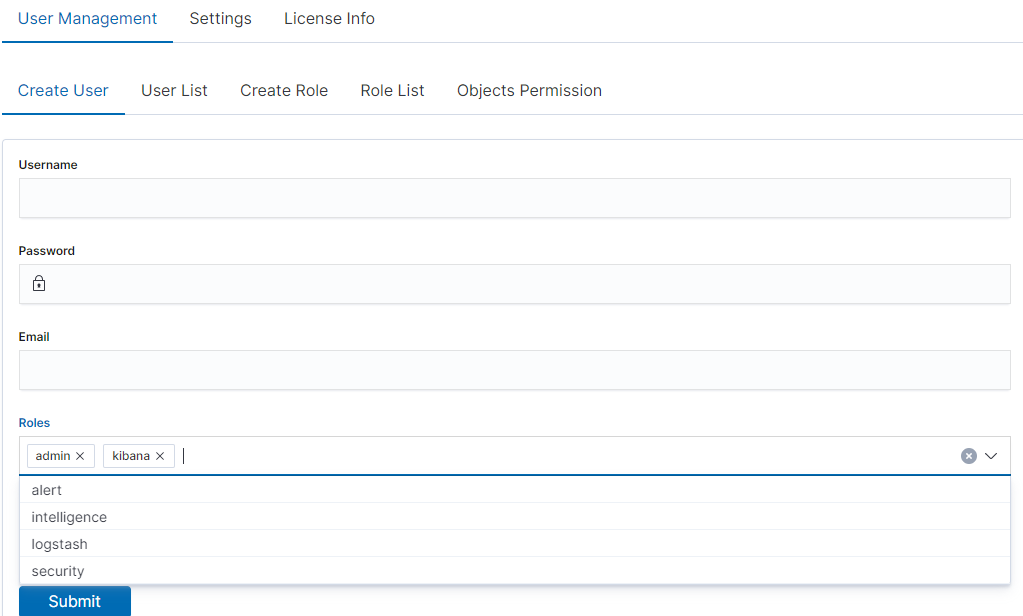
In the wizard that opens, we enter a unique username (Username field), and password for the user (field Password) and assign a role (field Role). In this field, we have the option of assigning more than one role. Until we select a role in the Roles field, the Default Role field remains empty. When we mark several roles, these roles appear in the Default Role field. In this field, we have the opportunity to indicate which role for a new user will be the default role with which the user will be associated in the first place when logging in. The default role field has one more important task - it binds all users with the field/role set in one group. When one of the users of this group creates the Visualization or the Dashboard it will be available to other users from this role(group). Creating the account is confirmed with the Submit button.
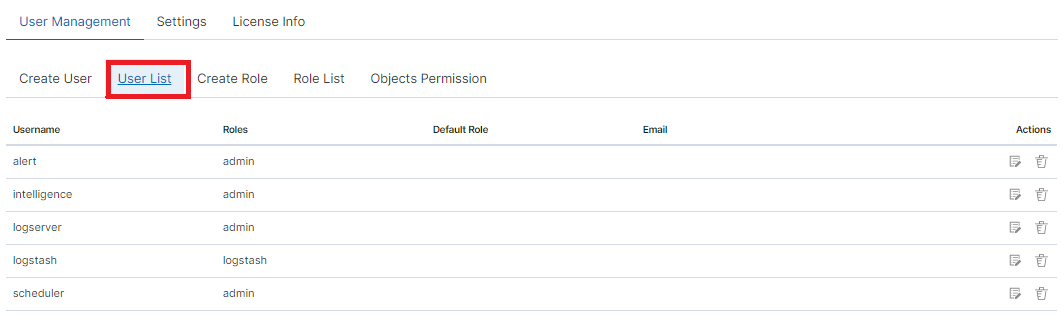
User’s modification and deletion, (User List)
Once we have created users, we can display their list. We do it in the next tab (User List).
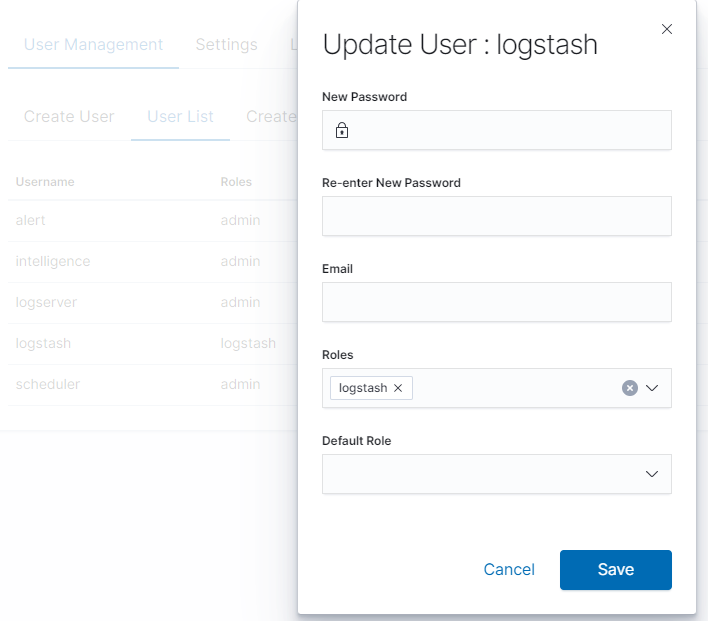
In this view, we get a list of user accounts with assigned roles and we have two buttons: Delete and Update. The first of these is the ability to delete a user account. Under the Update button is a drop-down menu in which we can change the previous password to a new one (New password), change the password (Re-enter New Password), change the previously assigned roles (Roles), to other (we can take the role assigned earlier and give a new one, extend user permissions with new roles). The introduced changes are confirmed with the Submit button.
We can also see the current user settings and clicking the Update button collapses the previously expanded menu.
Create, modify, and delete a role (Create Role), (Role List)
In the Create Role tab, we can define a new role with permissions that we assign to a pattern or several index patterns.
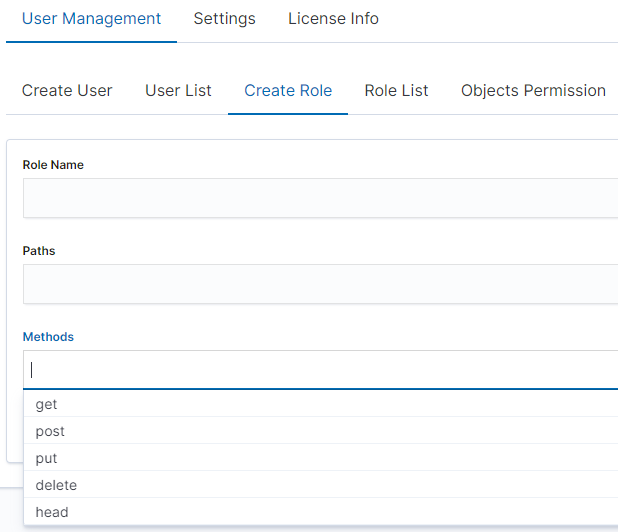
For example, we use the syslog2* index pattern. We give this name in the Paths field. We can provide one or more index patterns, their names should be separated by a comma. In the next Methods field, we select one or many methods that will be assigned to the role. Available methods:
- PUT - sends data to the server
- POST - sends a request to the server for a change
- DELETE - deletes the index/document
- GET - gets information about the index /document
- HEAD - is used to check if the index /document exists
In the role field, enter the unique name of the role. We confirm the addition of a new role with the Submit button. To see if a new role has been added, go to the net Role List tab.
As we can see, the new role has been added to the list. With the Delete button we have the option of deleting it, while under the Update button, we have a drop-down menu thanks to which we can add or remove an index pattern and add or remove a method. When we want to confirm the changes, we choose the Submit button. Pressing the Update button again will close the menu.
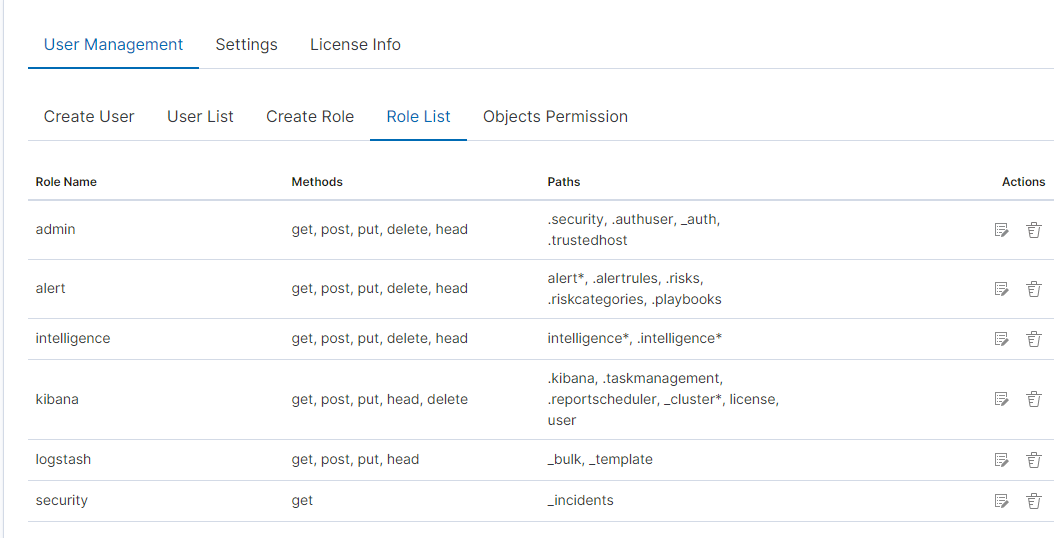
Fresh installation of the application has sewn solid roles, which grant users special rights:
- admin - this role gives unlimited permissions to administer/manage the application
- alert - a role for users who want to see the Alert module
- kibana - a role for users who want to see the application GUI
- Intelligence - a role for users who are to see the Intelligence moduleObject access permissions (Objects permissions)
In the User Manager tab, we can parameterize access to the newly created role as well as existing roles. In this tab, we can indicate to which object in the application the role has access.
Example:
In the Role List tab, we have a role called sys2, it refers to all index patterns beginning with syslog* and the methods get, post, delete, put and head are assigned.
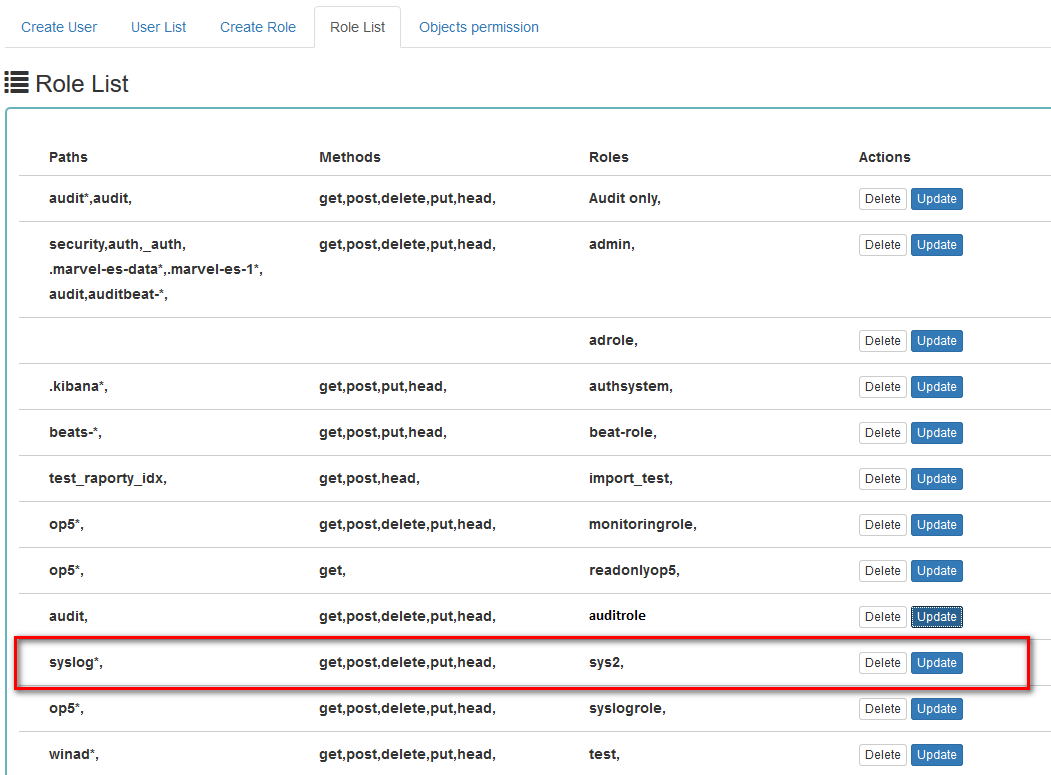
When we go to the Object permission tab, we have the option to choose the sys2 role in the drop-down list choose a role:
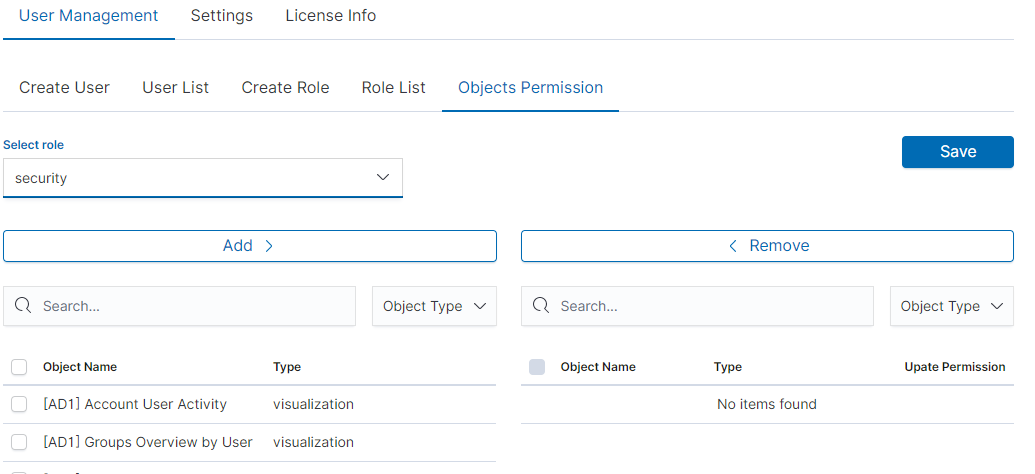
After selecting, we can see that we already have access to the objects: two index patterns syslog2* and Energy Logserver-* and on a dashboard Windows Events. There are also appropriate read or update permissions.
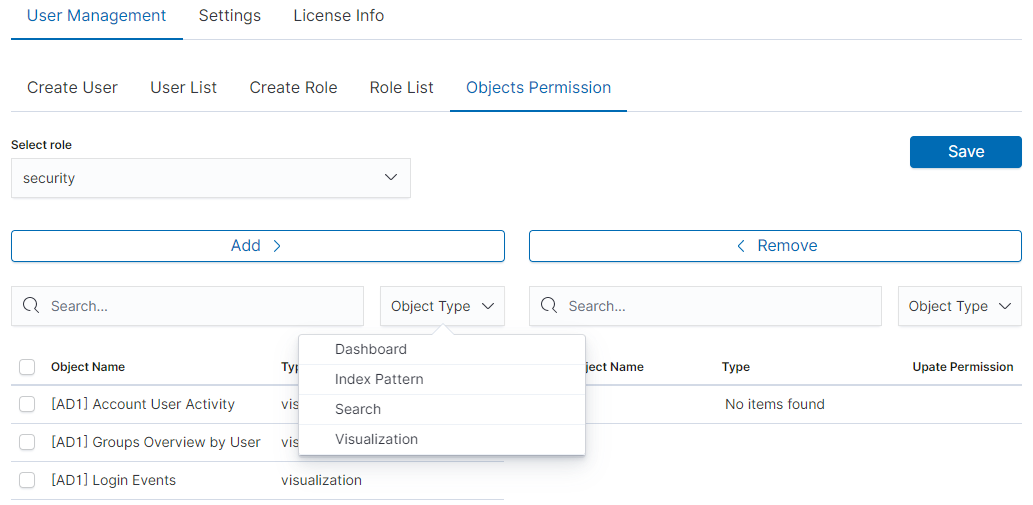
From the list, we have the opportunity to choose another object that we
can add to the role. We have the ability to quickly find this object
in the search engine (Find) and narrow the object class in
the drop-down field “Select object type”. The object type is associated with saved previous documents in the sections Dashboard, Index pattern,
Search, and Visualization.
By buttons,  we have the ability to add or remove or
object, and the Save button to save the selection.
we have the ability to add or remove or
object, and the Save button to save the selection.
Default user and passwords
| Address | User | Password | Role | Description | Usage |
|---|---|---|---|---|---|
| https://localhost:5601 | logserver | logserver | logserver | A built-in superuser account | |
| alert | alert | alert | A built-in account for the Alert module | ||
| intelligence | intelligece | intelligence | A built-in account for the Intelligence module | authorizing communication with elasticsearch server | |
| scheduler | scheduler | scheduler | A built-in account for the Scheduler module | ||
| logstash | logstash | logstash | A built-in account for authorized comuunication form Logstash | ||
| cerebro | system acconut only | A built-in account for authorized comuunication from Cerebro moudule |
Changing the password for the system account
Account Logserver
- Update /etc/kibana/kibana.ymlUpdate password in _/_opt/license-service/license-service.conf* file:
elasticsearch_connection:
hosts: ["10.4.3.185:9200"]

username: logserver
password: "new_logserver_password"

https: true
- Update the password in the curator configuration file: /usr/share/kibana/curator/curator.yml
http_auth: logserver:"new_logserver_password
Account Intelligence
Update /opt/ai/bin/conf.cfg
vi /opt/ai/bin/conf.cfg
password=new_intelligence_password
Account Alert
Update file /opt/alert/config.yaml
vi /opt/alert/config.yaml
es_password: alert
Account Scheduler
Update /etc/kibana/kibana.yml
vi /etc/kibana/kibana.yml
elastscheduler.password: "new_scheduler_password"
Account Logstash
Update the Logstash pipeline configuration files (*.conf) in the output sections:
vi /etc/logstash/conf.d/*/*.conf
output {
 elasticsearch {
   hosts => ["localhost:9200"]
   index => "syslog-%{+YYYY.MM}"
   user => "logstash"
   password => "new_password"
 }
}
Account License
Update file /opt/license-service/license-service.conf
elasticsearch_connection:
  hosts: ["127.0.0.1:9200"]

  username: license
  password: "new_license_password"
Module Access
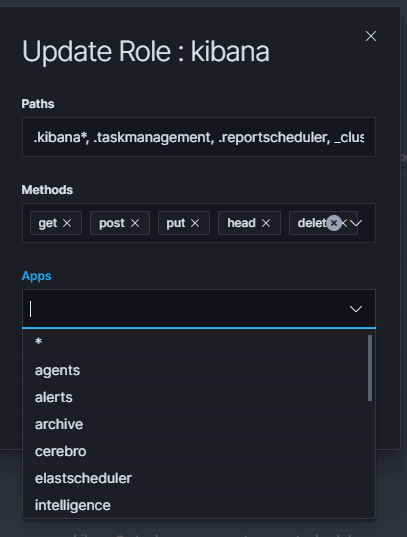
You can restrict access to specific modules for a user role. For example: the user can only use the Discovery, Alert, and Cerebro modules, the other modules should be inaccessible to the user.
You can do this by editing the roles in the Role List and selecting the application from the Apps list. After saving, the user has access only to specific modules.
Manage API keys
The system allows you to manage, create, and delete API access keys from the level of the GUI management application.
Examples of implementation:
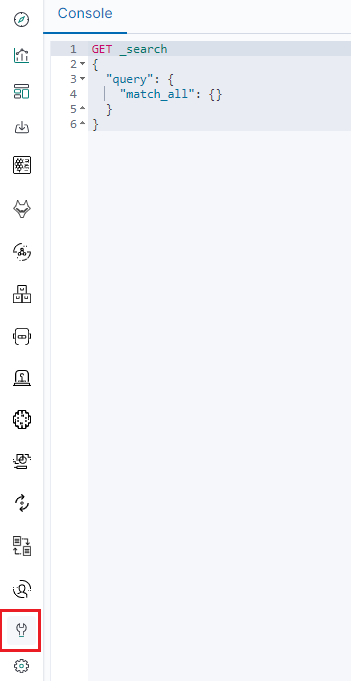
From the main menu select the “Dev Tools” button:
List of active keys:
Details of a single key:
Create a new key:
Deleting the key:
Separate data from one index to different user groups
We can Separate data from one index to different user groups using aliases. For example, in one index we have several tags:

To separate the data, you must first set up an alias on the appropriate tag.

Then assume a pattern index on the above alias. Finally, we can assign the appropriate role to the new index pattern.

Settings
General Settings
The Settings tab is used to set the audit on different activities or events and consists of several fields:
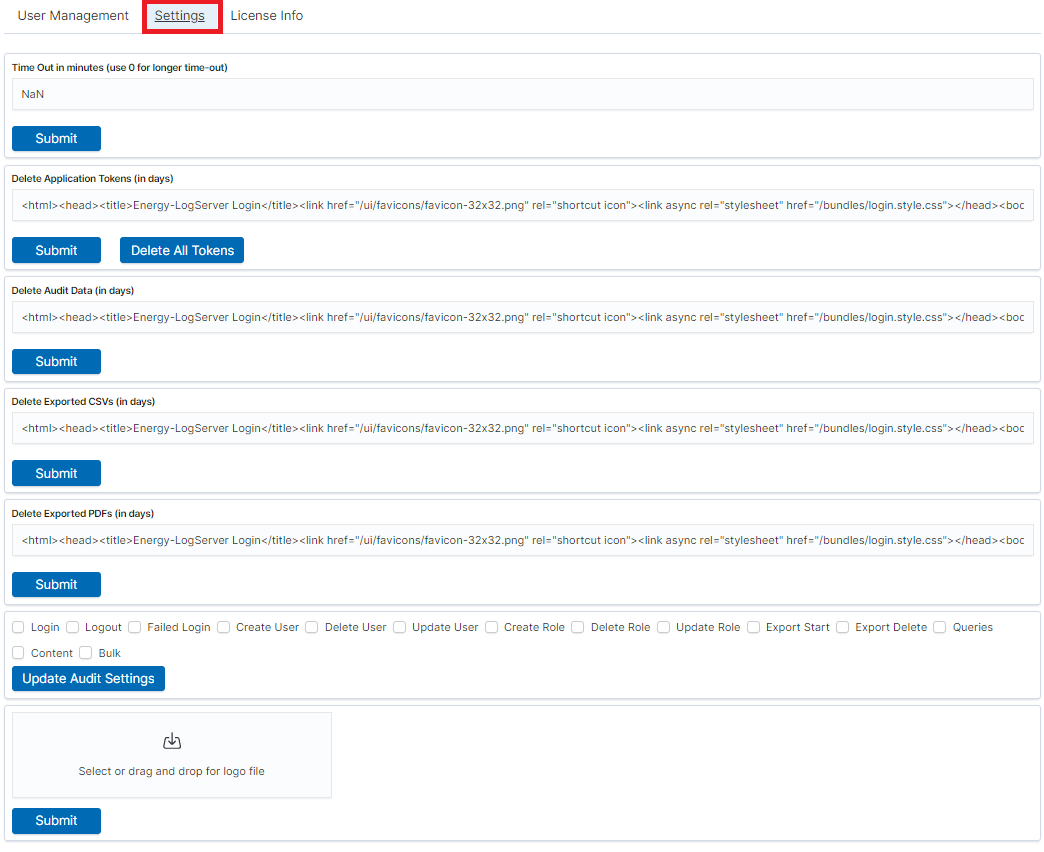
- Time Out in minutes field - this field defines the time after how many minutes the application will automatically log you off
- Delete Application Tokens (in days) - in this field, we specify after what time the data from the audit should be deleted
- Delete Audit Data (in days) field - in this field, we specify after what time the data from the audit should be deleted
- The next fields are checkboxes in which we specify what kind of events are to be logged (saved) in the audit index. The events that can be monitored are: logging (Login), logging out (Logout), creating a user (Create User), deleting a user (Delete User), updating user (Update User), creating a role (Create Role), deleting a role (Delete Role), update of the role (Update Role), start of export (Export Start), delete of export (Export Delete), queries (Queries), result of the query (Content), if attempt was made to perform a series of operation (Bulk)
- Delete Exported CSVs (in days) field - in this field, we specify after which time exported files with CSV extension have to be removed
- Delete Exported PDFs (in days) field - in this field, we specify after which time exported files with PDF extension have to be removed
Each field is assigned the “Submit” button thanks to which we can confirm the changes.
License (License Info)
The License Information tab consists of several non-editable information fields.
Also, if you are logged in as an administrator you will be able to upload new license from here.
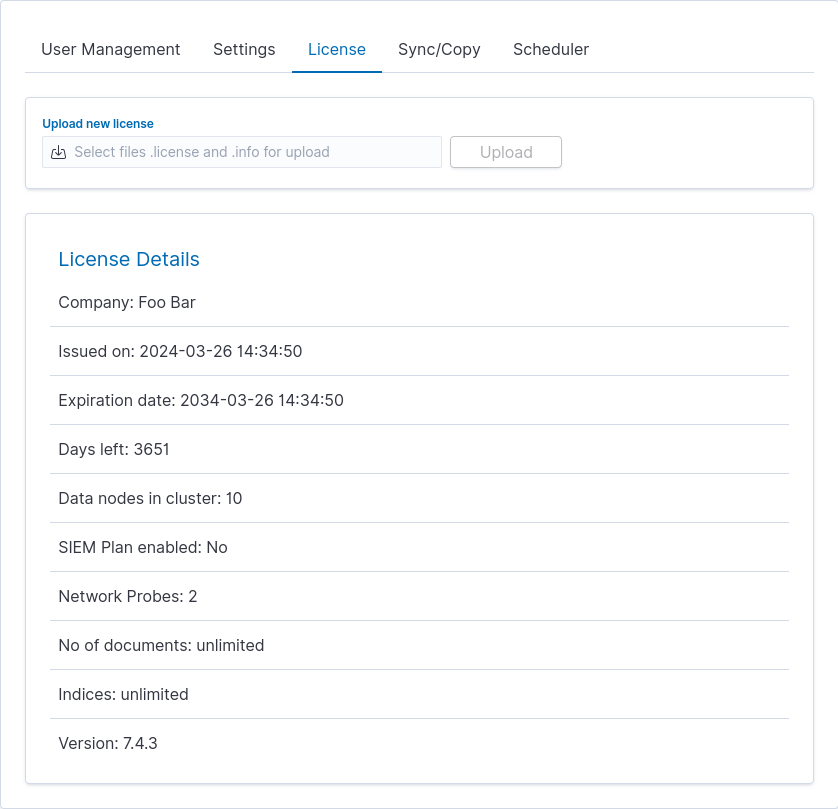
These fields contain information:
- Company - who owns the license, in this case, Foo Bar.
- Issued on - license creation date
- Expiration date - when the license will expire
- Days left - how many days left before it will expire
- Data nodes in cluster - how many nodes we can put in one cluster - in this case, 10
- SIEM Plan enabled - is SIEM Plan covered by the license
- Network Probes - count of NetworkProbes covered by the license
- No of documents - license can be limited by docs count
- Indices - license can be limited by index pattern names
- Version - version of the product
Renew license
To change the Energy Logserver license files on a running system, use the “Upload new license” option at the top of the “License” tab.
- Select the provided license files, e.g.: es_123.info, es_123.license.
- Click upload.
- Files will be uploaded and verified. New license information will appear.
- Verify new license information and click “Submit” when ready.
- It will install itself in the cluster - no need to manually put it on all nodes.
Special accounts
At the first installation of the Energy Logserver application, apart from the administrative account (logserver), special applications are created in the application: alert, intelligence, and scheduler.
- Alert Account - this account is connected to the Alert Module which is designed to track events written to the index for the previously defined parameters. If these are met the information action is started (more on the action in the Alert section)
- Intelligence Account - this account is related to the module of artificial intelligence which is designed to track events and learn the network based on previously defined rules artificial intelligence based on one of the available algorithms (more on operation in the Intelligence chapter)
- Scheduler Account - the scheduler module is associated with this account, which corresponds to, among others for generating reports
Backup/Restore
Backing up
The backup bash script is located on the hosts with Elasticsearch in the location: /usr/share/elasticsearch/utils/configuration-backup.sh.
The script is responsible for backing up the basic data in the Logserver system (these data are the system indexes found in Elasticsearch of those starting with a dot ‘.’ in the name), the configuration of the entire cluster, the set of templates used in the cluster and all the components.
These components include the Logstash configuration located in /etc/logstash and the Kibana configuration located in /etc/kibana.
All data is stored in the /tmp folder and then packaged using the /usr/bin/tar utility to tar.gz format with the exact date and time of execution in the target location, then the files from /tmp are deleted.
crontab
It is recommended to configure crontab.
- Before executing the following commands, you need to create a crontab file, set the path to backup, and direct them there.
In the below example, the task was configured on hosts with the Elasticsearch module on the root.
# crontab -l #Printing the Crontab file for the currently logged in user
0 1 * * * /bin/bash /usr/share/elasticsearch/utils/configuration-backup.sh
- The client-node host saves the backup in the /archive/configuration-backup/ folder.
- Receiver-node hosts save the backup in the /root/backup/ folder.
Restoration from backup
To restore the data, extract the contents of the created archive, e.g.
# tar -xzf /archive/configuration-backup/backup_name-000000-00000.tar.gz -C /tmp/restore
Then display the contents and select the files to restore (this will look similar to the following):
# ls -al /tmp/restore/00000-11111/
drwxr-xr-x 2 root root    11111 01-08 10:29 .
drwxr-xr-x 3 root root     2222 01-08 10:41 ..
-rw-r--r-- 1 root root  3333333 01-08 10:28 .file1.json
-rw-r--r-- 1 root root     4444 01-08 10:28 .file_number2.json
-rw-r--r-- 1 root root     5555 01-08 10:29 .file3.json
-rw-r--r-- 1 root root      666 01-08 10:29 .file4.json
-rw-r--r-- 1 root root     7777 01-08 10:29 .file5.json
-rw-r--r-- 1 root root       87 01-08 10:29 .file6.json
-rw-r--r-- 1 root root        1 01-08 10:29  file6.json
-rw-r--r-- 1 root root       11 01-08 10:29 .file7.json
-rw-r--r-- 1 root root     1234 01-08 10:29  file8.tar.gz
-rw-r--r-- 1 root root     0000 01-08 10:29 .file9.json
To restore any of the system indexes, e.g. .security, execute the commands:
# /usr/share/kibana/elasticdump/elasticdump  --output="http://logserver:password@127.0.0.1:9200/.kibana" --input="/root/restore/20210108-102848/.security.json" –type=data
# /usr/share/kibana/elasticdump/elasticdump  --output="http://logserver:password@127.0.0.1:9200/.kibana" --input="/root/restore/20210108-102848/.security_mapping.json" --type=mapping
To restore any of the configurations e.g. kibana/logstash/elastic/wazuh, follow the steps below:
# systemctl stop kibana
# tar -xvf /tmp/restore/20210108-102848/kibana_conf.tar.gz -C / --overwrite
# systemctl start kibana
To restore any of the templates, perform the following steps for each template:
- Select from the
templates.jsonfile the template you are interested in, omitting its name - Move it to a new
jsonfile, e.g.test.json - Load by specifying the name of the target template in the link
# curl -s -XPUT -H 'Content-Type: application/json' -u logserver '127.0.0.1:9200/_template/test -d@/root/restore/20210108-102848/test.json
To restore the cluster settings, execute the following command:
# curl -s -XPUT -H 'Content-Type: application/json' -u logserver '127.0.0.1:9200/_cluster/settings' -d@/root/restore/20210108-102848/cluster_settings.json
Audit actions
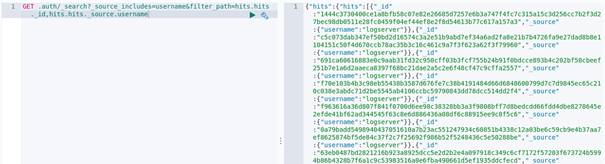
AUTHORIZATION PLUGIN
| ACTION TYPE | PATH | FROM REQUEST |
|---|---|---|
| USER_[CREATE|UPDATE|DELETE] | _logserver/accounts | whole body with diff |
| ROLE_[CREATE|UPDATE|DELETE] | _logserver/constraints | whole body with diff |
| BULK | _bulk | whole body if enabled |
| QUERY | * | whole body if enabled |
| OBJECTS | .kibana | whole body if enabled |
Paths excluded from auditing
//_nodes*/_stats*/.auth/.authconfig*
CONFIG
| ACTION TYPE | PATH | FROM REQUEST |
|---|---|---|
| TOKENS DELETED | post:/api/setting/job/deletealltokens | empty |
| SETTINGS TOKENDELETE | put:/api/setting/tokendelete | payload.value |
| SETTINGS TIMEOUT | put:/api/setting/ttl | payload.value |
| SETTINGS AUDIT SELECTION | put:/api/setting/auditselection | payload.value1 |
| SETTINGS AUDIT EXCLUSION | put:/api/setting/auditexclusion | payload |
| SETTINGS ALERT EXCLUDE FIELDS | put:/api/setting/alert_exclude_fields | payload.value1 |
| SETTINGS AUTH DOMAINS | put:/api/setting/auth_domains | payload.default_domain |
REPORTS
| ACTION TYPE | PATH | FROM REQUEST |
|---|---|---|
| DATA EXPORT CREATED | post:/api/reports/data/export | payload.taskName |
| MANUAL DATA EXPORT CREATED | post:/api/reports/data/export_manual | payload.user |
| DATA EXPORT EDITED | put:/api/reports/data/export | payload.taskName |
| DASHBOARD REPORT EXPORT CREATED | post:/api/reports/dashboard/export | payload.taskName |
| DASHBOARD REPORT EXPORT EDITED | put:/api/reports/dashboard/export | payload.taskName |
| DATA TABLE REPORT EXPORT CREATED | post:/api/reports/table/export | payload.taskName |
| DATA TABLE REPORT EXPORT EDITED | put:/api/reports/table/export | payload.taskName |
| SCHEDULED TASK ENABLED | put:/api/reports/scheduler/enable | payload.id |
| SCHEDULED TASK DISABLED | put:/api/reports/scheduler/disable | payload.id |
| TASKS DELETED | delete:/api/reports | payload.objs |
| SETTINGS PDF_EXPIRY | post:/api/reports/settings/pdf | payload.pdfExpiry |
| SETTINGS CSV_EXPIRY | post:/api/reports/settings/csv | payload.csvExpiry |
| REPORT UPLOAD LOGO | post:/api/reports/settings/logos | payload.fileName |
| ONGOING TASK STOP | post:/api/reports/stop | params.taskId |
INDEX MANAGEMENT
| ACTION TYPE | PATH | FROM REQUEST |
|---|---|---|
| ACTION CREATED | post:/api/index_management/action | payload.name |
| ACTION EDITED | put:/api/index_management/action | payload.name |
| ACTION START NOW | post:/api/index_management/action/run_action | payload.id |
| ACTION DELETED | delete:/api/index_management/action | params.name |
| SYSTEM INDEX ROLLOVER CONFIGURE | post:/api/index_management/settings/rollover/.agents | params.indexName |
| SYSTEM INDEX ROLLOVER CONFIGURE | post:/api/index_management/settings/rollover/alerts | params.indexName |
| SYSTEM INDEX ROLLOVER CONFIGURE | post:/api/index_management/settings/rollover/audit | params.indexName |
ARCHIVE
| ACTION TYPE | PATH | FROM REQUEST |
|---|---|---|
| ARCHIVAL TASK CREATED | post:/api/archive/archive_task | payload.id |
| ARCHIVAL TASK UPDATED | put:/api/archive/archive_task | params.taskId |
| ARCHIVAL TASK START NOW | post:/api/archive/archive_task/run | params.taskId |
| TASKS DELETED | delete:/api/archive/tasks | payload.objs |
| SEARCH TASK CREATED | post:/api/archive/search_task/run | payload.searchtext |
| RESTORE TASK CREATED | post:/api/archive/restore_task/run | payload.destinationIndex |
ALERTS
| ACTION TYPE | PATH | FROM REQUEST |
|---|---|---|
| ALERT RULE CREATED | post:/api/alerts/alertrule | payload.alertrulename |
| ALERT RULE EDITED | put:/api/alerts/alertrule | payload.alertrulename |
| ALERT RULE RAN ONCE | post:/api/alerts/alertrule/runonce | payload.id |
| ALERT RULES SAVED | post:/api/alerts/alertrule/saverules | empty |
| ALERT RULE DELETED | delete:/api/alerts/alertrule | params.id |
| ALERT GROUP CREATED | post:/api/alerts/groups | empty |
| ALERT GROUP RENAMED | put:/api/alerts/groups | payload.rename |
| ALERT GROUP DELETED | delete:/api/alerts/groups | payload.groupName |
| ALERT ADDED TO GROUP | put:/api/alerts/updatealerts | empty |
| ALERT CHANGED ROLES | put:/api/alerts/alertrules/changeroles | payload.alertsList |
| ALERT MANUAL INCIDENT CREATED | post:/api/alerts/incidents/create_manual | payload.data.rule_name |
| ALERT RULE [enabled|disabled] | put:/api/alerts/alertrule/switch | payload.alertsList |
| ALERT RULE INCIDENT EDITED | put:/api/alerts/incidents | payload.id + dynamic values
|
SYNC
| ACTION TYPE | PATH | FROM REQUEST |
|---|---|---|
| SYNC PROFILE CREATED | post:/api/sync/clusterprofile | payload.host |
| SYNC SYNCHRONISED | put:/api/sync/syncTask | payload.destination |
| SYNC COPIED | post:/api/sync/copyTask | payload.destination |
| SYNC PROFILE DELETED | post:/api/sync/syncTask/delete | payload.id |
| SYNC JOB RUNED | post:/api/sync/runTask | payload.id |
AGENTS
| ACTION TYPE | PATH | FROM REQUEST |
|---|---|---|
| AGENTS AGENT RELOADED | post:/api/agents/reloadagents | params.id |
| AGENTS MASTERAGENT RELOADED | post:/api/agents/reloadmasteragent | params.id |
| AGENTS DELETED | delete:/api/agents | params.uid |
| AGENTS FILE CREATED | post:/api/agents/templates/file | payload.file.name |
| AGENTS FILE DELETED | delete:/api/agents/files | empty |
| AGENTS FILE EDITED | put:/api/agents/files | payload.name |
| AGENTS TEMPLATE CREATED | post:/api/agents/templates | payload.template.name |
| AGENTS TEMPLATE EDITED | put:/api/agents/templates | payload.template.name |
| AGENTS TEMPLATE DELETED | delete:/api/agents/templates | payload.params.id |
| AGENTS BEATS [started|restarted|stoped] | post:/api/agents/manage/*
|
[params.beatname|payload] |
INTELLIGENCE
| ACTION TYPE | PATH | FROM REQUEST |
|---|---|---|
| INTELLIGENCE RULE STOPED | get:/api/intelligence/intelligence_airules_set_stoprule | query.rule_uid |
| INTELLIGENCE RULE STARTED | get:/api/intelligence/intelligence_airules_set_startrule | query.rule_uid |
| INTELLIGENCE RULE DELETED | get:/api/intelligence/intelligence_airules_set_deleterule | query.rule_uid |
| INTELLIGENCE RULE [created|edited] | get:/api/intelligence/intelligence_modelcreation_set_formdata | query.rule_name |
NETWORK-PROBE
| ACTION TYPE | PATH | FROM REQUEST |
|---|---|---|
| NETWORK-PROBE FILE CREATED | post:/api/network-probe/files | payload.file.path |
| NETWORK-PROBE FILE DELETED | delete:/api/network-probe/files | payload.filePath |
| NETWORK-PROBE FILE REREGISTERED | post:/api/network-probe/files/register | payload.host.ip |
| NETWORK PROBE SERVICES [stoped|started|restarted] | post:/api/network-probe/services | payload.services.names |
| NETWORK-PROBE PIPELINES ENABLED | post:/api/network-probe/{probeId}/pipelines/enable | params.hostId, payload.pipelinesIds |
| NETWORK-PROBE PIPELINES DISABLED | post:/api/network-probe/{probeId}/pipelines/disable | params.hostId, payload.pipelinesIds |
| NETWORK-PROBE PIPELINES RELOADED | post:/api/network-probe/pipelines/reload | empty |
ELASTSCHEDULER
| ACTION TYPE | PATH | FROM REQUEST |
|---|---|---|
[ARCHIVE|INDEX_MANAGEMENT|SYNC] ACTION [enabled|disabled] |
put:/api/elastscheduler/schedulerjob | payload.name |
| SCHEDULER ACTION [enabled|disabled] | put:/api/elastscheduler/schedulerjob | payload.name |
Index management
Note Before using the Index Management module is necessary to set an appropriate password for the Log Server user in the following file: /usr/share/kibana/curator/curator.yml*
The Index Management module allows you to manage indexes and perform activities such as:
- Closing indexes,
- Delete indexes,
- Performing a merge operation for index,
- Shrink index shards,
- Index rollover.
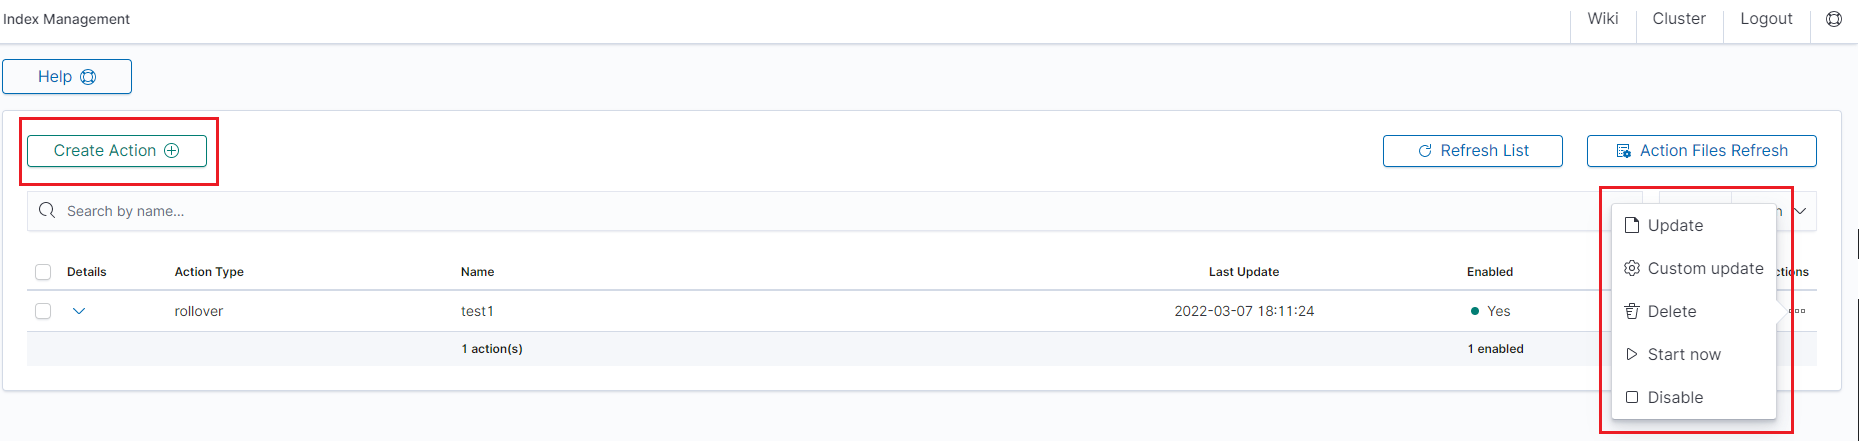
The Index Management module is accessible through the main menu tab.
The main module window allows you to create new Create Task tasks, view and manage created tasks, that is:
- Update,
- Custom update,
- Delete,
- Start now,
- Disable / Enable.
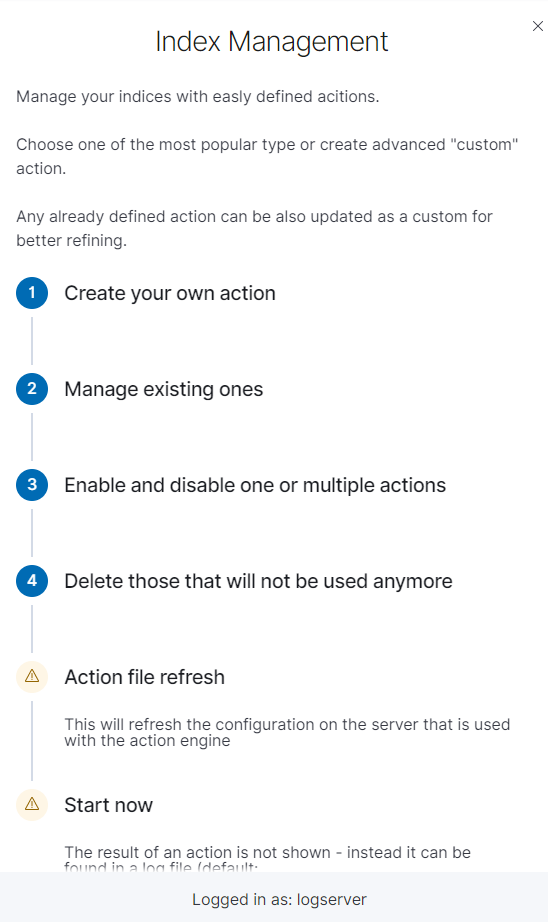
Note Use the Help button
By using the Help button you can get a detailed description of the current actions
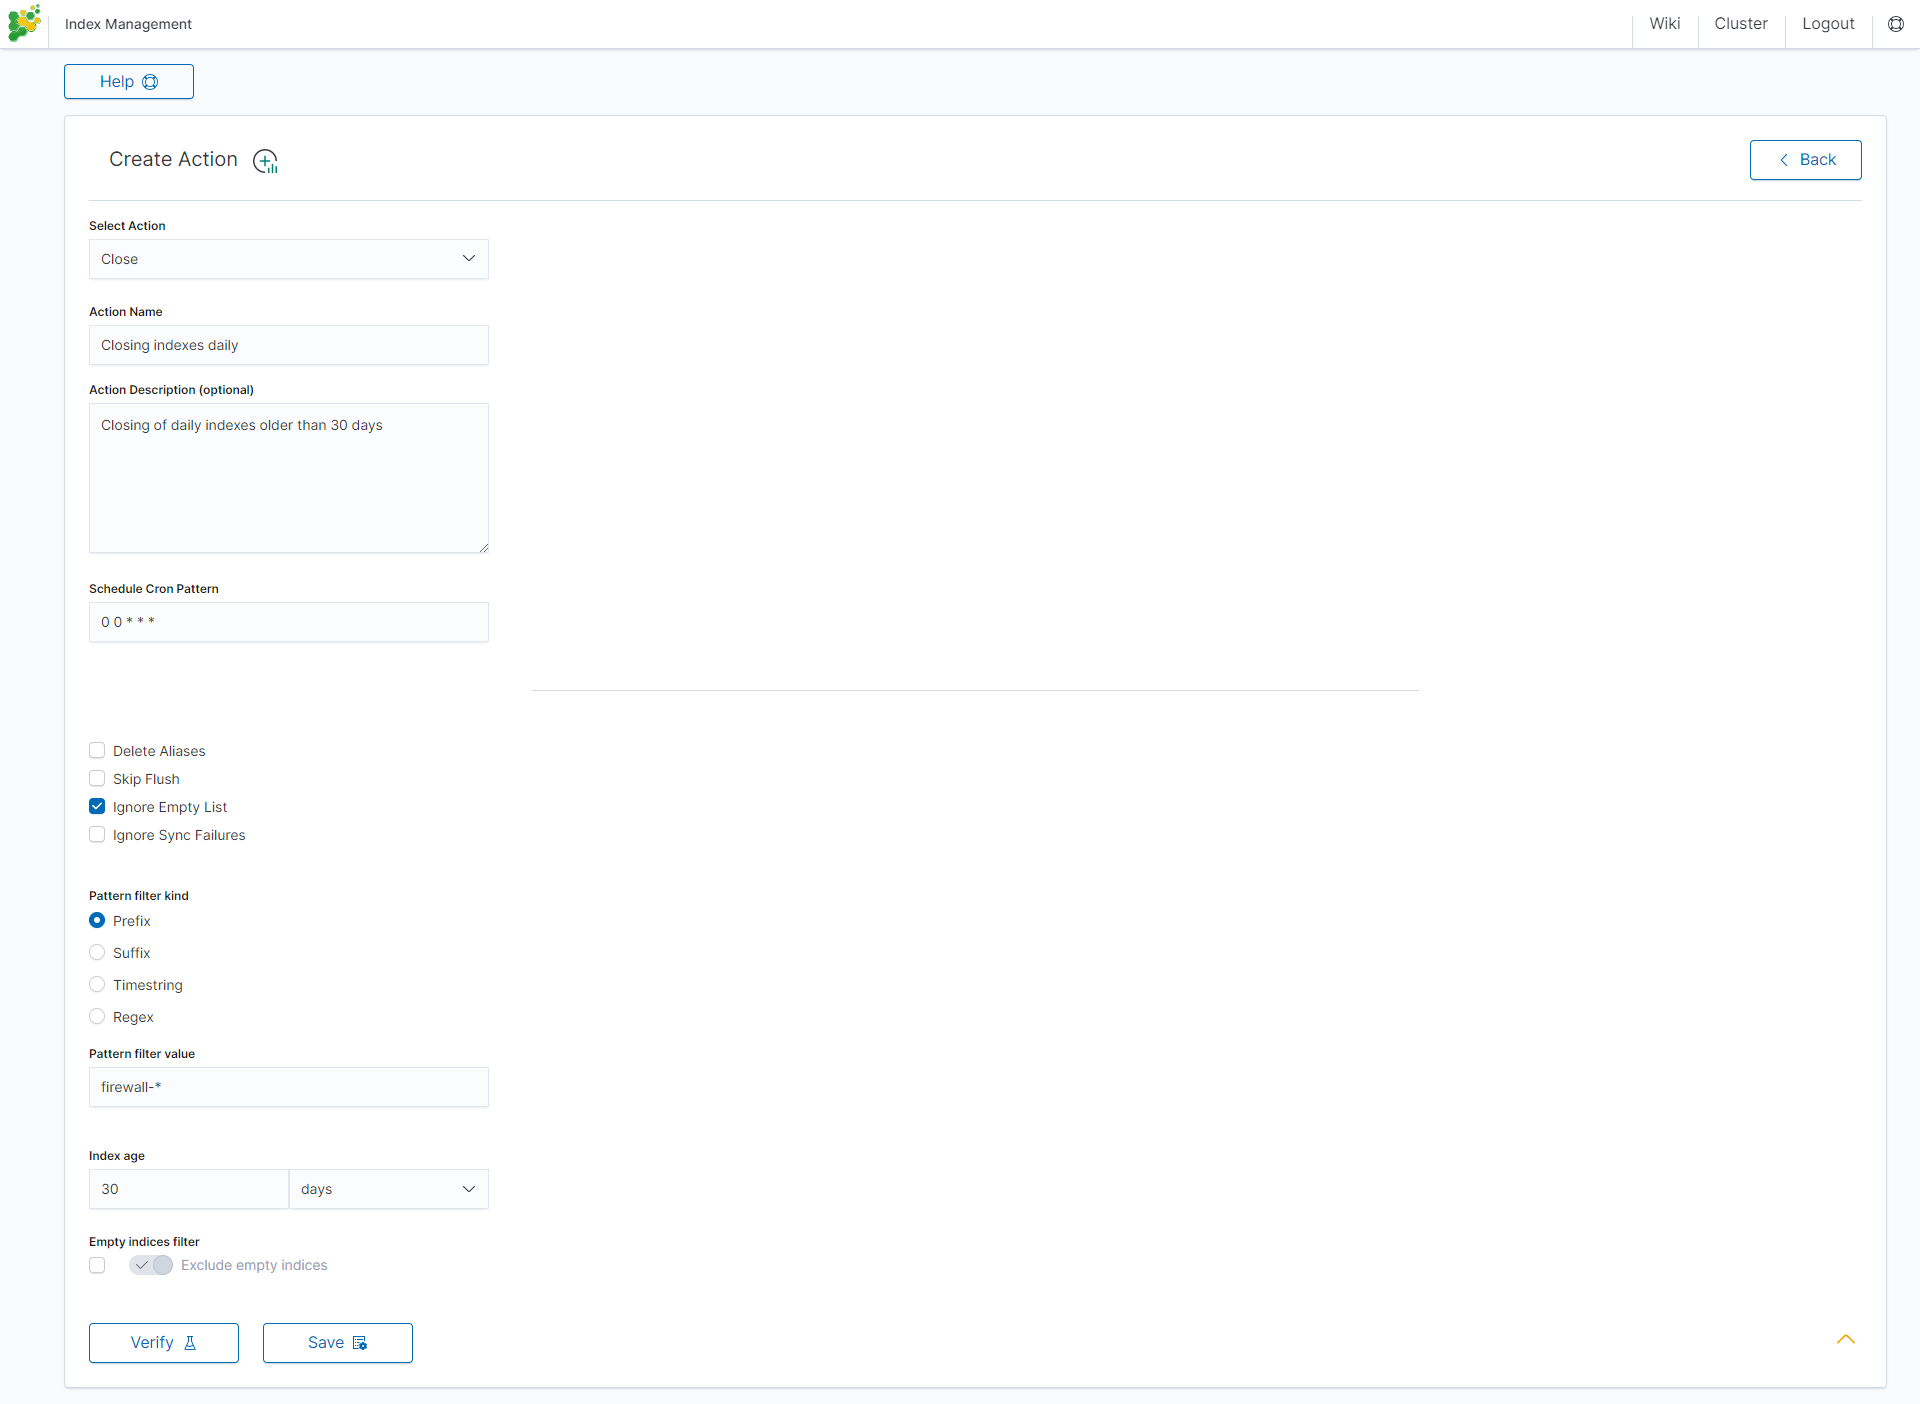
Close action
This action closes the selected indices and optionally deletes associated aliases beforehand.
Settings required:
- Action Name
- Schedule Cron Pattern - it sets when the task is to be executed, to decode cron format use the online tool: https://crontab.guru,
- Pattern filter kind - it sets the index filtertype for the task,
- Pattern filter value - it sets the value for the index filter,
- Index age - it sets the index age for the task.
Optional settings:
- Timeout override
- Ignore Empty List
- Continue if exception
- Closed indices filter
- Empty indices filter
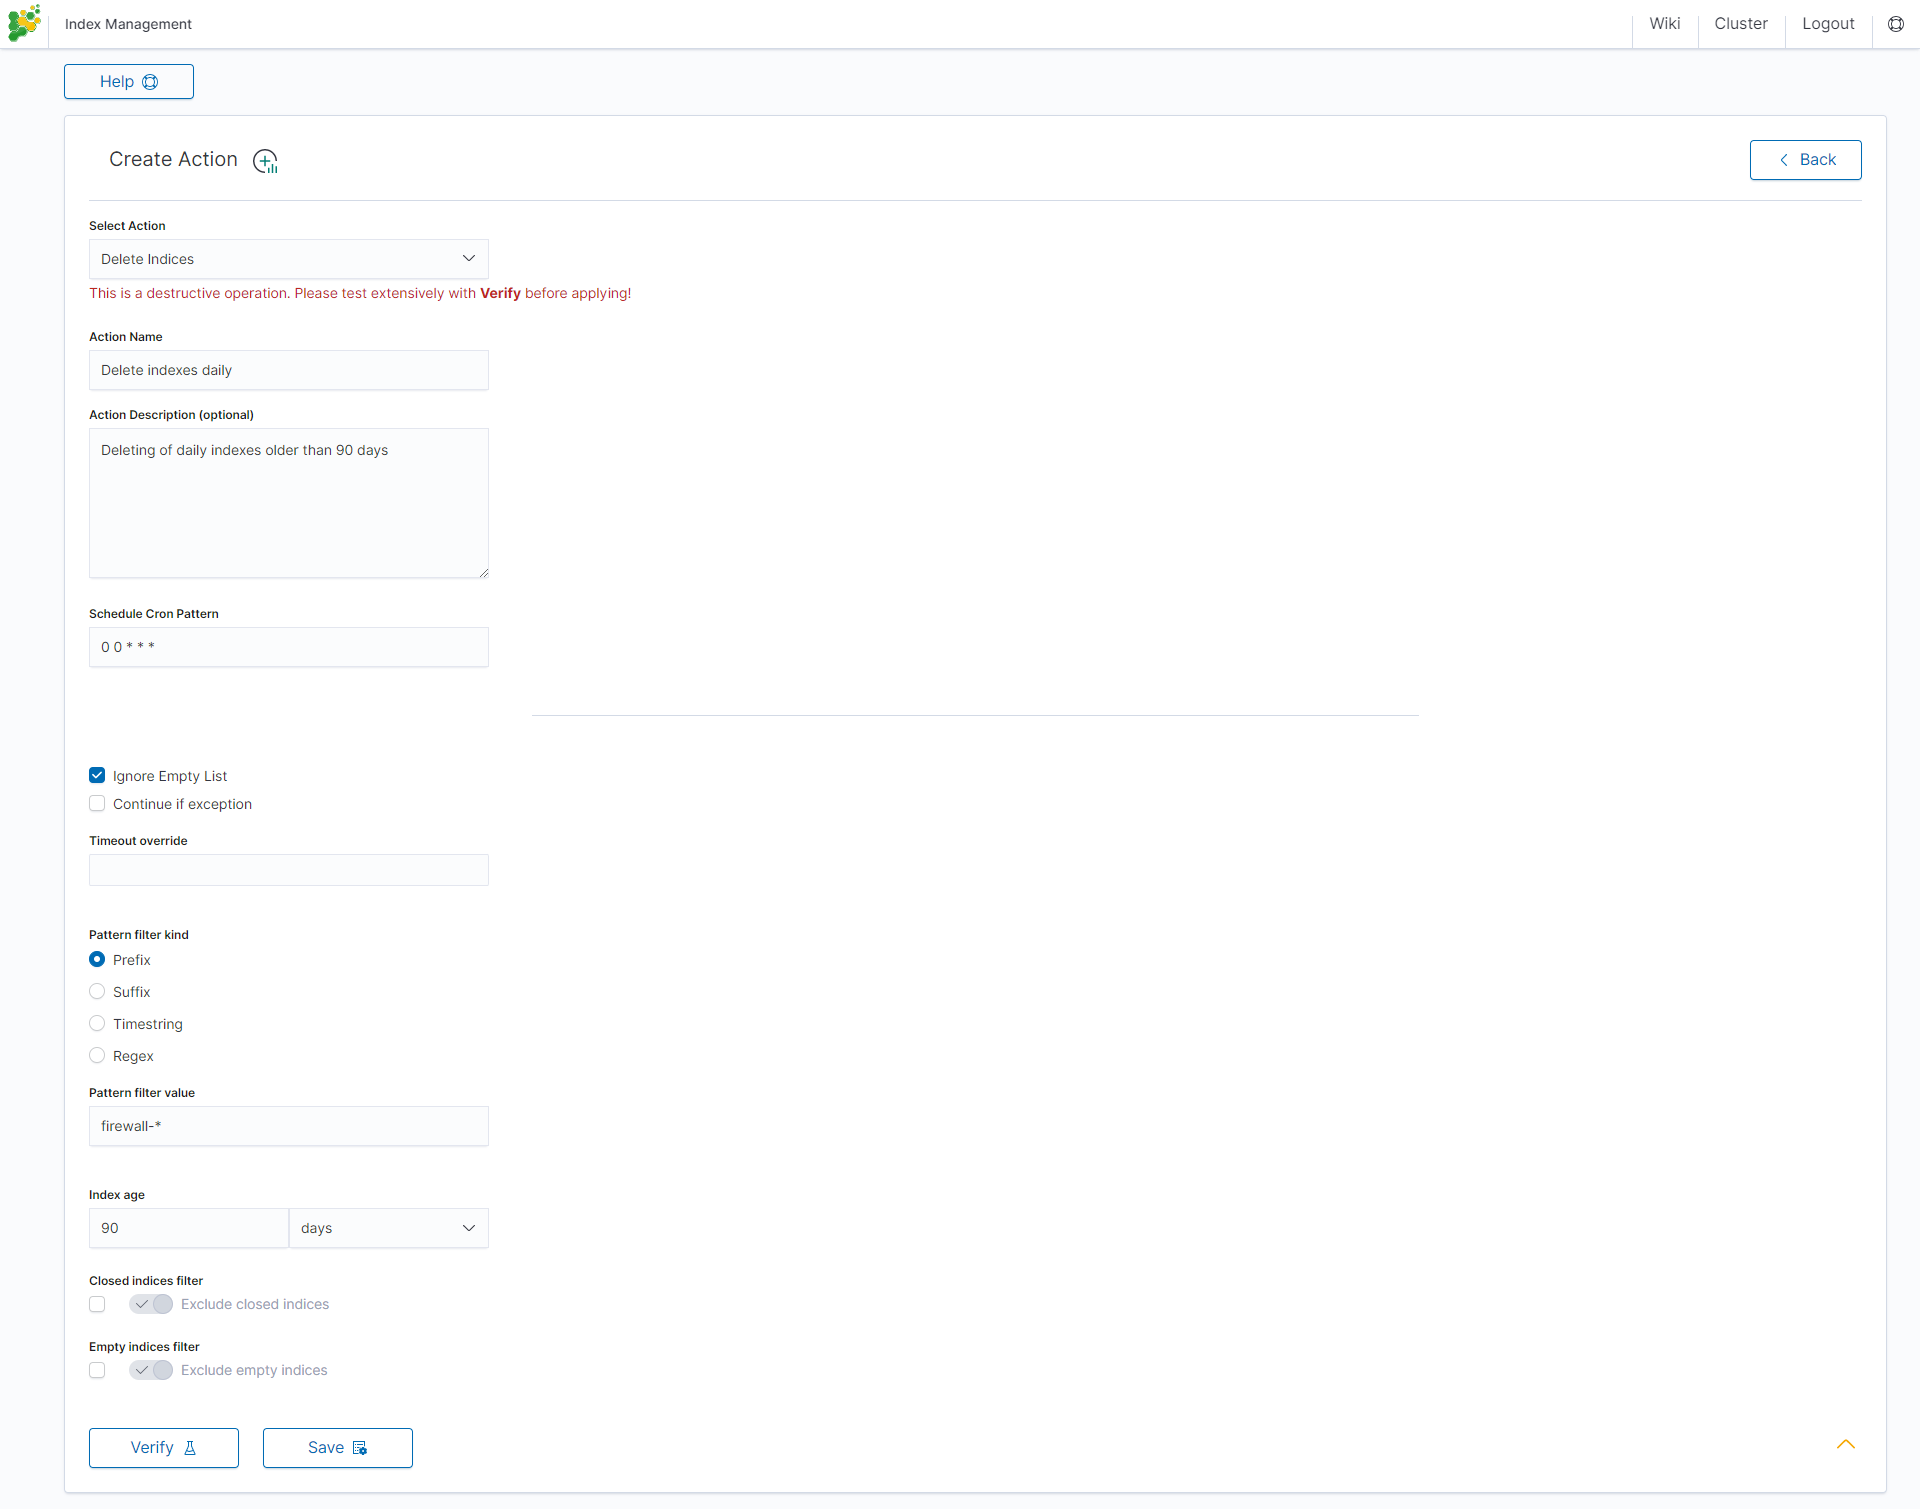
Delete action
This action deletes the selected indices.
Settings required:
- Action Name
- Schedule Cron Pattern - it sets when the task is to be executed, to decode cron format use the online tool: https://crontab.guru/,
- Pattern filter kind - it sets the index filtertype for the task,
- Pattern filter value - it sets the value for the index filter,
- Index age - it sets the index age for the task.
Optional settings:
- Delete Aliases
- Skip Flush
- Ignore Empty List
- Ignore Sync Failures
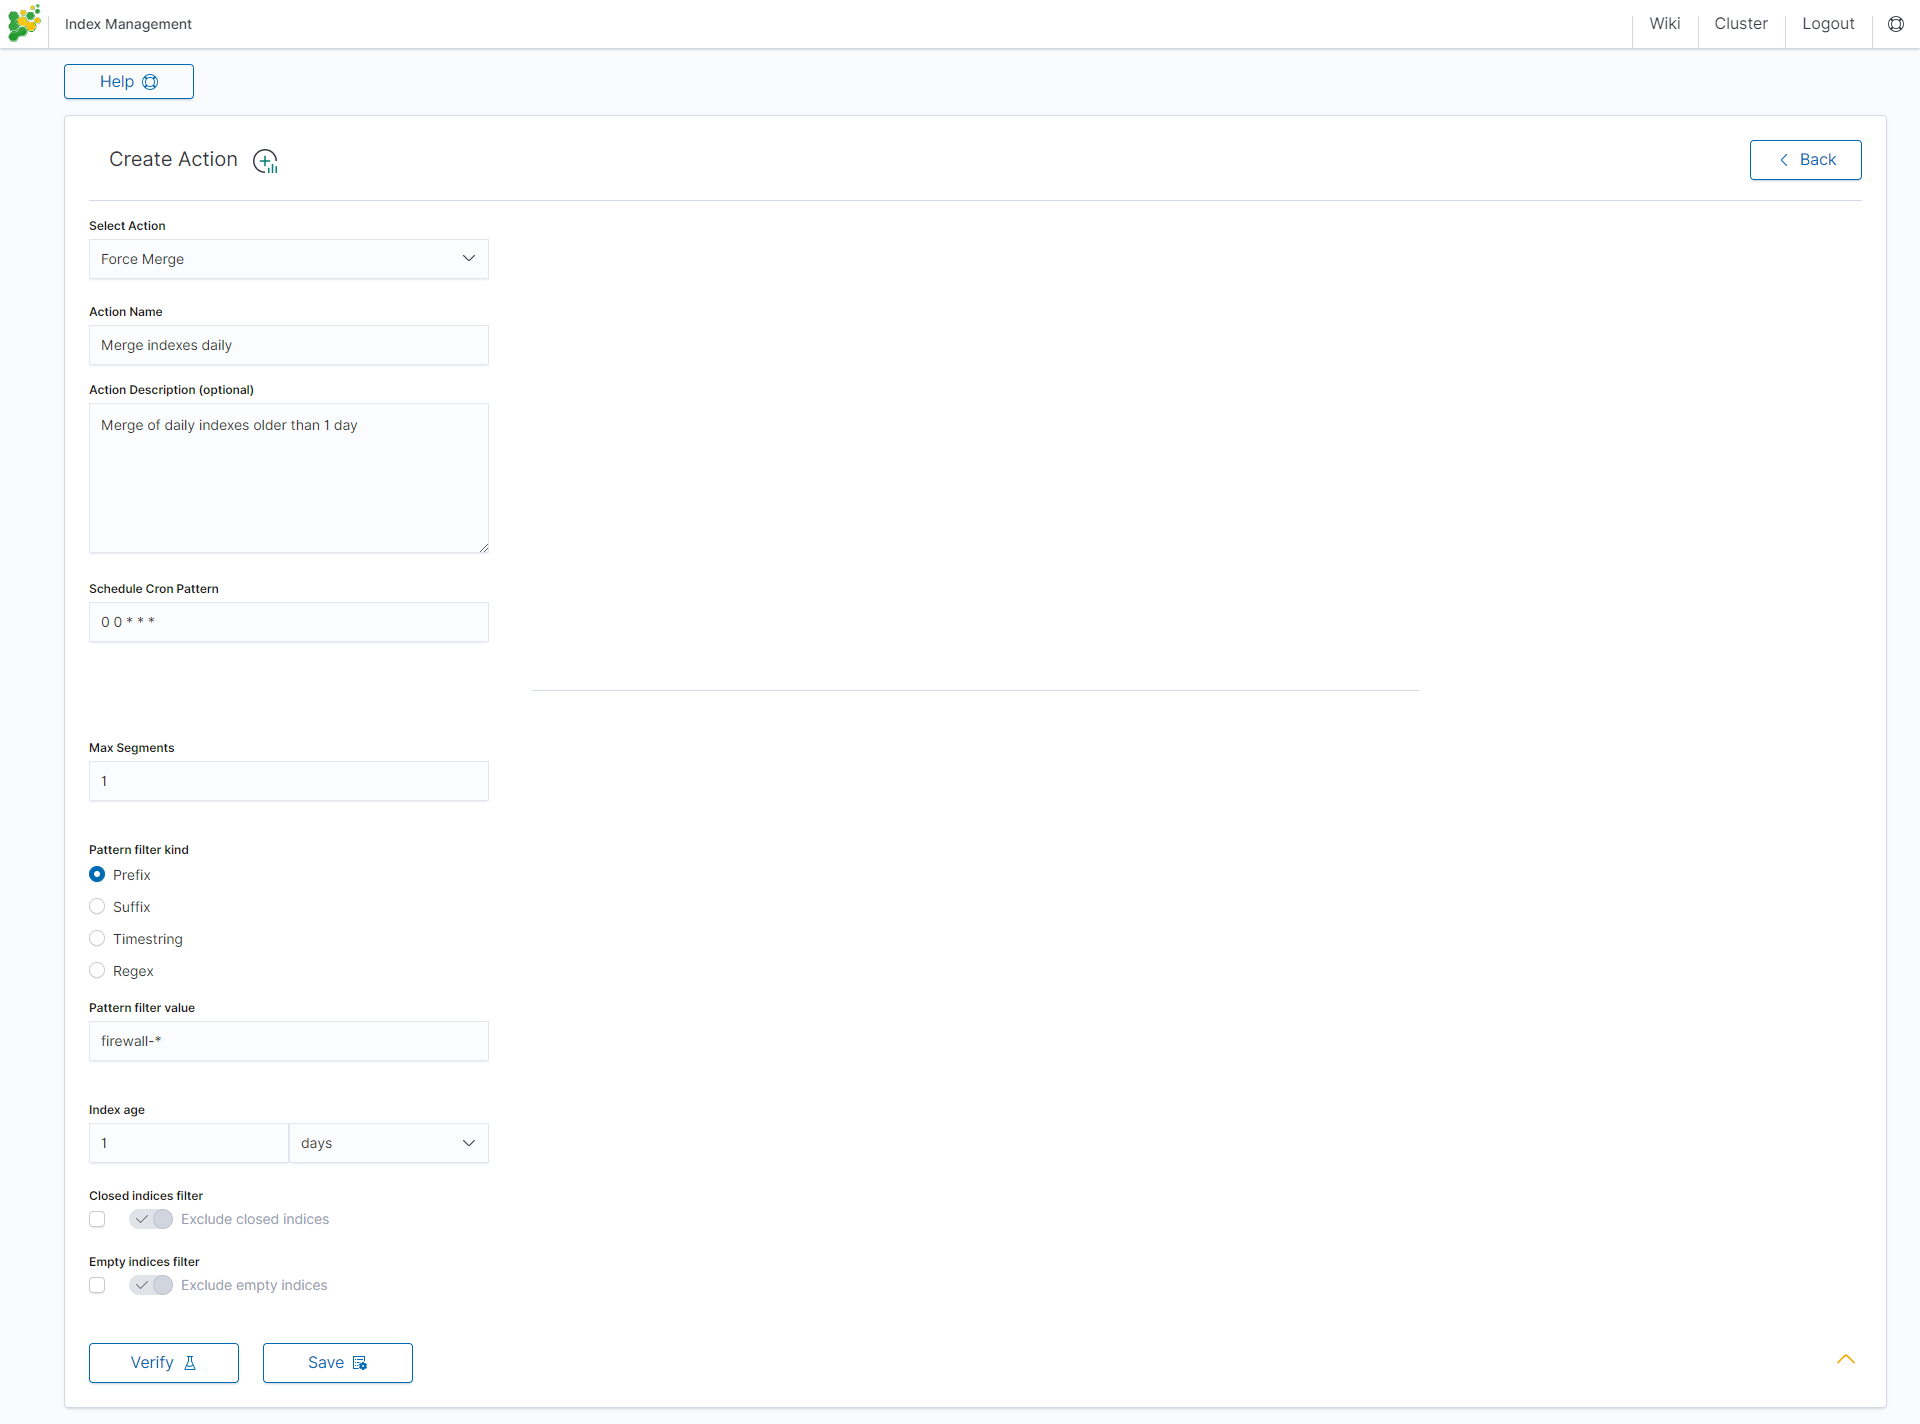
Force Merge action
This action performs a Force Merge on the selected indices, merging them in the specific number of segments per shard.
Settings required:
- Action Name
- Schedule Cron Pattern - it sets when the task is to be executed, to decode cron format use the online tool: https://crontab.guru/,
- Max Segments - it sets the number of segments for the shard,
- Pattern filter kind - it sets the index filtertype for the task,
- Pattern filter value - it sets the value for the index filter,
- Index age - it sets the index age for the task.
Optional settings:
- Ignore Empty List
- Ignore Sync Failures
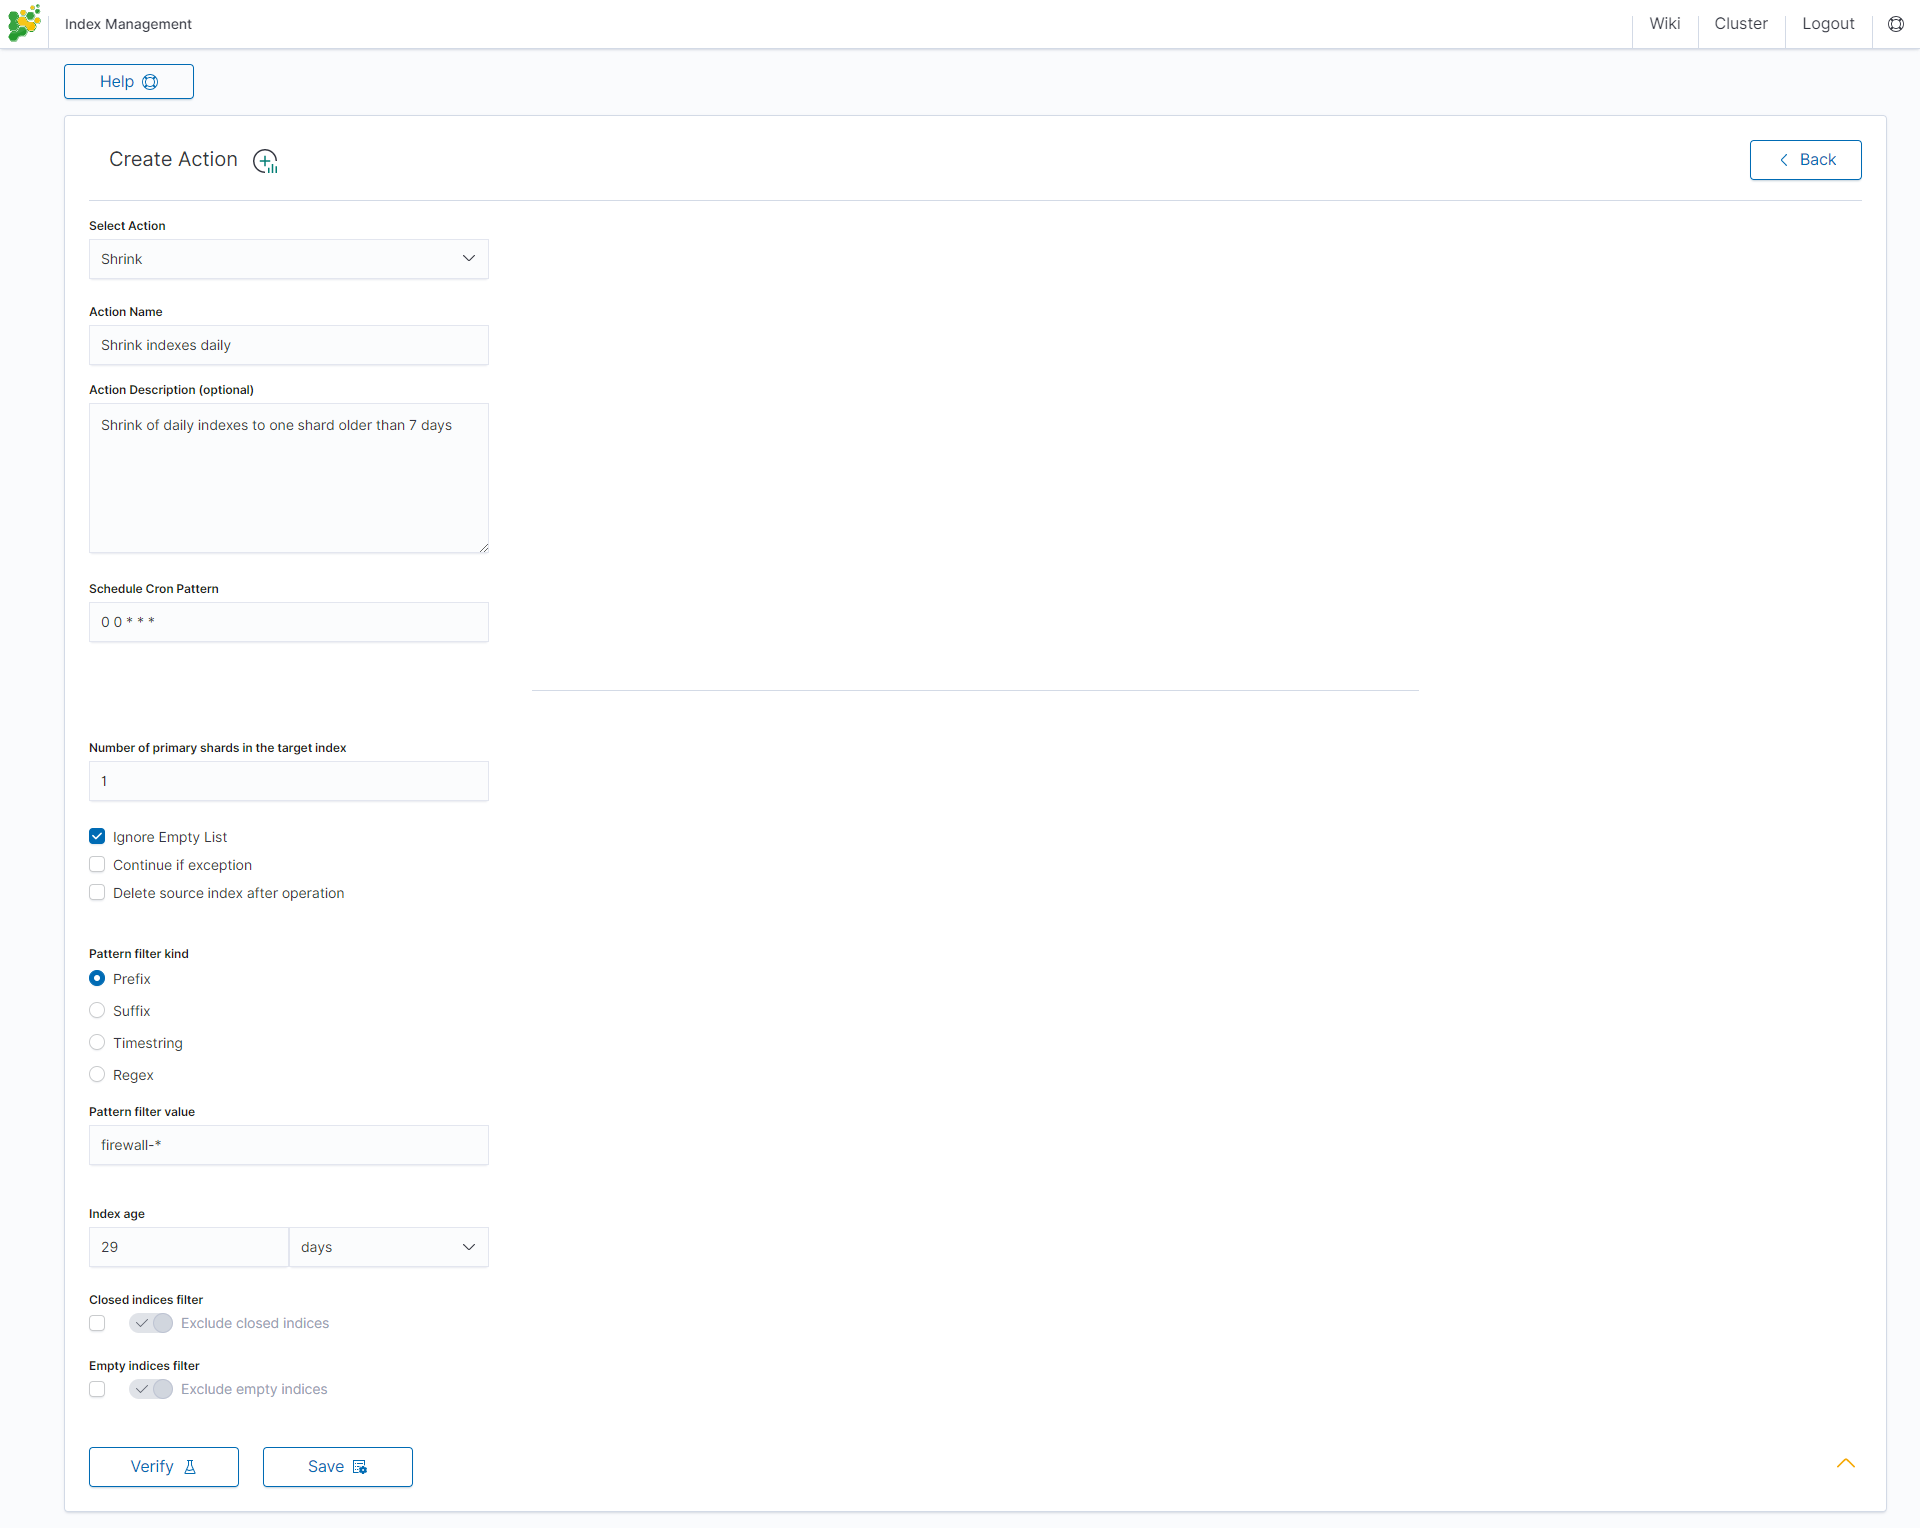
Shrink action
Shrinking an index is a good way to reduce the total shard count in your cluster.
Several conditions need to be met in order for index shrinking to take place:
- The index must be marked as read-only
- A (primary or replica) copy of every shard in the index must be relocated to the same node
- The cluster must have health green
- The target index must not exist
- The number of primary shards in the target index must be a factor of the number of primary shards in the source index.
- The source index must have more primary shards than the target index.
- The index must not contain more than 2,147,483,519 documents in total across all shards that will be shrunk into a single shard on the target index as this is the maximum number of docs that can fit into a single shard.
- The node handling the shrink process must have sufficient free disk space to accommodate a second copy of the existing index.
The task will try to meet these conditions. If it is unable to meet them all, it will not perform a shrink operation.
Settings required:
- Action Name
- Schedule Cron Pattern - it sets when the task is to be executed, to decode cron format use the online tool: https://crontab.guru/,
- Number of primary shards in the target index - it sets the number of shared for the target index,
- Pattern filter kind - it sets the index filtertype for the task,
- Pattern filter value - it sets the value for the index filter,
- Index age - it sets the index age for the task.
Optional settings:
- Ignore Empty List
- Continue if exception
- Delete source index after operation
- Closed indices filter
- Empty indices filter
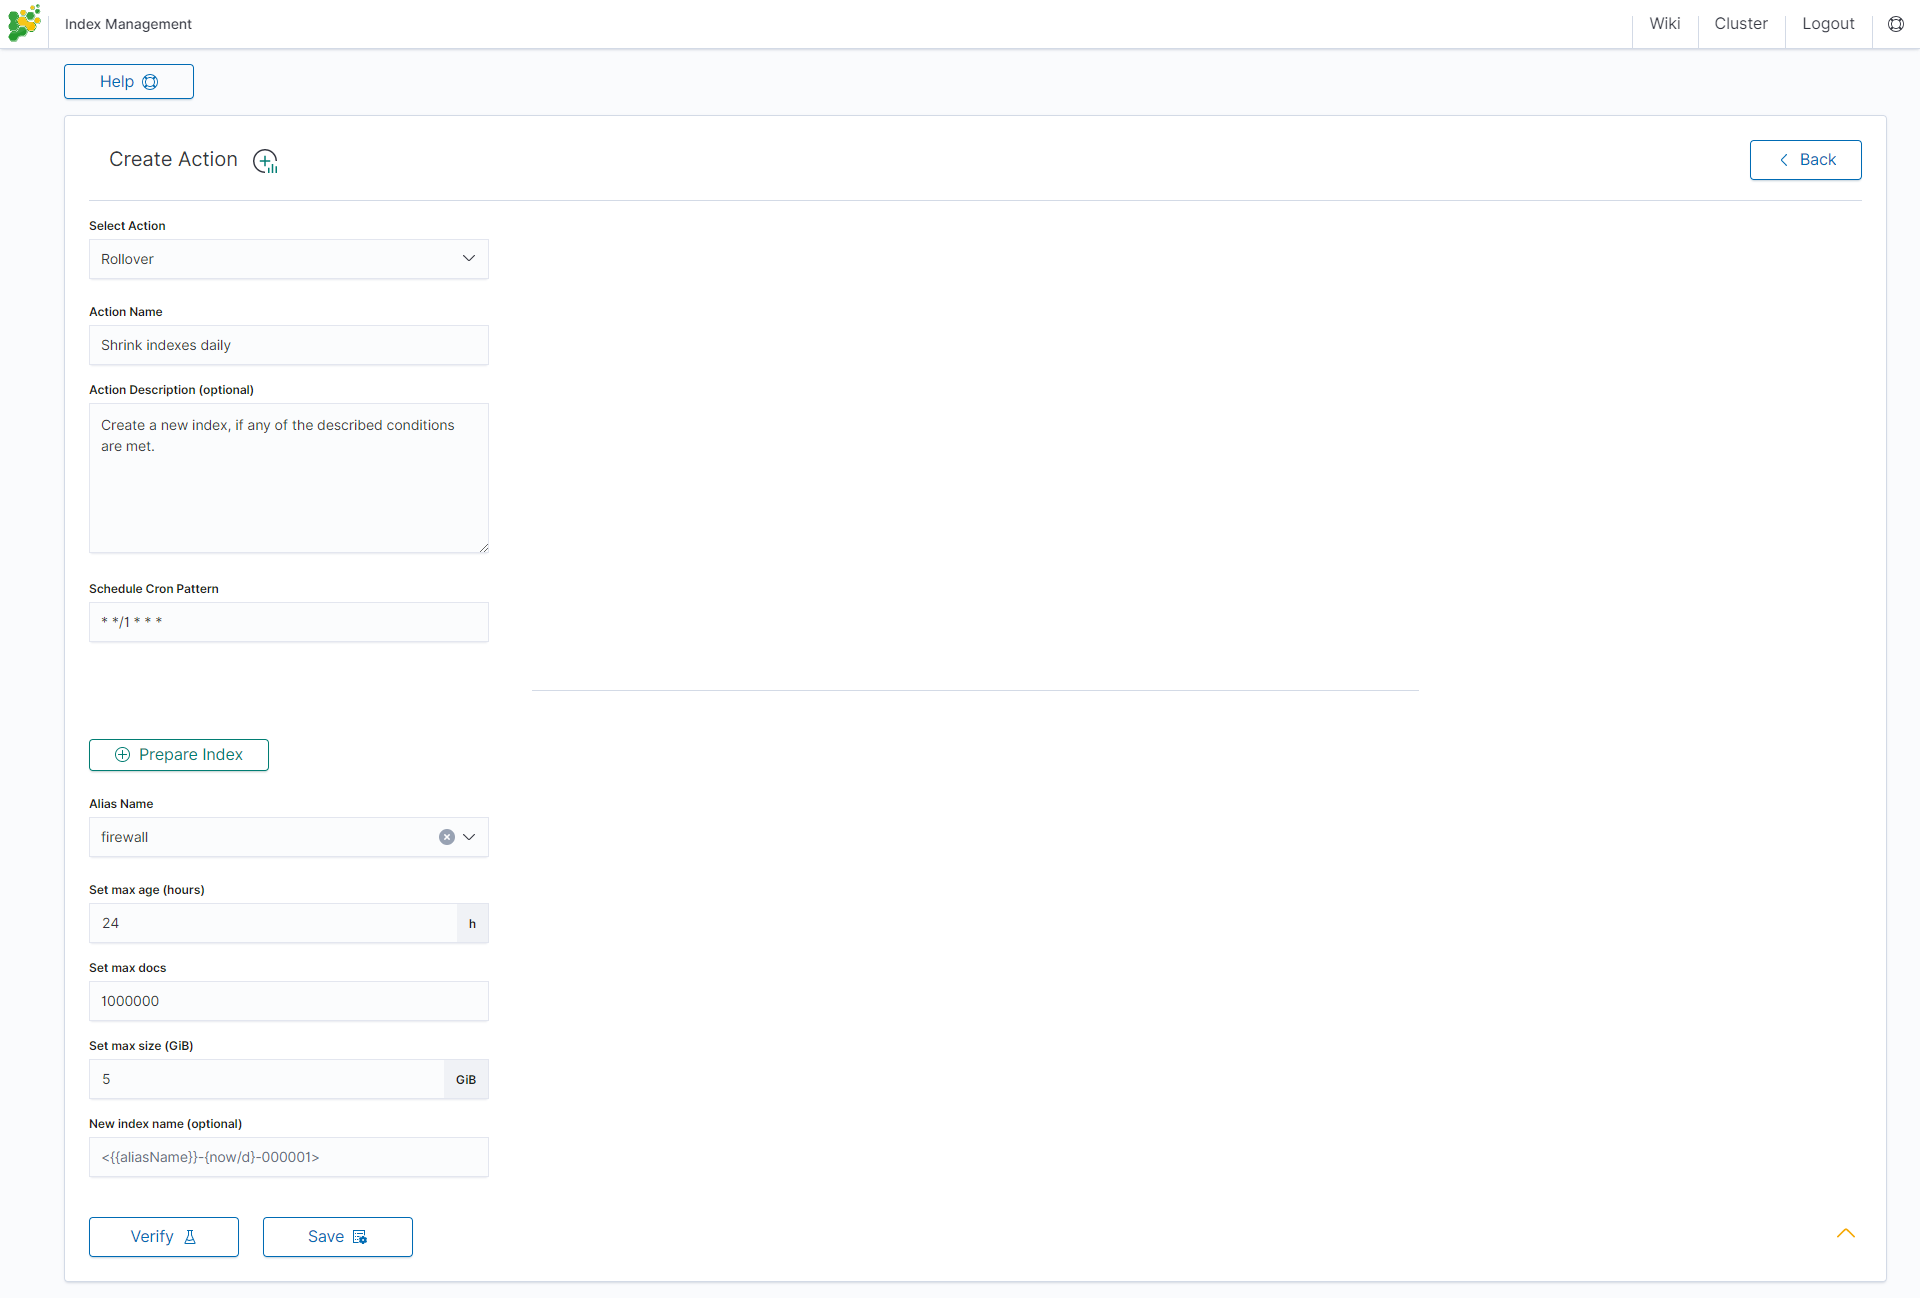
Rollover action
This action uses the Elasticsearch Rollover API to create a new index if any of the described conditions are met.
Settings required:
- Action Name
- Schedule Cron Pattern - it sets when the task is to be executed, to decode cron format use the online tool: https://crontab.guru/,
- Alias Name - it sets an alias for the index,
- Set max age (hours) - it sets an age for the index after then index will rollover,
- Set max docs - it sets a number of documents for the index after which the index will rollover,
- Set max size (GiB) - it sets index size in GB after which the index will rollover.
Optional settings:
- New index name (optional)
Index rollover
Using the rollover function, you can make changes to removing documents from the audit, .agents, and alert* indexes.
You can configure the rollover by going to the Config module, then clicking the Settings tab, going to the Index rollover settings section, and clicking the Configure button:
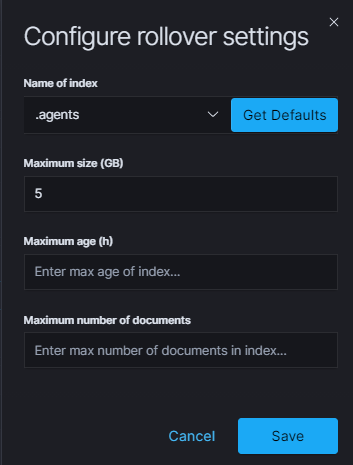
You can set the following retention parameters for the above indexes:
- Maximum size (GB);
- Maximum age (h);
- Maximum number of documents.
Custom action
Additionally, the module allows you to define your own actions in line with the Curator documentation: https://www.elastic.co/guide/en/elasticsearch/client/curator/current/actions.html
To create a Custom action, select Custom from Select Action, enter a name in the Action Name field, and set the schedule in the Schedule Cron Pattern field. In the edit field, enter the definition of a custom action:
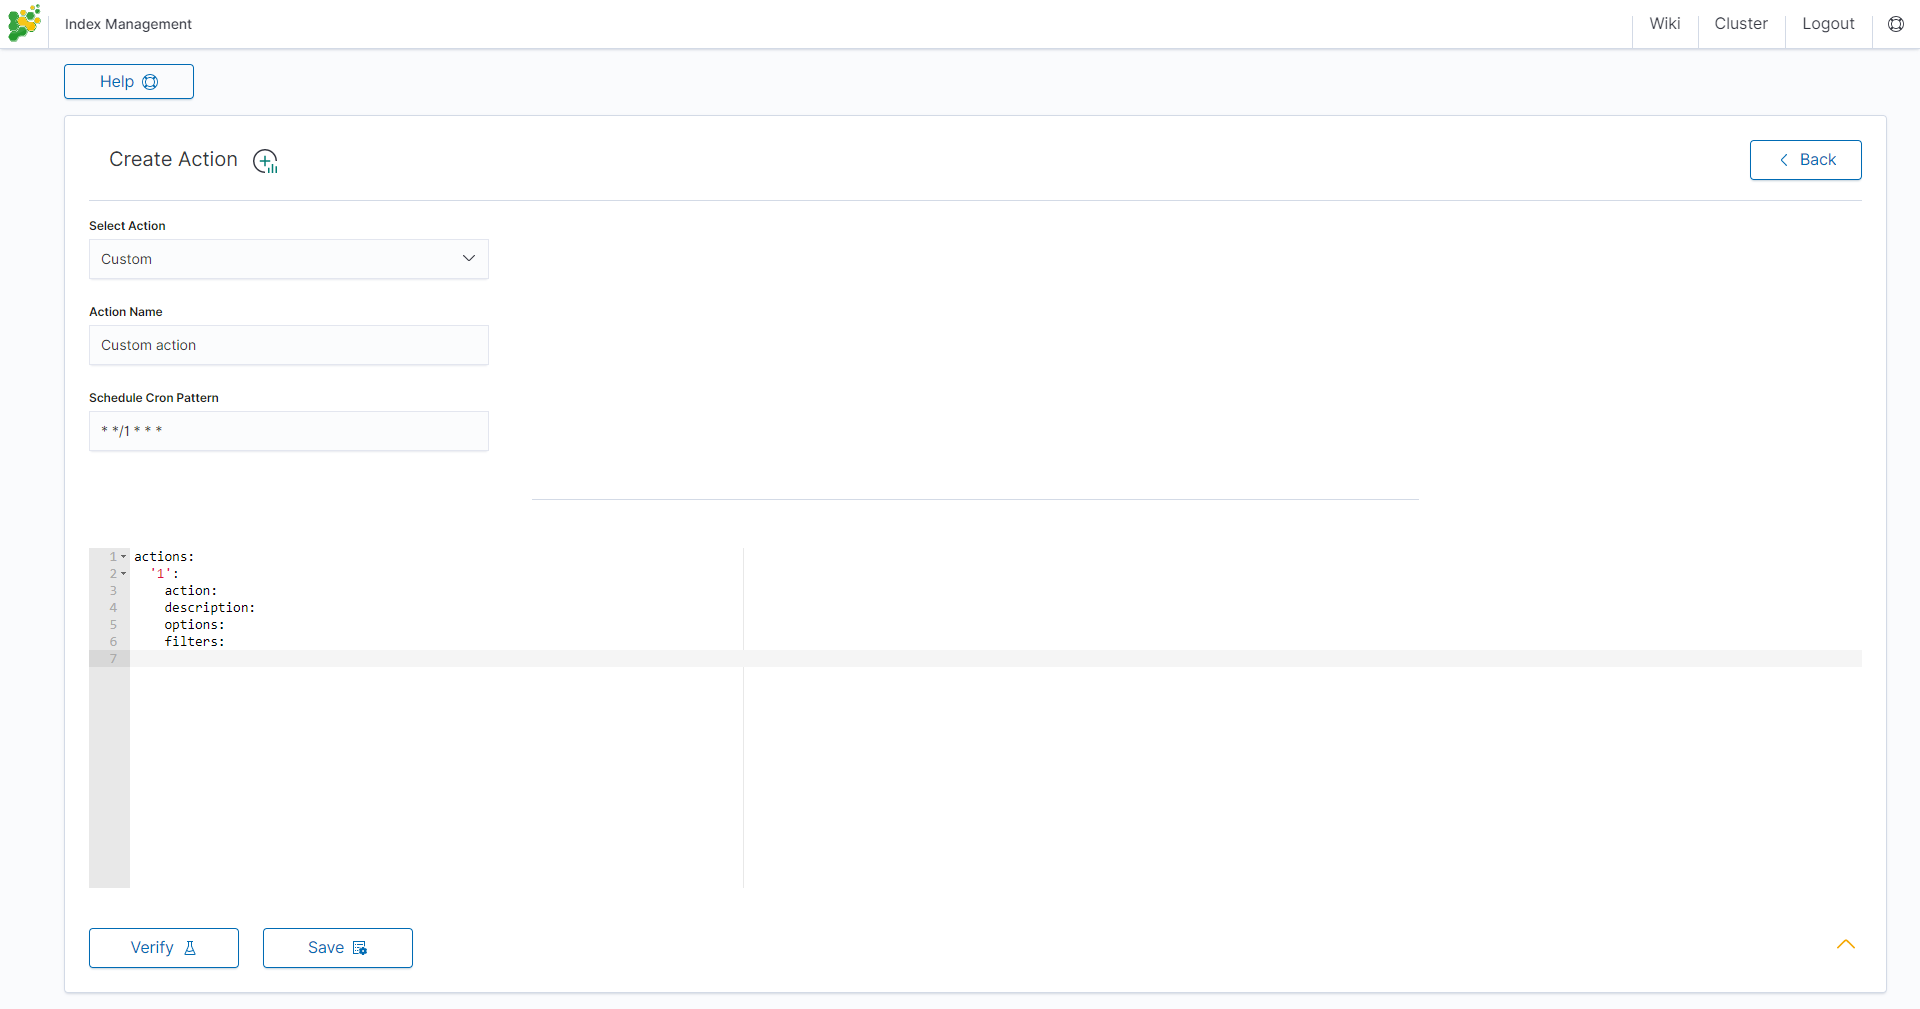
Custom Action examples:
Open index
actions:
  1:
    action: open
    description: >-
      Open indices older than 30 days but younger than 60 days (based on index
      name), for logstash- prefixed indices.
    options:
      timeout_override:
      continue_if_exception: False
      disable_action: True
    filters:
    - filtertype: pattern
      kind: prefix
      value: logstash-
      exclude:
    - filtertype: age
      source: name
      direction: older
      timestring: '%Y.%m.%d'
      unit: days
      unit_count: 30
      exclude:
    - filtertype: age
      source: name
      direction: younger
      timestring: '%Y.%m.%d'
      unit: days
      unit_count: 60
      exclude:
Replica reduce
actions:
  1:
    action: replicas
    description: >-
      Reduce the replica count to 0 for logstash- prefixed indices older than
      10 days (based on index creation_date)
    options:
      count: 0
      wait_for_completion: False
      timeout_override:
      continue_if_exception: False
      disable_action: True
    filters:
    - filtertype: pattern
      kind: prefix
      value: logstash-
      exclude:
    - filtertype: age
      source: creation_date
      direction: older
      unit: days
      unit_count: 10
      exclude:
Index allocation
actions:
  1:
    action: allocation
    description: >-
      Apply shard allocation routing to 'require' 'tag=cold' for hot/cold node
      setup for logstash- indices older than 3 days, based on index_creation
      date
    options:
      key: tag
      value: cold
      allocation_type: require
      disable_action: True
    filters:
    - filtertype: pattern
      kind: prefix
      value: logstash-
    - filtertype: age
      source: creation_date
      direction: older
      unit: days
      unit_count: 3
Cluster routing
actions:
  1:
    action: cluster_routing
    description: >-
      Disable shard routing for the entire cluster.
    options:
      routing_type: allocation
      value: none
      setting: enable
      wait_for_completion: True
      disable_action: True
  2:
    action: (any other action details go here)
    ...
  3:
    action: cluster_routing
    description: >-
      Re-enable shard routing for the entire cluster.
    options:
      routing_type: allocation
      value: all
      setting: enable
      wait_for_completion: True
      disable_action: True
Preinstalled actions
Close-Daily
This action closes the selected indices older than 93 days and optionally deletes associated aliases beforehand. For example, if it is today 21 December this action will close or optionally delete every index older than 30 September of the same year, action starts every day at 01:00 AM.
Action type: CLOSE Action name: Close-Daily Action Description (optional): Close daily indices older than 90 days Schedule Cron Pattern : 0 1 * * * Delete Aliases: enabled Skip Flush: disabled Ignore Empty List: enabled Ignore Sync Failures: enabled Pattern filter kind: Timestring Pattern filter value: %Y.%m$ Index age: 93 days Empty indices filter: disable
Close-Monthly
This action closes the selected indices older than 93 days (3 months)and optionally deletes associated aliases beforehand. If it today is 21 December, this action will close or optionally delete every index older than Oktober the same year, the action starts every day at 01:00 AM.
Action type: CLOSE Action name: Close-Daily Action Description (optional): Close daily indices older than 93 days Schedule Cron Pattern: 0 1 * * * Delete Aliases: enabled Skip Flush: disabled Ignore Empty List: enabled Ignore Sync Failures: enabled Pattern filter kind: Timestring Pattern filter value: %Y.%m$ Index age: 93 days Empty indices filter: disable
Disable-Refresh-Older-Than-Days
This action disables the daily refresh of indices older than 2 days. the action is performed daily at 01:00.
Action type: CUSTOM Action name: Disable-Refresh-Older-Than-Days Schedule Cron Pattern: 0 1 * * *
YAML:
actions:
  '1':
    action: index_settings
    description: Disable refresh for older daily indices
    options:
      index_settings:
        index:
          refresh_interval: -1
      ignore_unavailable: False
      ignore_empty_list: true
      preserve_existing: False
    filters:
      - filtertype: pattern
        kind: timestring
        value: '%Y.%m.%d$'
      - filtertype: age
        source: creation_date
        direction: older
        unit: days
        unit_count: 2
Disable-Refresh-Older-Than-Month
This action forces the daily merge of indices older than one month. The action is performed daily at 01:00.
Action type: CUSTOM Action name: Disable-Refresh-Older-Than-Month Schedule Cron Pattern: 0 1 * * *
YAML:
actions:
  '1':
    action: index_settings
    description: Disable refresh for older monthly indices
    options:
      index_settings:
        index:
          refresh_interval: -1
      ignore_unavailable: False
      ignore_empty_list: true
      preserve_existing: False
    filters:
      - filtertype: pattern
        kind: timestring
        value: '%Y.%m$'
      - filtertype: age
        source: creation_date
        direction: older
        unit: days
        unit_count: 32
Force-Merge-Older-Than-Days
This action forces the daily merge of indices older than two days. The action is performed daily at 01:00.
Action type: CUSTOM Action name: Force-Merge-Older-Than-Days Schedule Cron Pattern: 0 1 * * *
YAML:
actions:
  '1':
    action: forcemerge
    description: Force merge on older daily indices
    options:
      max_num_segments: 1
      ignore_empty_list: true
      continue_if_exception: false
      delay: 60
    filters:
      - filtertype: pattern
        kind: timestring
        value: '%Y.%m.%d$'
      - filtertype: age
        source: creation_date
        direction: older
        unit: days
        unit_count: 2
      - filtertype: forcemerged
        max_num_segments: 1
        exclude: True
Force-Merge-Older-Than-Months
This action forces the daily merge of indices older than one month. The action is performed daily at 01:00.
Action type: CUSTOM Action name: Force-Merge-Older-Than-Months Schedule Cron Pattern: 0 1 * * *
YAML:
actions:
  '1':
    action: forcemerge
    description: Force merge on older monthly indices
    options:
      max_num_segments: 1
      ignore_empty_list: true
      continue_if_exception: false
      delay: 60
    filters:
      - filtertype: pattern
        kind: timestring
        value: '%Y.%m$'
      - filtertype: age
        source: creation_date
        direction: older
        unit: days
        unit_count: 32
      - filtertype: forcemerged
        max_num_segments: 1
        exclude: True
Logtrail-default-delete
This action leaves only two last indices from each logtrail rollover index ( allows for up to 10GB of data). The action is performed daily at 03:30.
Action type: CUSTOM Action name: Logtrail-default-delete Schedule Cron Pattern: 30 3 * * *
YAML:
actions:
  '1':
    action: delete_indices
    description: >-
      Leave only two last indices from each logtrail rollover index - allows for up to
      10GB data.
    options:
      ignore_empty_list: true
      continue_if_exception: true
    filters:
      - filtertype: count
        count: 2
        pattern: '^logtrail-(.*?)-\d{4}.\d{2}.\d{2}-\d+$'
        reverse: true
Logtrail-default-rollover
This action rollover default Logtrail indices. The action is performed every 5 minutes.
Action type: CUSTOM Action name: Logtrail-default-rollover Schedule Cron Pattern: 5 * * * *
YAML:
actions:
  '1':
    action: rollover
    description: >-
      This action works on default logtrail indices. It is recommended to enable
      it.
    options:
      name: logtrail-alert
      conditions:
        max_size: 5GB
      continue_if_exception: true
      allow_ilm_indices: true
  '2':
    action: rollover
    description: >-
      This action works on default logtrail indices. It is recommended to enable
      it.
    options:
      name: logtrail-elasticsearch
      conditions:
        max_size: 5GB
      continue_if_exception: true
      allow_ilm_indices: true
  '3':
    action: rollover
    description: >-
      This action works on default logtrail indices. It is recommended to enable
      it.
    options:
      name: logtrail-kibana
      conditions:
        max_size: 5GB
      continue_if_exception: true
      allow_ilm_indices: true
  '4':
    action: rollover
    description: >-
      This action works on default logtrail indices. It is recommended to enable
      it.
    options:
      name: logtrail-logstash
      conditions:
        max_size: 5GB
      continue_if_exception: true
      allow_ilm_indices: true
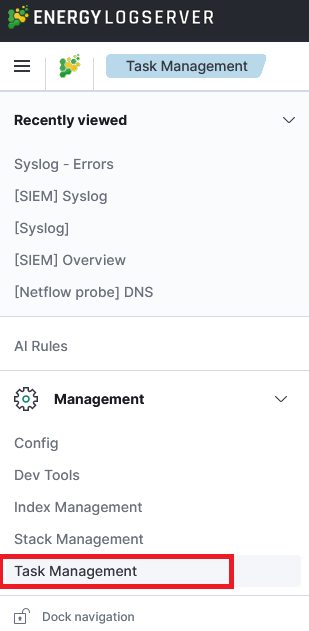
Task Management
Energy Logserver provides the ability to manage tasks. Table with running tasks is located in Task Management section.
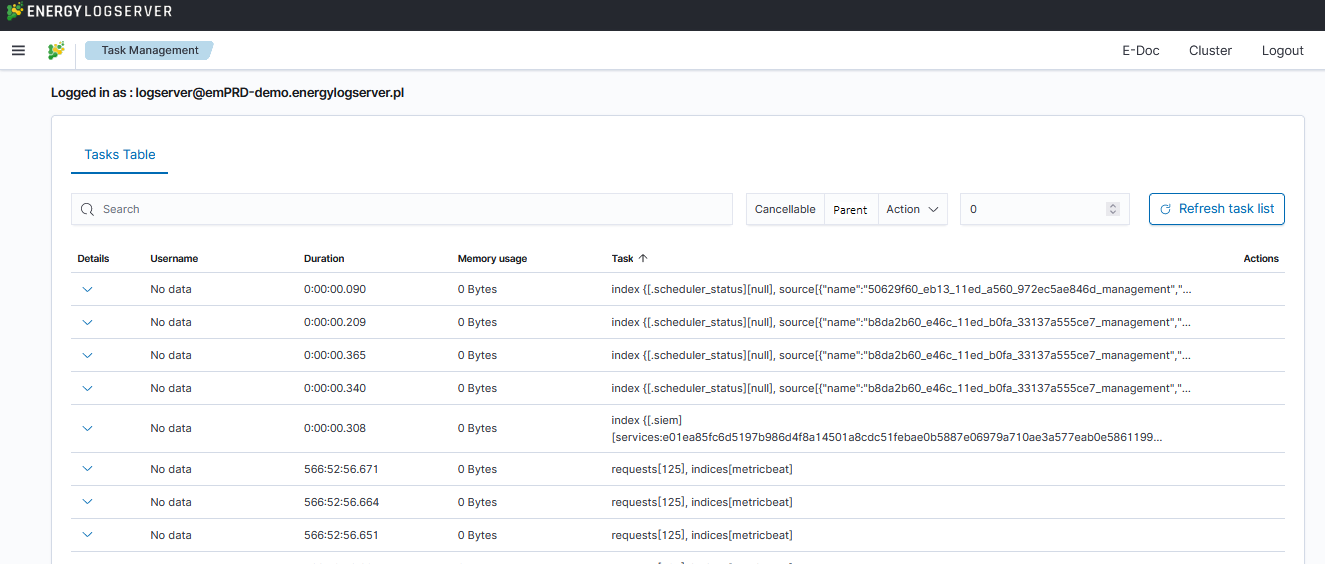
Long Running Query
If query is cancellable trash icon is available in Actions column. (Note: Not every query can be canceled)

Searchbar and filtering
It is possible to search for running task using searchbar. There are provided four types of filtering:
Cancellable- It filters only cancellable tasks.Parent- This option filters only parent tasks.Action- It filters by action ( Sample action:indices:data/write/bulk).Running time in seconds- When checked, only shows tasks that take longer than a specified number of seconds.
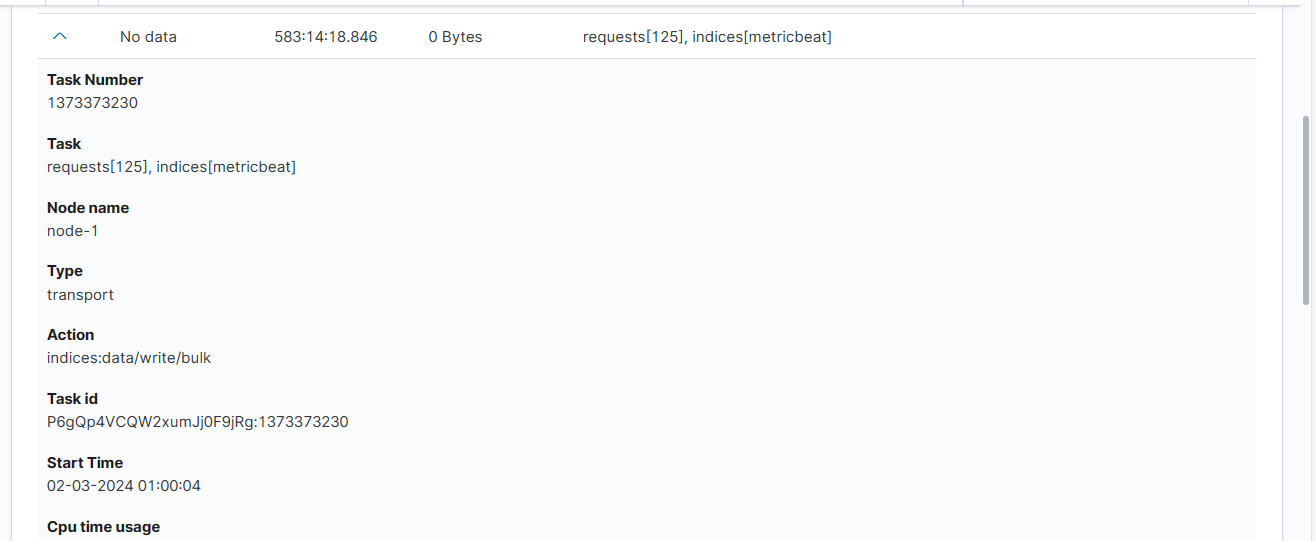
Task Details
Expanding the details column provides more information about a given task. (Note: Depending on the type of task, different information may be provided.)
Empowered AI
Empowered AI is a module of Energy Logserver containing mathematical algorithms for data science.
It is licenced extention for SIEM deplyment. Main purpose of the Empowered AI is to help SOC teams see that data which are difficult to detect with regular approach. Advance mathematical sorting, grouping, forecastig enriched with statistics create a new outlook of security posture.
Empowered AI is an ongoing project. Our team of mathematicians, data scientists and security analysts continue their work addressing more and more new usecases.
AI Rules
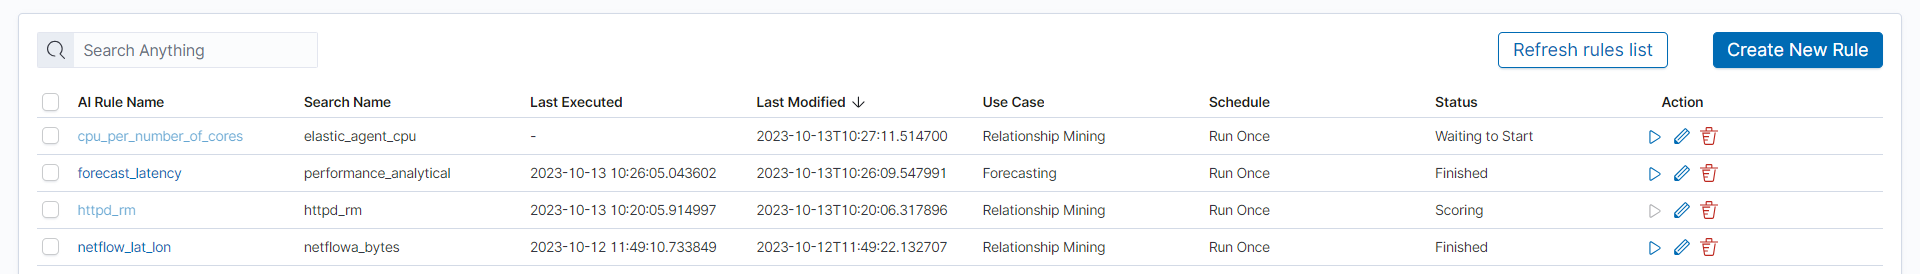
In the Empowered AI section you will find a summary of the existing rules. At the top, you’ll find the total number of rules and the number of scheduled and unscheduled rules. Here is the search field and buttons Refresh rules list and Create New Rule Below is the table. It contains AI Rule Name, Search/Index Name - data source, Last Executed - date, Last Modified - date, selected Use Case, Schedule - scheduling frequency, Status and Action icons.
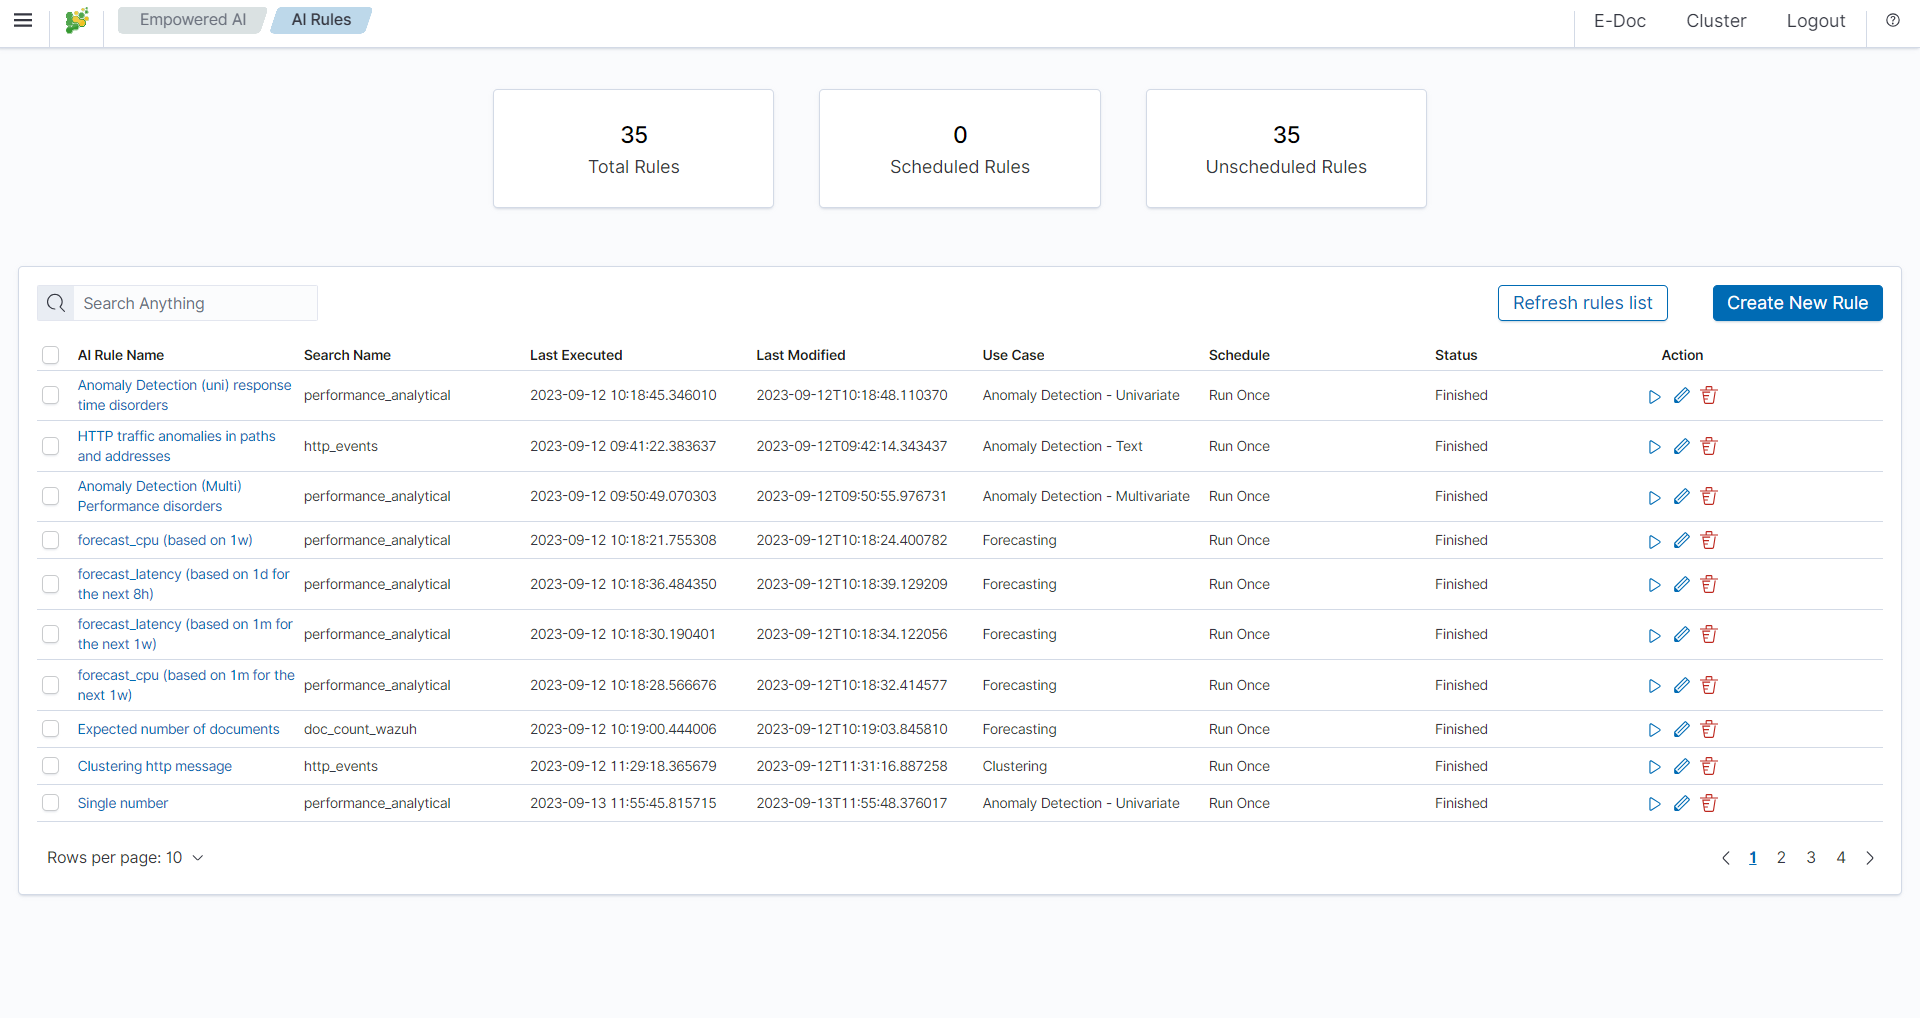
Status
The rule has one of the following statuses:
- Waiting to start -
Run oncerule starts by clicking symbol play. - Scheduled - the scheduled rule starts automatically.
- Scoring
- Building
- Finished - click on the
AI Rule Nameto get the forecast results previewAI Rules>Performance. - Error - check error details in the results preview
Performance>AI Rule Configuration>Exceptions.
Actions
Icons of actions:
- Play – run or rerun the rule,
- Stop – unschedule periodic rule, after this action rule type changes to Run Once,
- Pencil - edit the rule’s configuration,
- Bin – delete the rule.
Prepare your data set
Save your Discover search so you can use it the same way as in visualizations and dashboards.
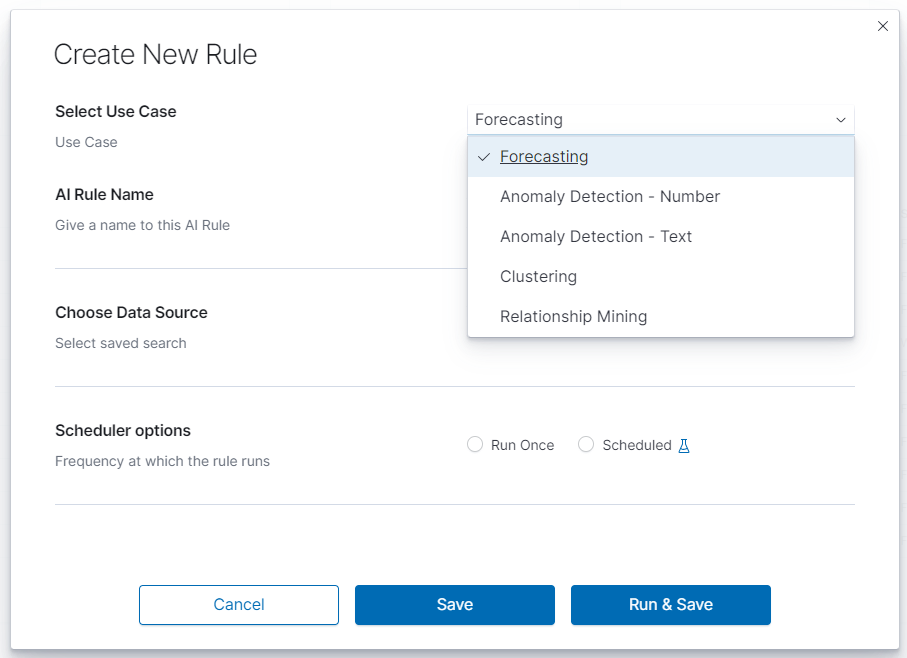
Create New Rule
To create a rule choose ``Empowered AI>AI Rules>Create New Rule. In pop-up form Select Use Case. The Empowered AI module contains AI models for various use cases: Forecasting, Anomaly Detection - Number, Anomaly Detection - Text, Clustering and Relationship Mining.
Performance
To see the result of the finished rule click on the link in the column AI Rule Name. Here we have AI Rule Configuration and Model Performance.
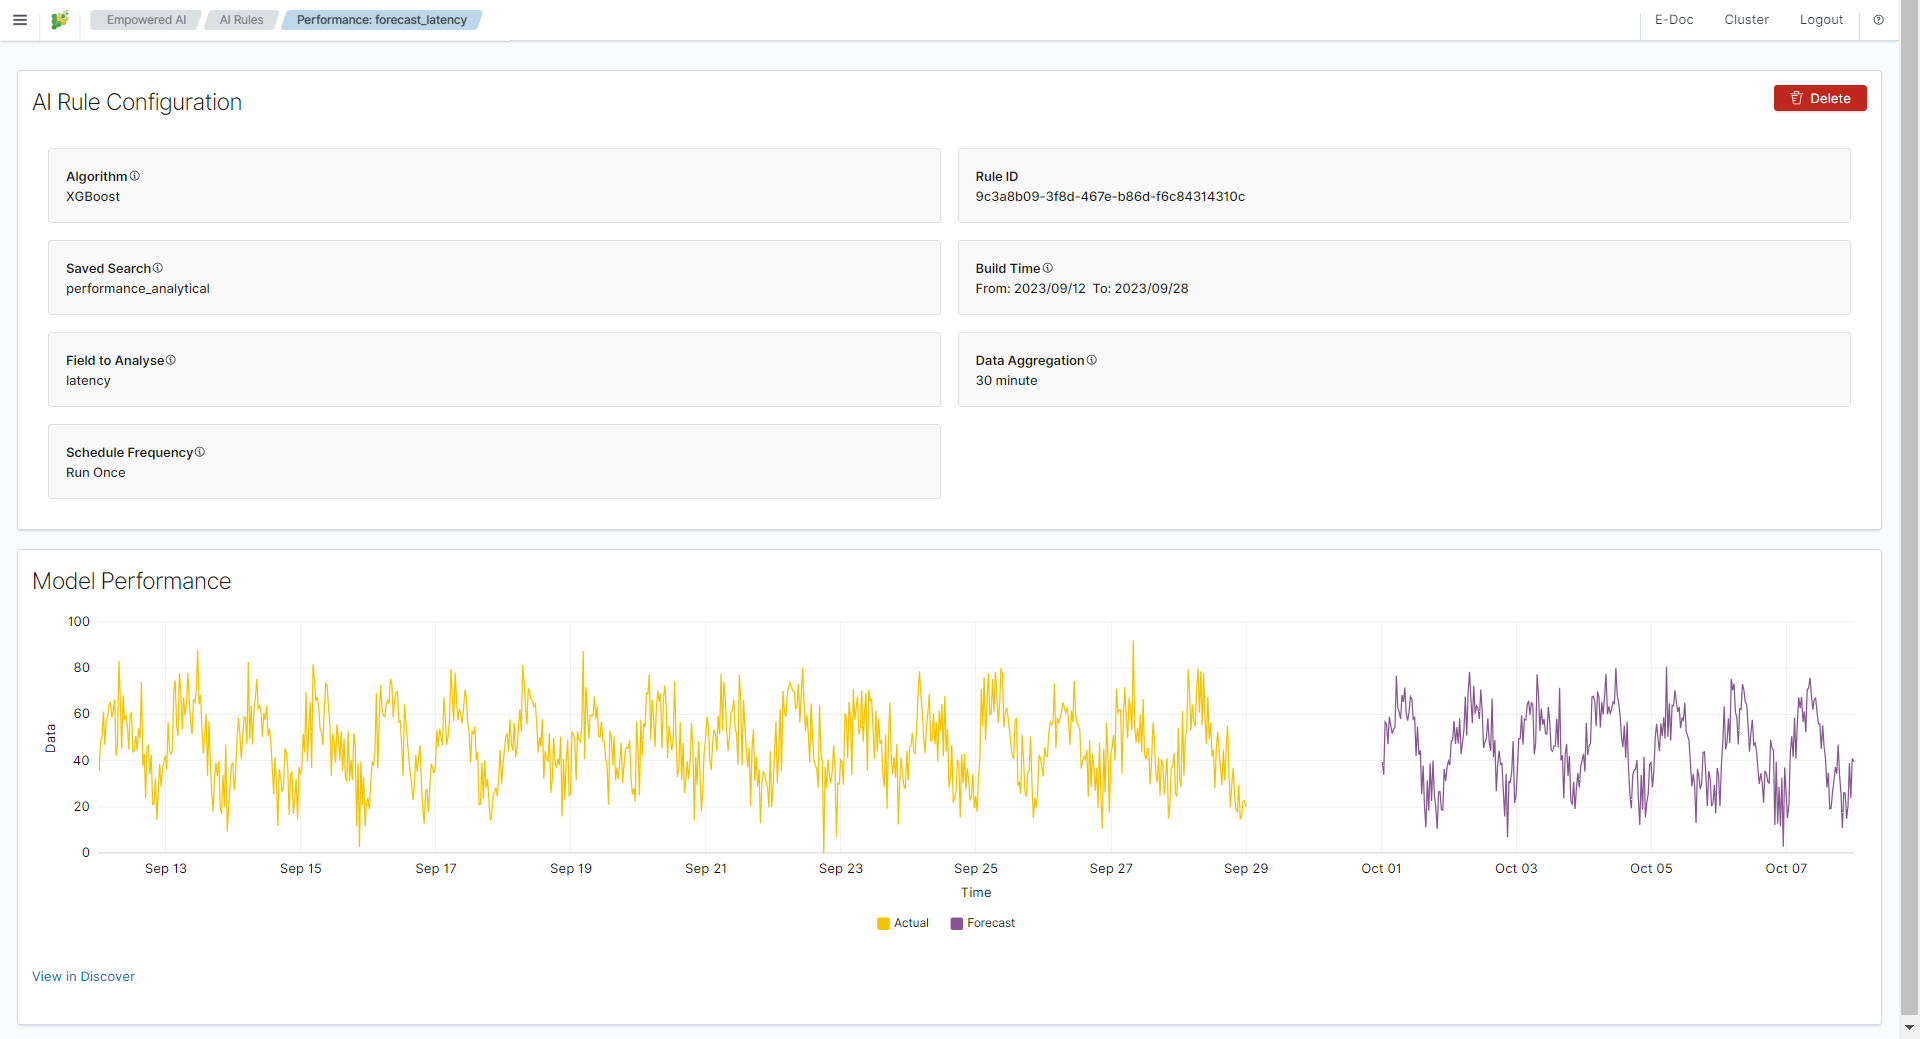
In AI Rule Configuration you will find detailed configuration parameters and information about the training data set. Exception details will also appear here in case of misconfiguration. Model Performance is the presentation of data and analysis results. Depending on the use case, these are charts, relationship visualizations, and tables.
Forecasting
Predicting future conditions is a crucial aspect of decision-making in any organization. To anticipate upcoming events, historical data analysis is indispensable. Energy Logserver Empowered AI Module suggests utilizing the XGBoost algorithm, also known as eXtreme Gradient Boosting, for forecasting your environmental variables in the near future.
XGBoost is an advanced machine learning algorithm that excels at handling datasets with multiple variables. This algorithm can accurately model complex relationships within data, enabling precise predictions of future events. XGBoost is a popular choice in the field of Data Science, particularly for solving regression and classification problems, thanks to its efficiency and effectiveness.
Create a rule
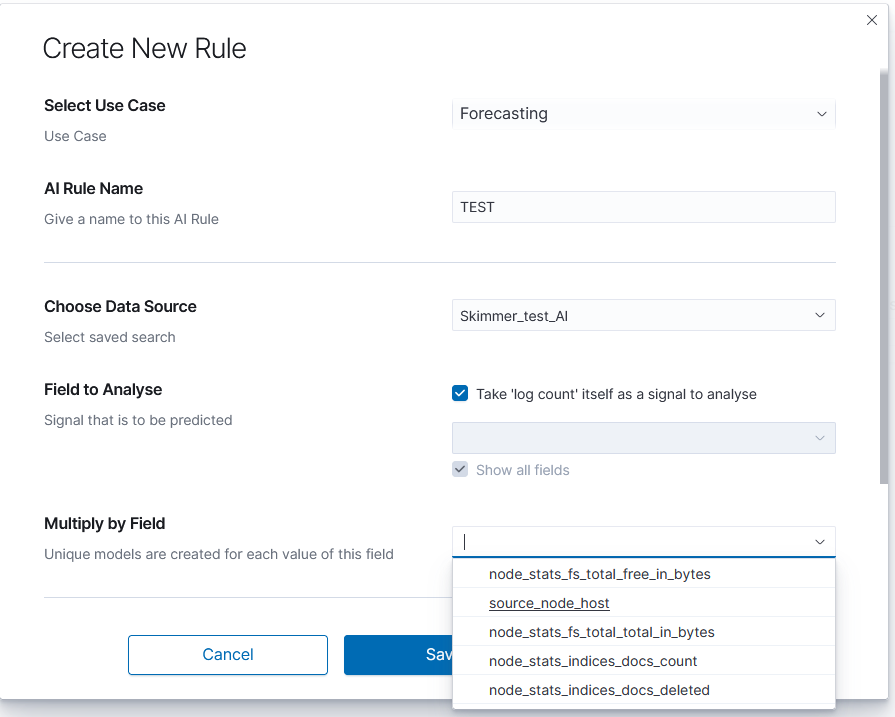
To create a rule choose Empowered AI>AI Rules>Create New Rule. In pop-up form Select Use Case>Forecasting and insert the rule’s name.
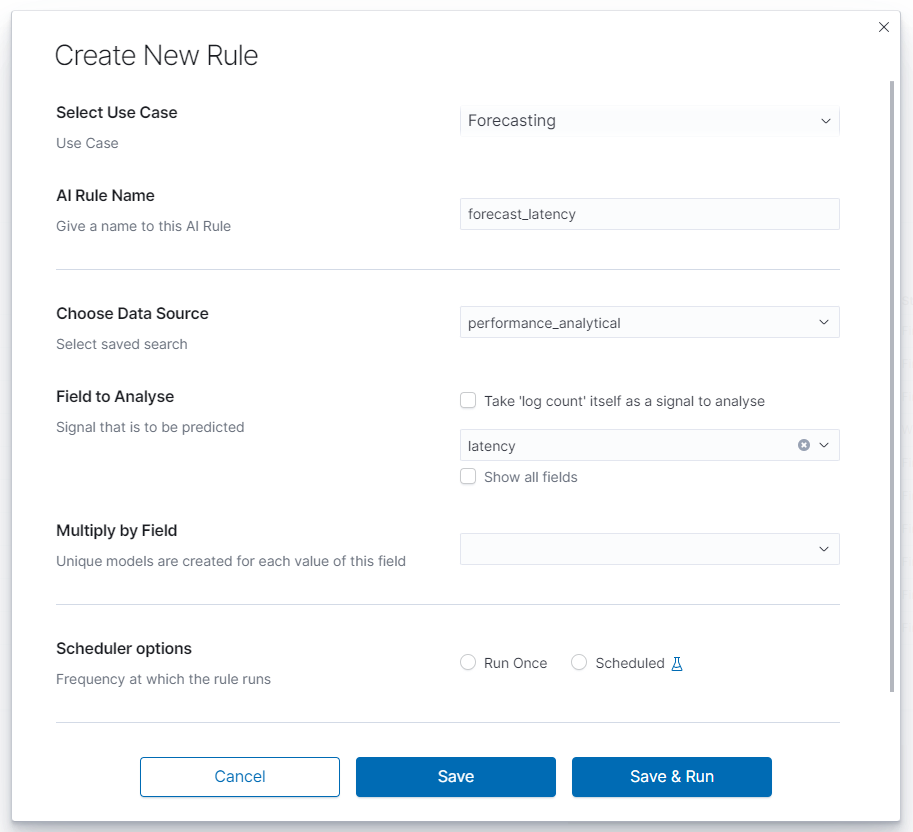
Choose data
Choose Data Source is a drop-down list with your saved data, choose one of them. After loading the source, we can select Field to Analyse - the id-field to be predicted. The system default loads headers of the appropriate data type for the specified use case. You can also choose the checkbox displaying all the fields. The proper mapping is necessary for appropriate header recognition. As numerical data, you can also use the number of documents instead of field values. To do that, choose the checkbox. Multiply by Field allows you to obtain separate forecasts e.g., for several (or all) hosts, users and domains, in one rule.
Scheduler options
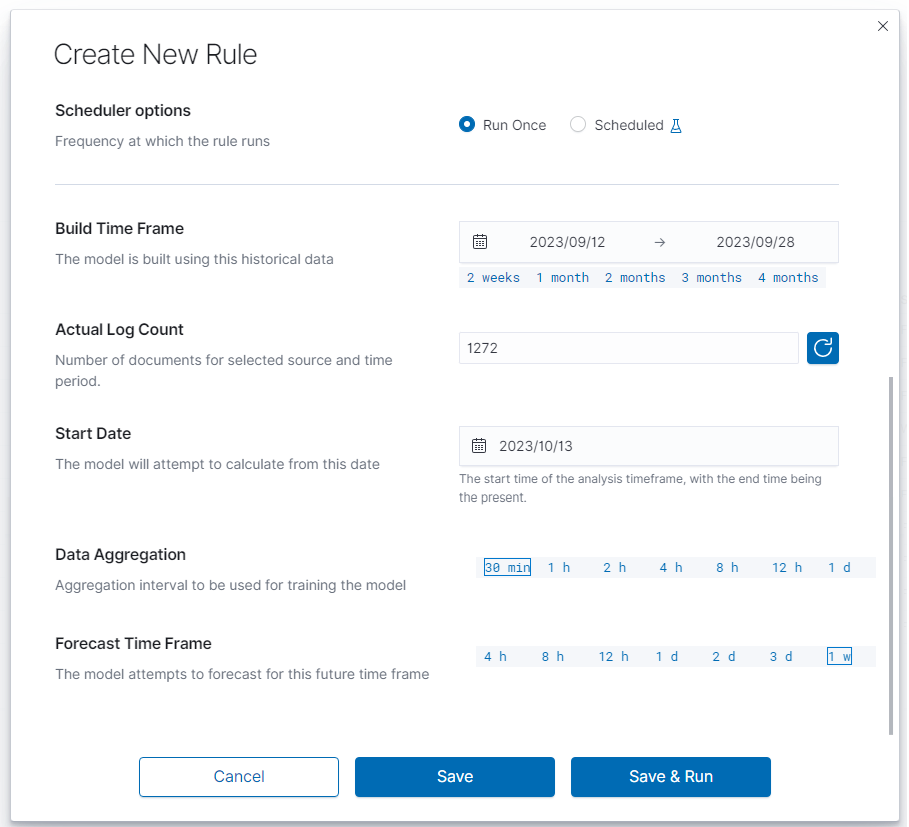
In this field, you can choose the frequency at which the rule runs Run Once or Scheduled.
Run Once
Range of dates you choose from the interactive calendars, click on icons.
Build Time Frame is a piece of data used to create and train the model. More training data allows the algorithm to obtain more accurate signal patterns and trend information. If there is too little and incomplete data, the forecast may not be accurate.
Start Date is the starting point of predictions.
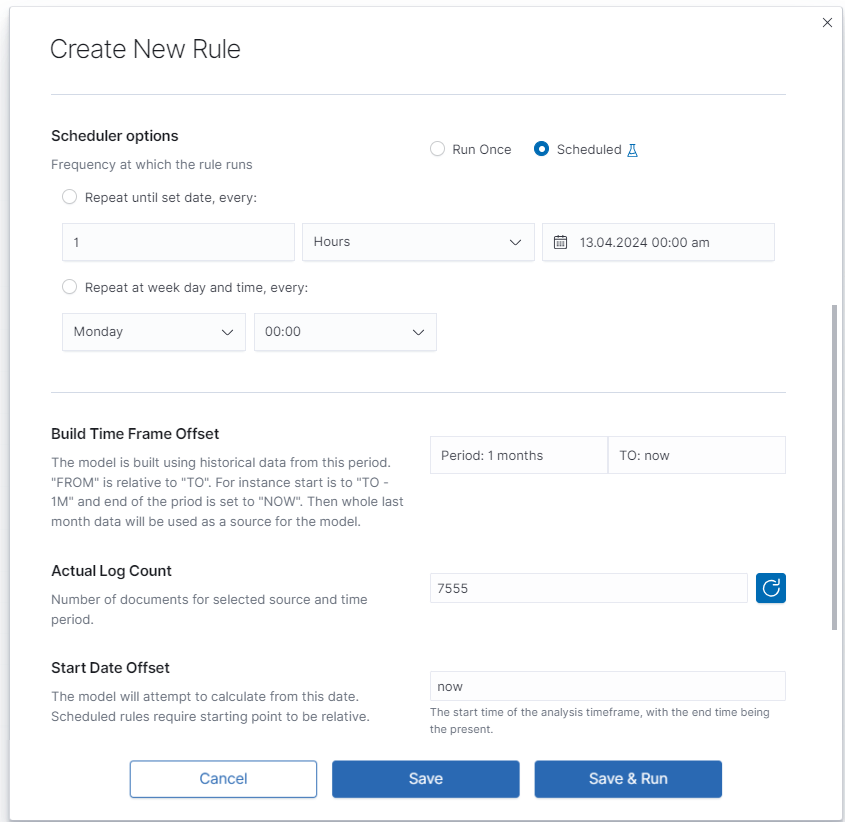
Scheduled
Scheduled rules require dates to be a relative distance from now. You choose number and time unit: minutes, hours, days, weeks, months. Build Time Frame Offset is historical data used to build the model. Period: time selection is time distance before end point TO: now - time selection of the data set. `Start Date Offset is the starting point of forecast. It must be set inside the build time frame offset.
Data Aggregation and Forecast Time Frame
The data set is divided into small intervals specified in the Data Aggregation> 30 min | 1 h | 2 h | 4 h | 8 h | 12 h | 1 d parameter. The algorithm uses this unit as the training and reporting frequency. Forecast Time Frame> 4 h | 8 h | 12 h | 1 d | 2 d | 3 d | 1 w is the period of the requested forecast. A shorter time gives a better estimation. Value of forecast time frame must be a multiplicity of time data aggregation.
Launch
You can find the newly created rule in the table with the Waiting to start status. Click Play and wait for a moment. Refresh the rules list. If it has the status Finished, click on the rule’s name to see the results.
Results
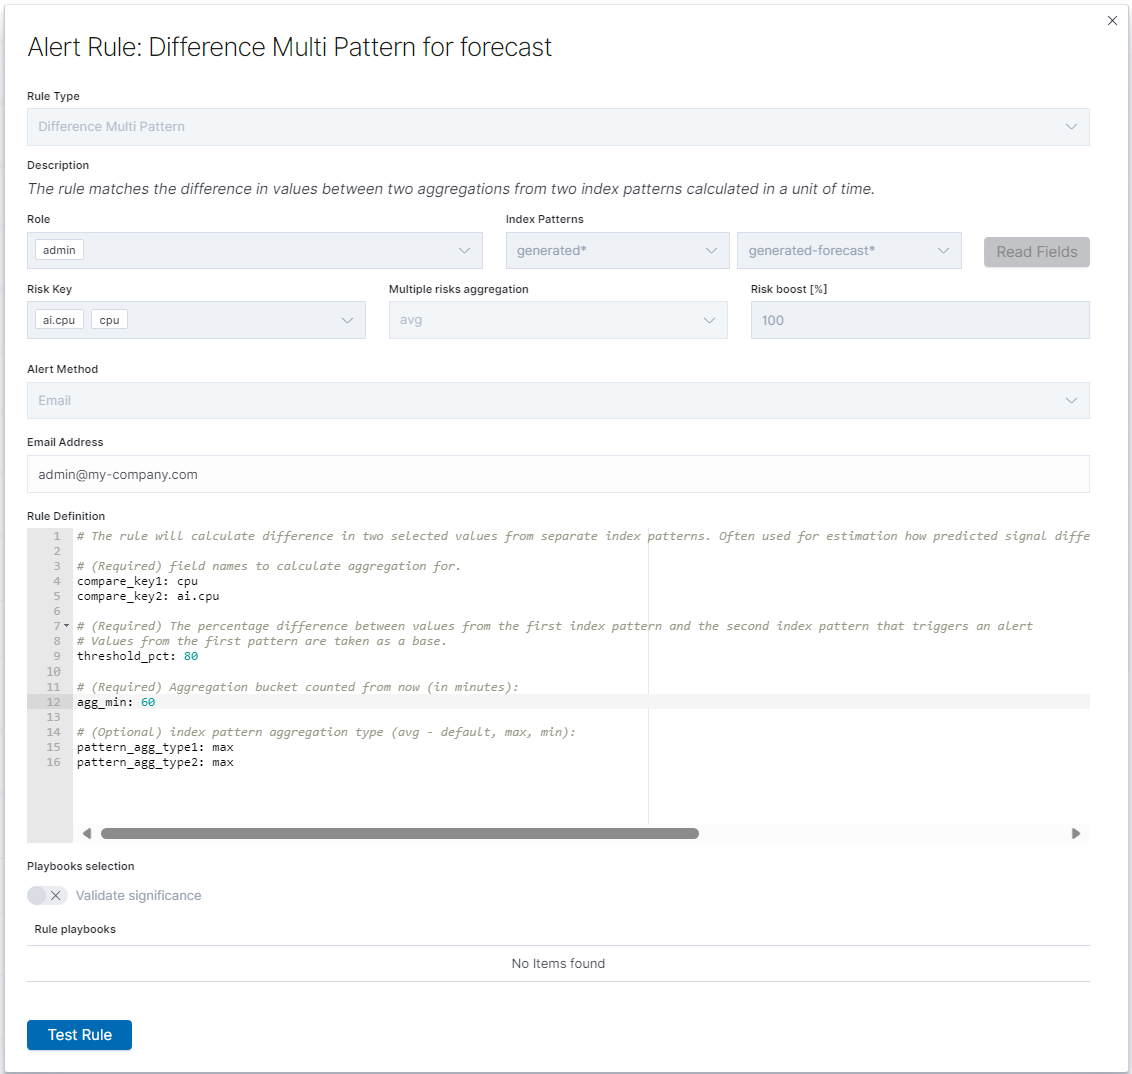
Difference Multi Pattern - alert rule
Users of SIEM Plan can leverage Empowered AI in alert rules. For forecasting, a special rule called Multi Pattern Difference has been created. In the form Create Alert Rule, we compare two patterns, index_name-* and index_name-forecast-*, along with the fields used in the forecast, field_name and ai.field_name. It’s crucial to note that the agg_min value should not be lower than the aggregation window used in the forecast; it must be a multiple thereof.
Fill in the remaining fields following the convention used for other alert rules.
Default AI Forecasting Rules
In today’s rapidly evolving world of technology, the ability to predict and respond to potential IT threats and challenges is crucial for maintaining operational continuity and system security. Our new functionality, Default Forecasting Rules within the Empowered AI module, has been designed to meet these challenges by offering advanced analysis and forecasting capabilities in the context of syslog data.
The goal of our functionality is simple yet ambitious: to automatically deploy a set of default forecasting rules for the syslog index right after the system starts up. This enables users to immediately make use of advanced analytical tools that help in identifying and responding to data anomalies, potential security threats, and other significant patterns that may impact the system and organizational operations.
By using Default Forecasting Rules, users can:
- Quickly start analyzing data: Default rules eliminate the need for manual system configuration, allowing users to focus on the analysis and interpretation of data.
- Increase the effectiveness of threat detection: Applying advanced AI algorithms and machine learning in forecasting allows for faster and more precise identification of potential threats.
- Improve operational efficiency: Automating the forecasting process saves time and resources while increasing overall operational efficiency.
Our functionality is designed with ease of use and accessibility in mind, ensuring that organizations of any size or industry can leverage the power of predictive analytics to optimize their IT operations.
Step-by-Step Guide: How to Use Default Forecasting Rules in the Empowered AI Module
This guide shows how to quickly and easily start using default forecasting rules in our Empowered AI module. By following these simple steps, you will be able to effectively utilize the power of AI for data analysis and forecasting.
Prerequisites
Ensure you are logged into the application and have the appropriate permissions to use the Empowered AI module.
Step 1: Go to the Empowered AI Module in the Application
Find and open the Empowered AI module in the application. You can do this by selecting the appropriate option in the main menu.
 GoToEmpoweredAIModule
Step 2: Select One of the Default Forecasting Rules
Upon entering the Empowered AI module, you will see a list of available forecasting rules. Select the one that best fits your needs by clicking on it.
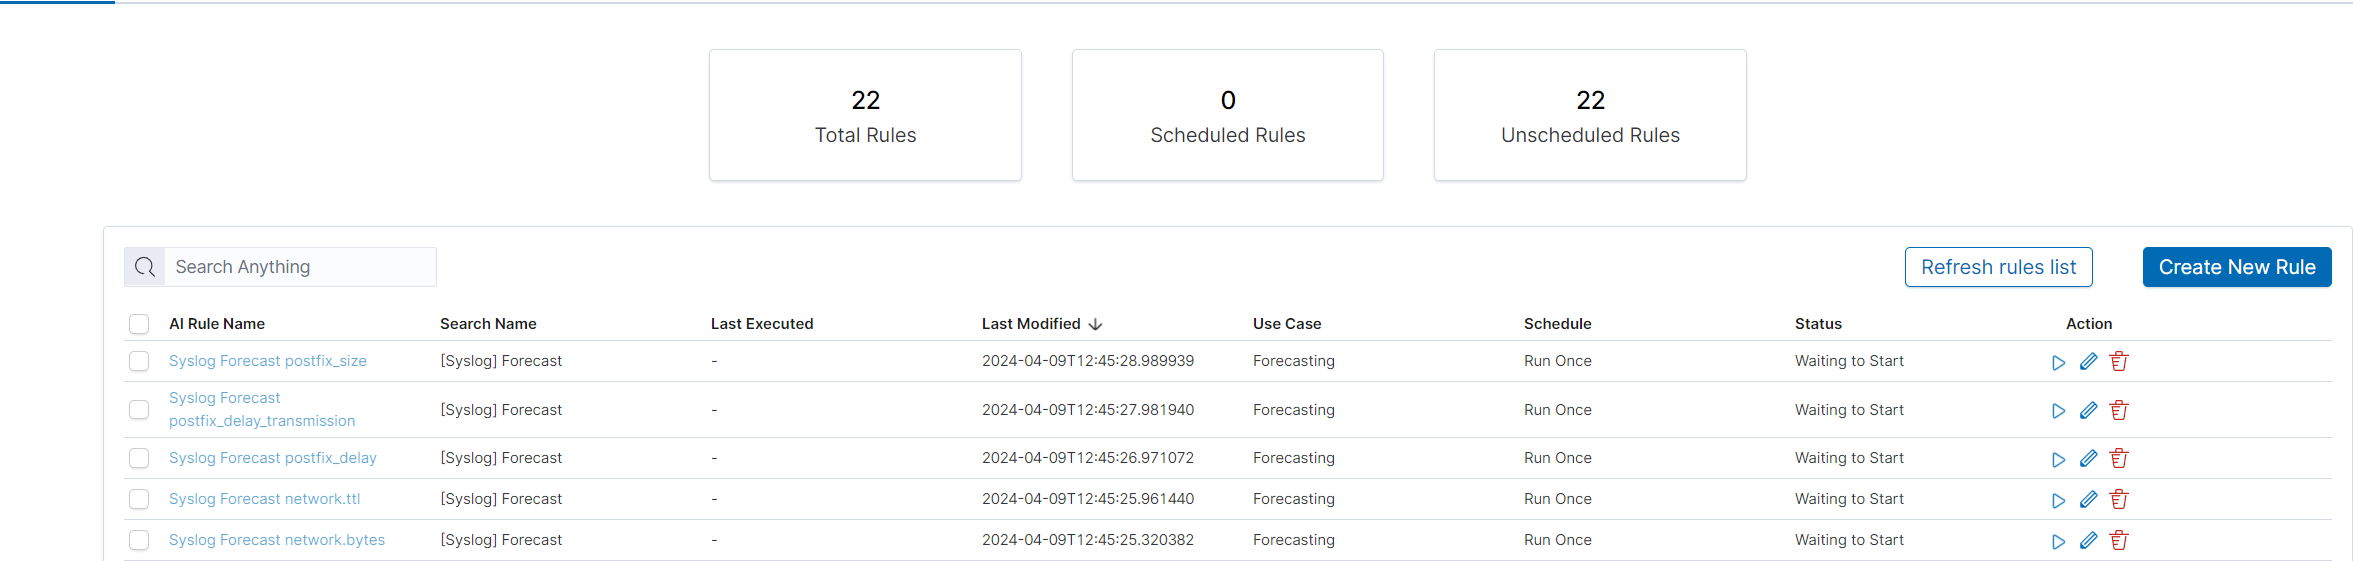 SelectForecastingRule
Step 3: Run Forecasting Rule
With the selected rule, click the “run” button to start the data analysis process. This may take some time, depending on the amount of data to be processed.
 LaunchForecasting
Step 4: Check the Results
After forecasting is complete, the results will be displayed in the module. Review them to understand potential patterns and dependencies in the data.
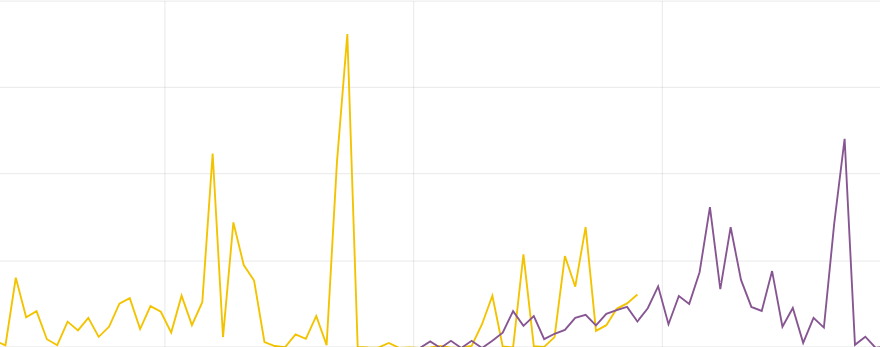 CheckForecastingResults
FAQ
Q: How often can I run forecasting?A: Forecasting can be run as often as needed. However, keep in mind that each forecasting run is a computational process and may take some time.
Q: Can I modify the default forecasting rules?A: Yes, default rules can be modified.
Troubleshooting
- Problem: Forecasting is not launching.Solution: Ensure you have the appropriate permissions and that all required data is correctly loaded into the system.
- Problem: Forecasting results seem to be inaccurate.Solution: Check if the selected forecasting rule is suitable for the type and character of your data. Consider modifying the rule for better alignment.
Archive
The Archive module allows you to create compressed data files (zstd) from Elasticsearch indices. The archive checks the age of each document in the index and if it is older than defined in the job, it is copied to the archive file.
Configuration
Enabling module
To configure the module edit the kibana.yml configuration file end set path to the archive directory - location where the archive files will be stored:
vim /etc/kibana/kibana.yml
remove the comment from the following line and set the correct path to the archive directory:
archive.archivefolderpath: '/var/lib/elastic_archive_test'
Archives will be saved inside above directory in the subdirectories that describes year and month of its creation. For example:
/var/lib/elastic_archive_test
├── 2022
│   └── 08
│       ├── enc3_2022-08-15.json.zstd
│       └── skimmer-2022.08_2022-08-06.json.zstd
└── 2023
    ├── 05
    │   ├── enc1_2023-05-25.json.zstd
    │   ├── enc2_2023-05-25.json.zstd
    │   └── skimmer-2023.05_2023-05-25.json.zstd
    └── 07
        └── skimmer-2023.07_2023-07-30.json.zstd
Archive Task
Create Archive task
From the main navigation go to the “Archive” module.
On the “Archive” tab select “Create Task” and define the following parameters:
Index pattern- for the indices that will be archived, for example,syslog*Timestamp Field- time field of the indices (default @timestamp)Older than (days)- number of days after which documents will be archivedField names filter- filter fields that should be archivedEncrypt archives- after enabling encryption, prompt with two password fields will be shown.Schedule task(crontab format) - the work schedule of the ordered task.
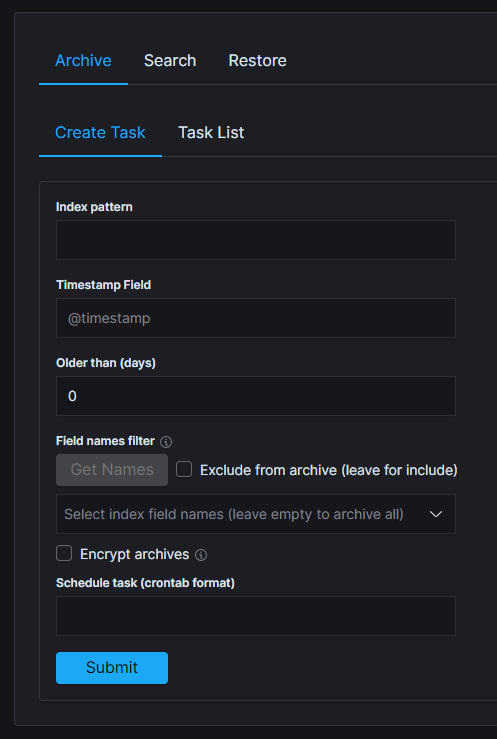
Task List
In the Task List, you can follow the current status of ordered tasks. You can modify the task scheduler or delete a single or many tasks at once.
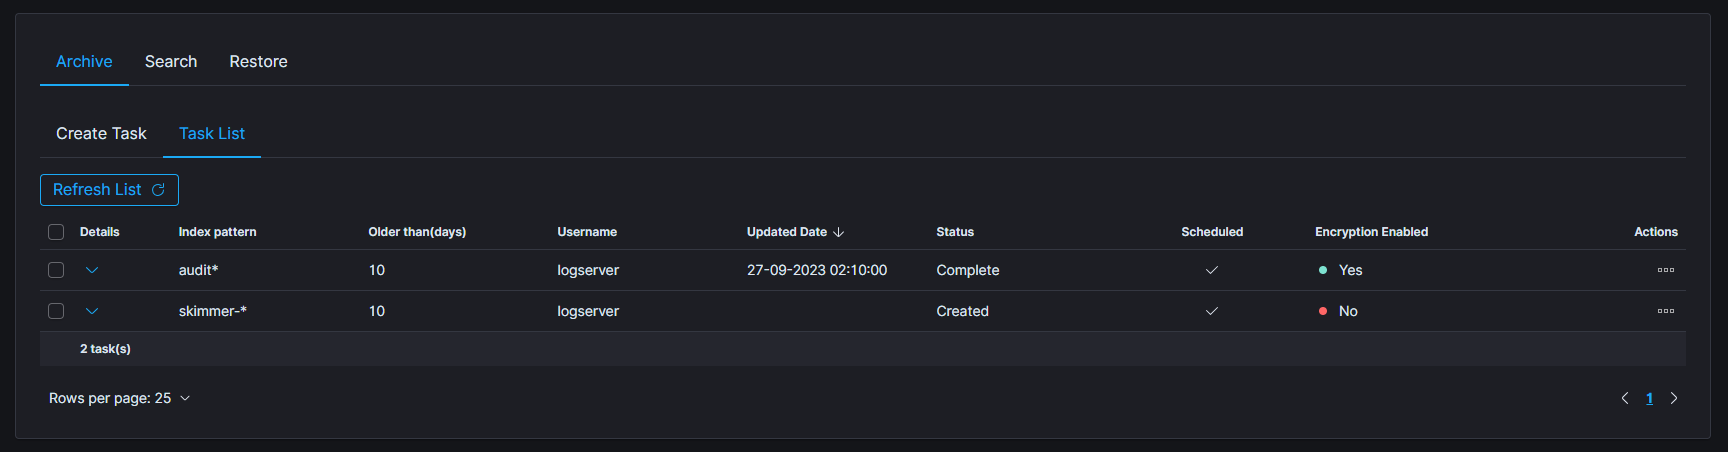
If the archiving task finds an existing archive file that matches the data being archived, it will check the number of documents in the archive and the number of documents in the index. If there is a difference in the number of documents then new documents will be added to the archive file.
To show more details of the task, click on the details cell of the desired row.
Archive Search
The Archive Search module can search archive files for the specific content and back results in the Task List
Create Search task
- From the main navigation go to the
Archivemodule. - On the
Searchtab selectCreate Taskand define the following parameters:Select range of listed archives- files that matches selected range will be displayed in the list (default last 14 days)Search text- field for entering the text to be searchedFile name- list of archive files that will be searchedEnable searching in encrypted archives- enable option to search in encrypted archives
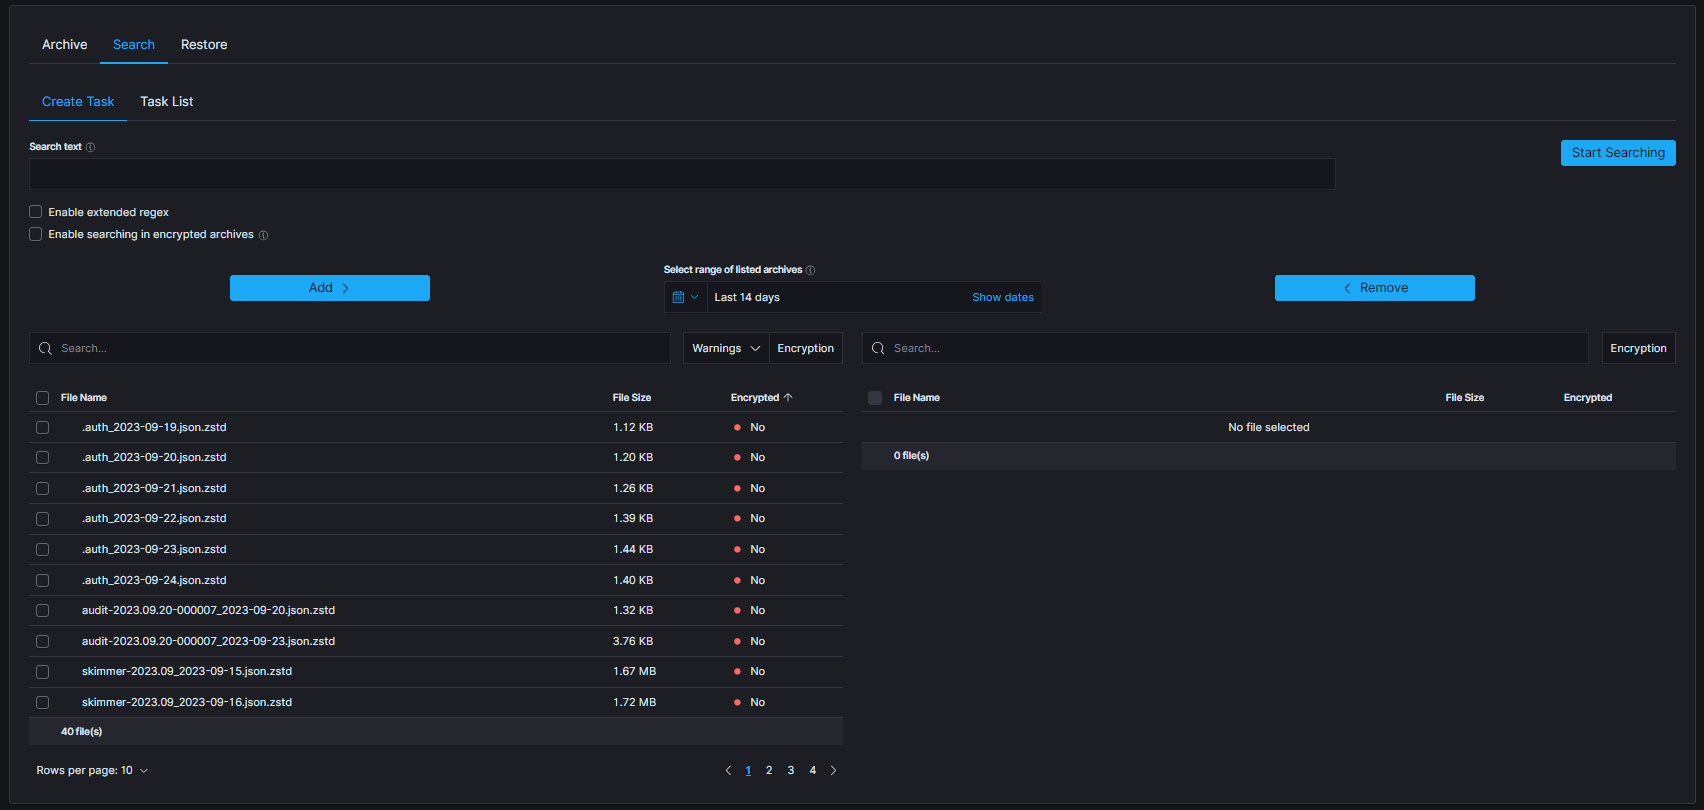
The table footer shows the total number of found files for the specified date range
Task list
The searching process can take a long time. On the Task List, you can follow the status of the searching process. Also, you can view results and delete tasks.
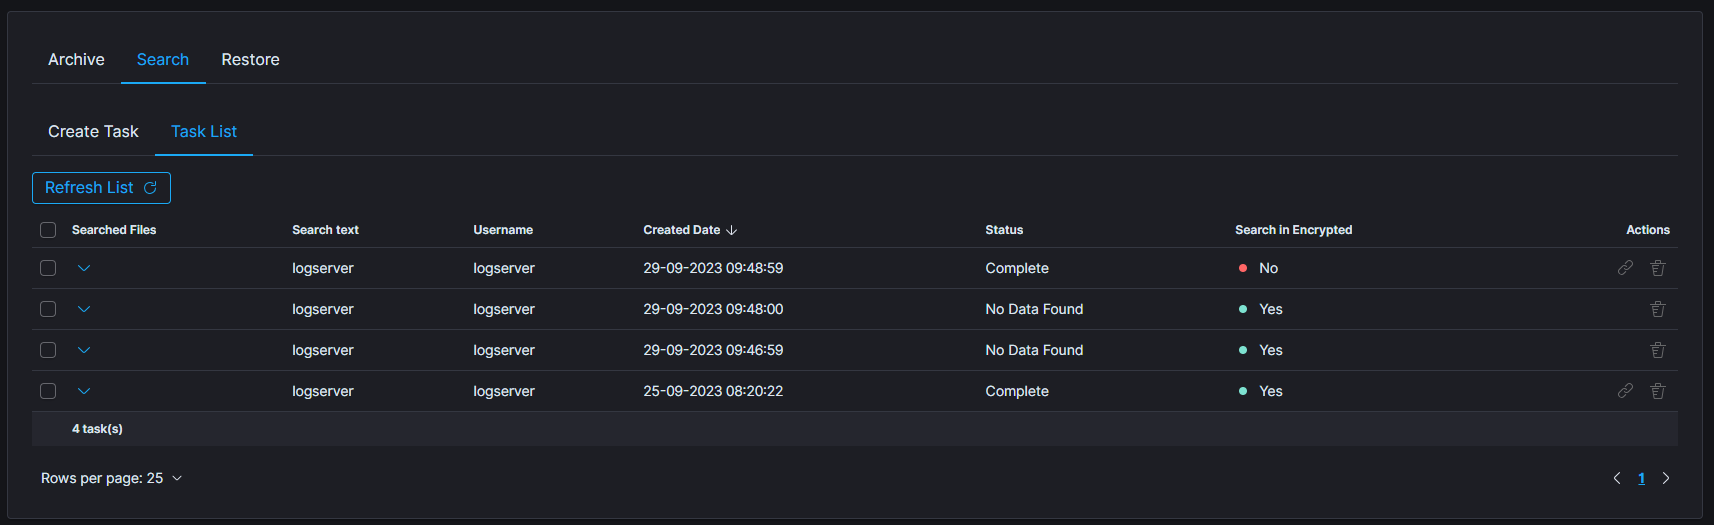
Archive Restore
The Archive Restore module moves data from the archive to the Elasticsearch index and make it online.
Create Restore task
- From the main navigation go to the
Archivemodule. - On the
Restoretab selectCreate Taskand define the following parameters:
Select range of listed archives- files that matches selected range will be displayed in the list (default last 14 days)Destination index- If a destination index does not exist it will be created. If exists data will be appendedFile name- list of archive files that will be recovered to Elasticsearch indexEnable restoring from encrypted archives- enable option to restore data from encrypted archives
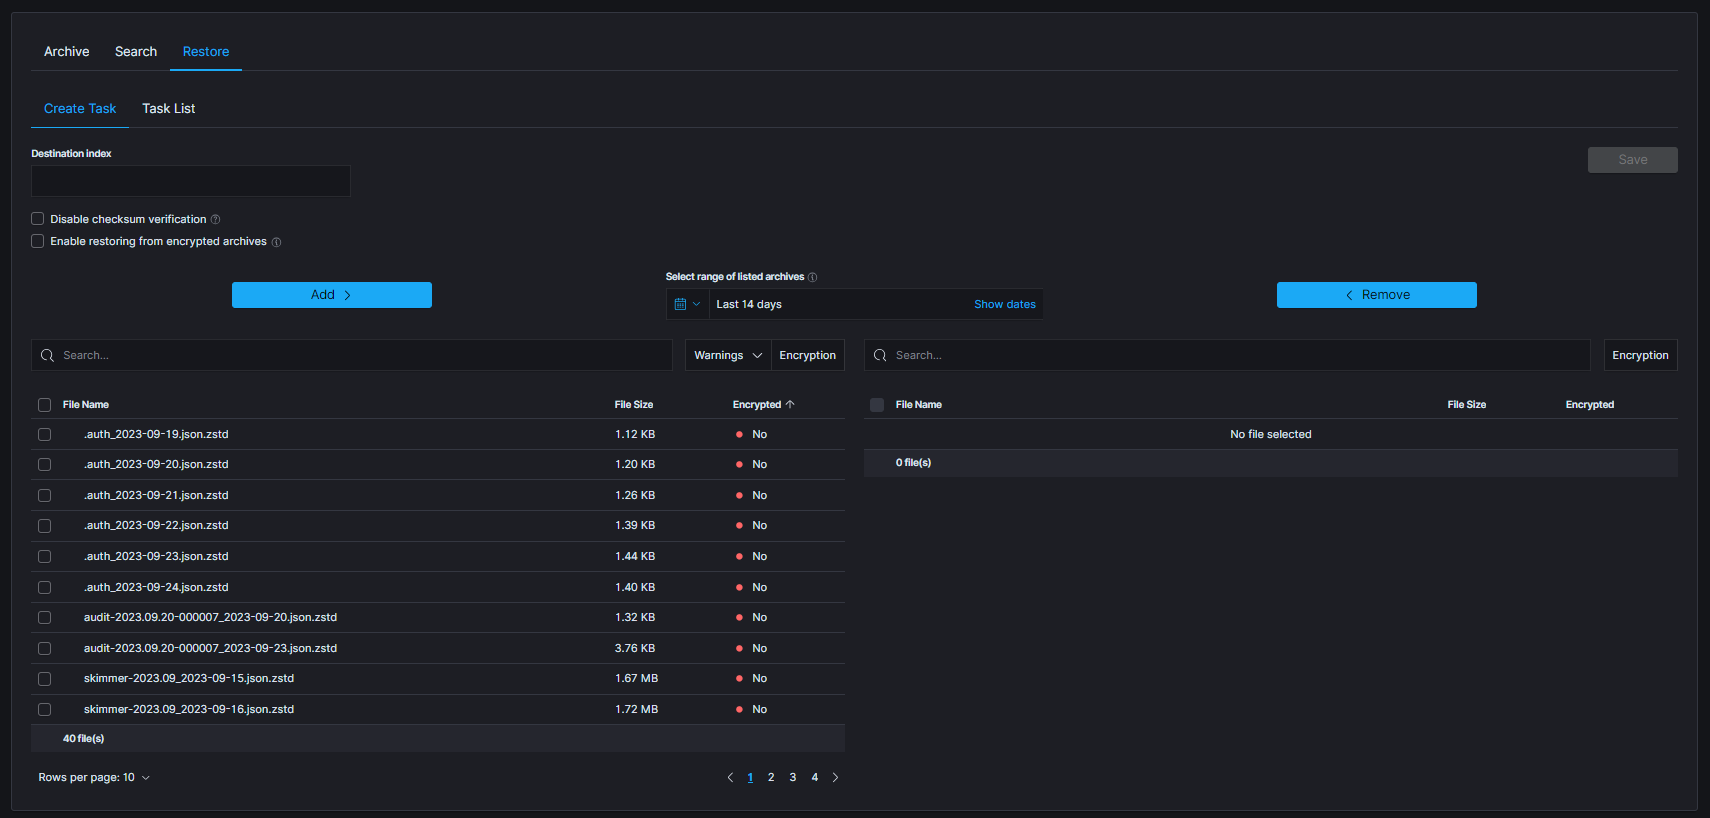
The table footer shows the total number of found files for the specified date range.
Task List
The process will index data back into Elasticsearch. Depend on archive size the process can take long time. On the Task List you can follow the status of the recovery process. Also you can view result and delete tasks.
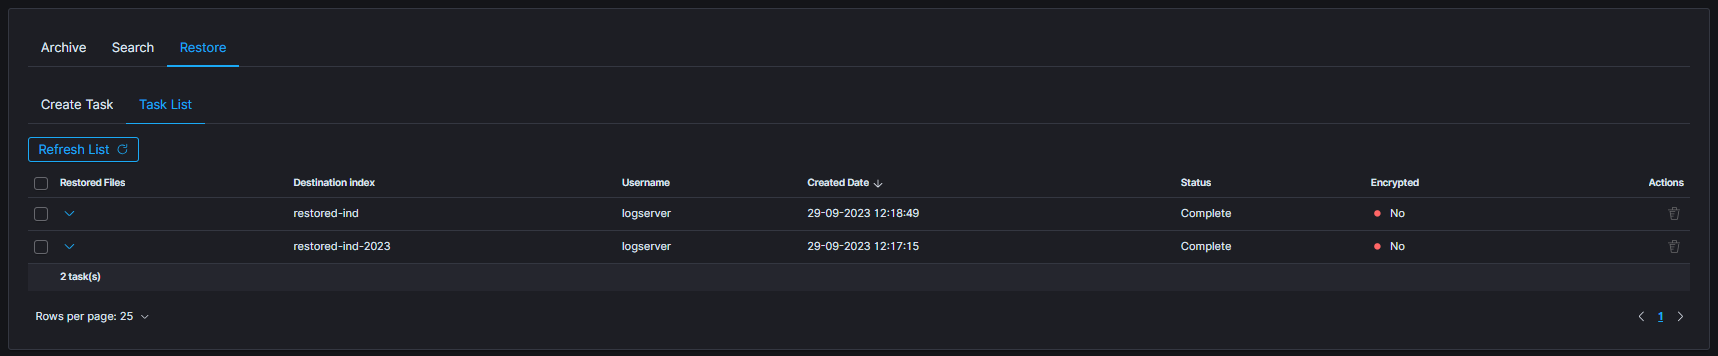
Search/Restore task with archives without metadata
When creating Search or Restore tasks, during selection of archives to use, some warnings could be seen. Following screenshot presents list of archives with enabled filter that shows only archives with warnings:
missing metadatamissing archive file
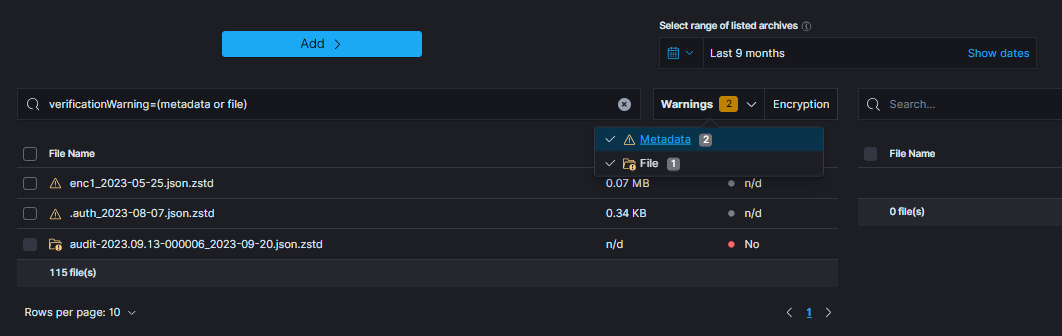
When particular archive’s metadata could not be found following icon will be displayed:
![]()
That archive can be used for task creation, but there are some issues to keep in mind:
- encryption status of the archive without metadata cannot be established (can be either encrypted or not)
- when task has enabled encryption handling (e.g.
Enable restoring from encrypted archivesorEnable searching in encrypted archives), archives will be decrypted with provided password. If archive was not decrypted, an error is expected - when archive is potentially encrypted and password is not provided, an error is expected.
On the other hand, when metadata is present, but archive itself could not be located, following icon will be displayed: ![]()
That archive cannot be used for task creation and so cannot be selected.
Archive Directory Structure
New archives will be created in the configured archive.archivefolderpath (kibana.yml) in a systematic order. They can be found under a path based on the date the archive was created: /$archivefolderpath/$year/$month. This method of storing archives ensures better readability and significantly simplifies viewing large numbers of files. The final directory is determined by the last segment of the archive name, which contains the archive creation date. For example, assuming that the root archivefolderpath is set to /download, archive sample-archive_2023-11-01.json.zstd will be saved to the /download/2023/11/ automatically created directory. Archives once saved to the root directory will be displayed normally in the GUI and will be accessible in the same way as those saved in a sorted manner.
Archives Checksum Verification
Archives checksum verification feature has been integrated into the Create Task section, enhancing the functionality of both the Search and Restore tabs. This feature adds an extra layer of confidence in the accuracy and reliability of the stored files.
Starting Verification
To start the verification process navigate to one of the mentioned tabs. Select archives that will be checked and move them to the right-side table. Below picture presents the button that will be activated, as soon as any complete archives (without any warning) will be selected in the right table. Archives without metadata cannot be utilized due to the lack of necessary details.
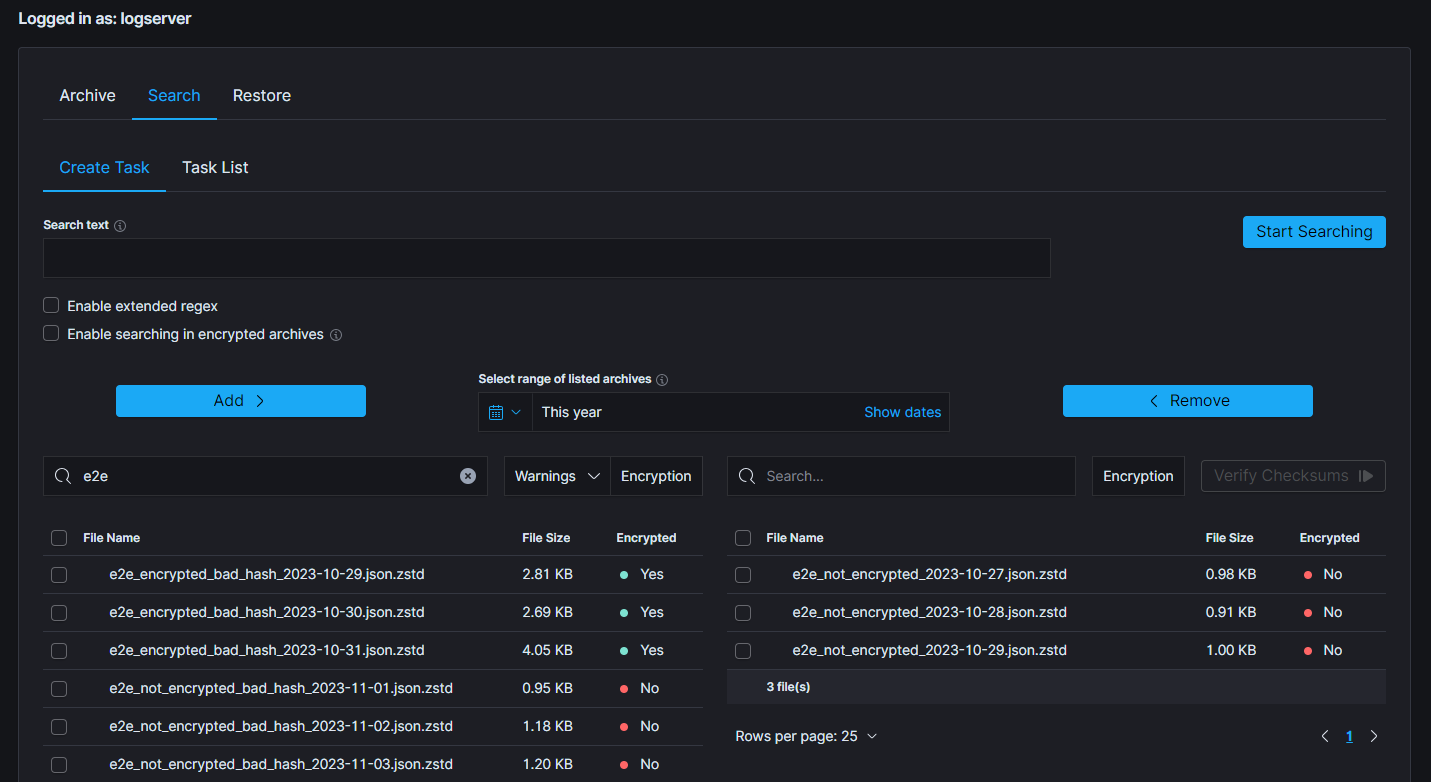
In order to optimize resource utilization and enhance the overall efficiency, a double selection mechanism has been implemented for the file checksum verification, acknowledging the resource-intensive nature of this feature. This ensures, that only desired files will be processed.
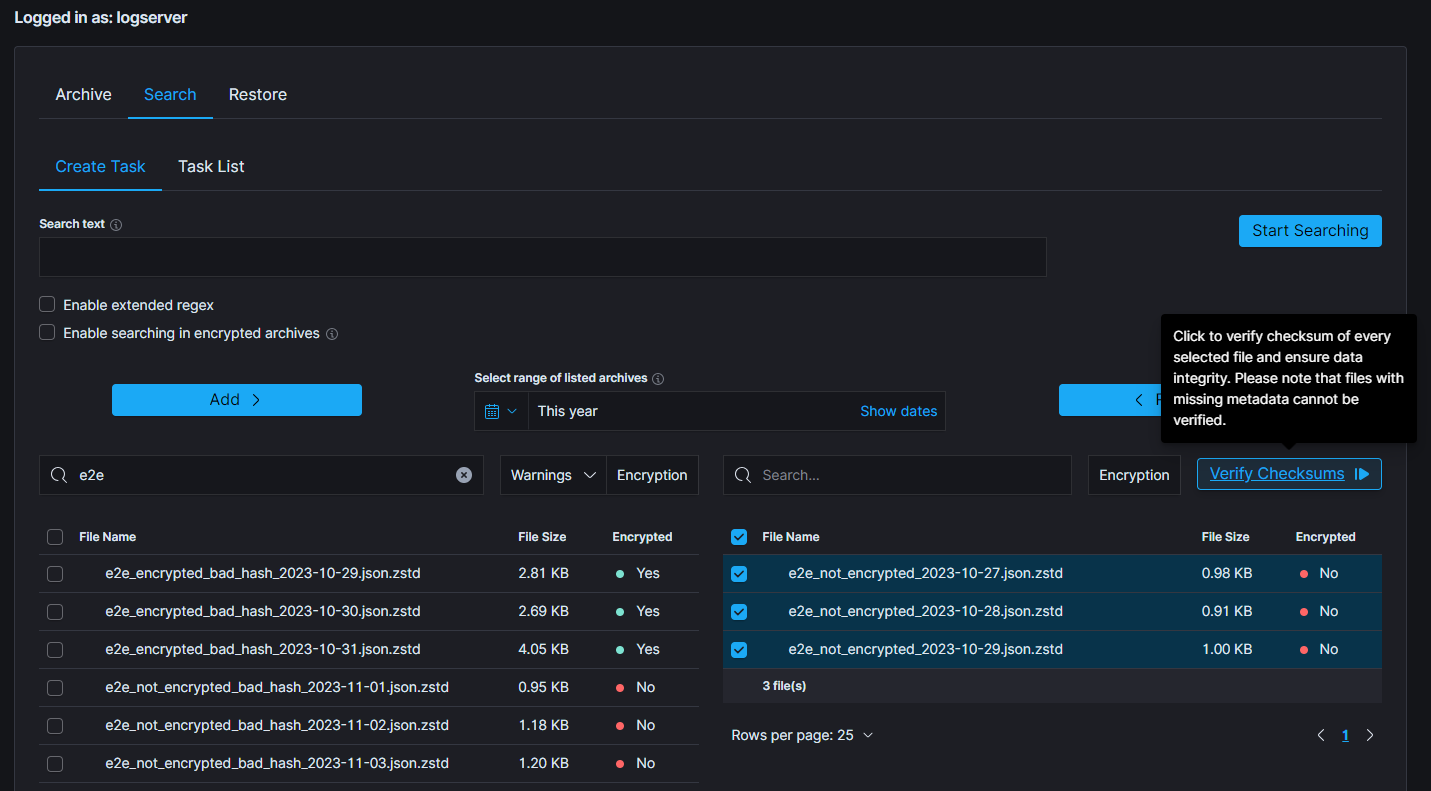
Above picture presents correctly selected archives and a situation when verification process can be started by clicking the Verify Checksums button. Following modal will be displayed.
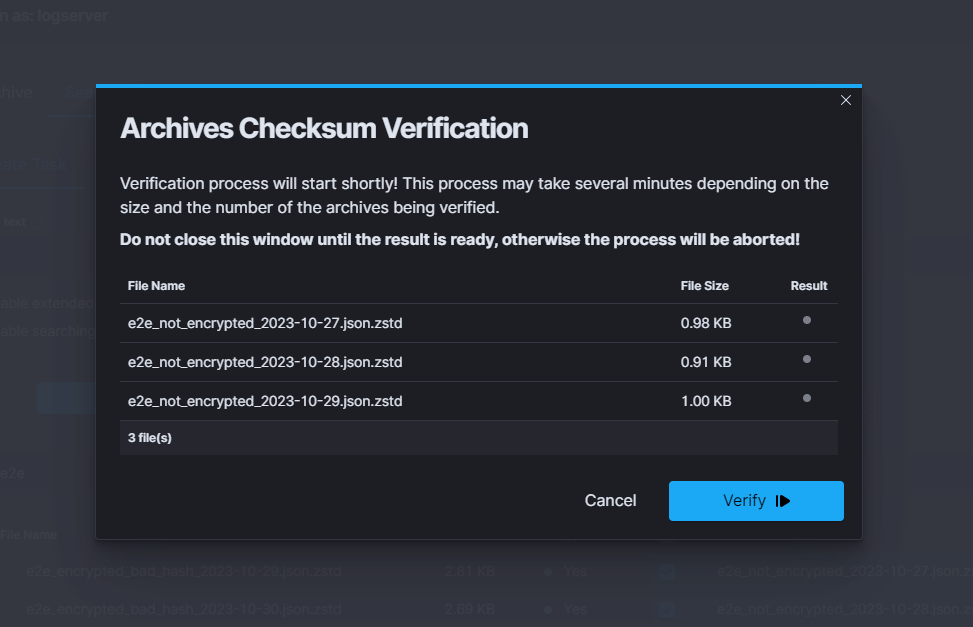
Showcased modal displays previously selected files and some of its details, such as its size and result of verification. Hovering over the result dot provide users with additional information about the result, eg. current status of the verification or possible error.
To start verification, simply click the Verify button in the bottom right corner.
After verification has been started, the loading progress bar will be displayed, indicating that the process is running. It is worth mentioning that neither this modal nor the page should be closed or reloaded as the verification process will stop immediately.
The verification can be either stopped or cancelled, by clicking one of the two buttons.
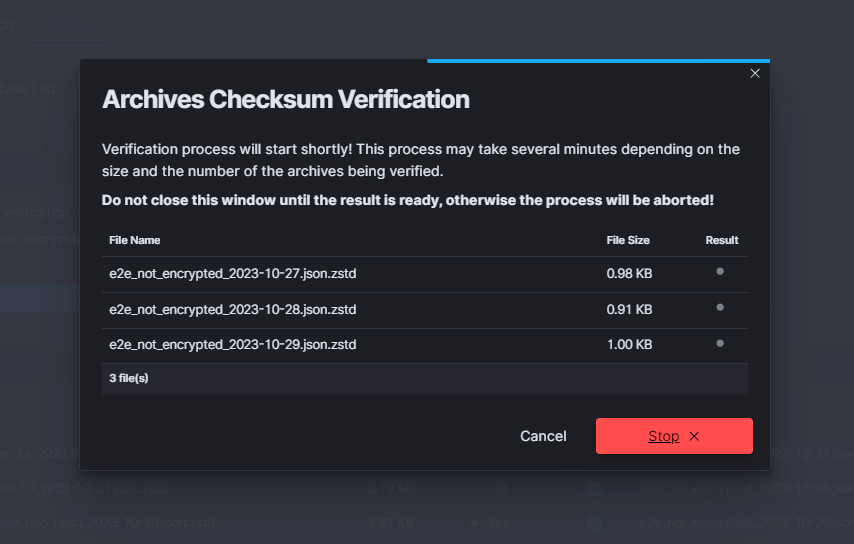
Verification Result
After some time, when the verification is concluded, the final results will be displayed. The verification result is shown in the left bottom corner and is symbolized by one of the displayed colors:
green- all of the archives have compliant checksumsyellow- indicates that some of the archives passed the verification, while others did notred- signifies that all of the selected archives failed the verification process
When all files are okay:
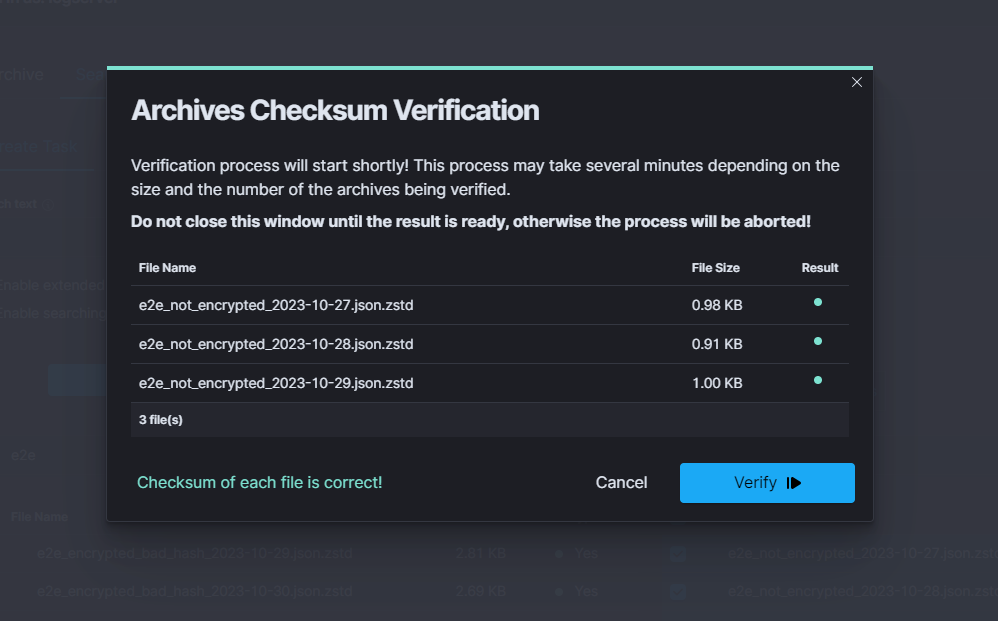
When results are partially correct:
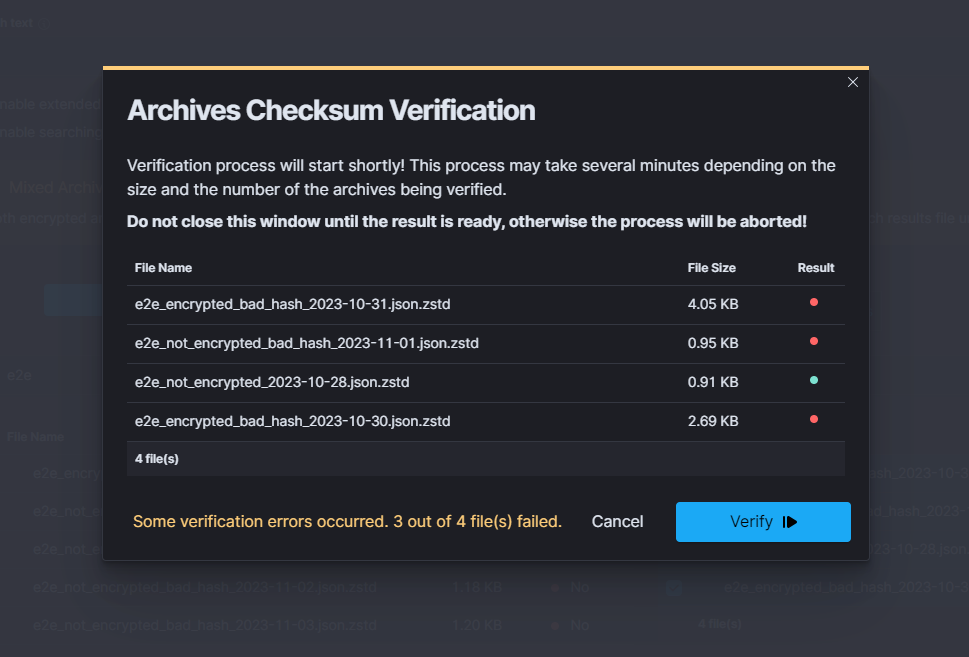
When all files are failed:
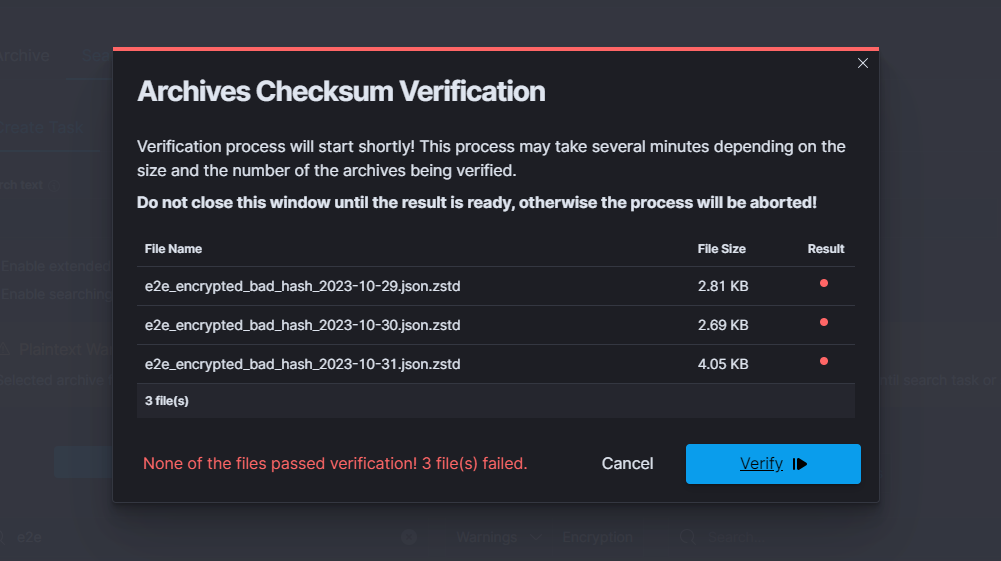
As mentioned before, there is an option to hover over the color dot that indicates the verification result of the file. Below picture shows the reason of failed verification of particular file.
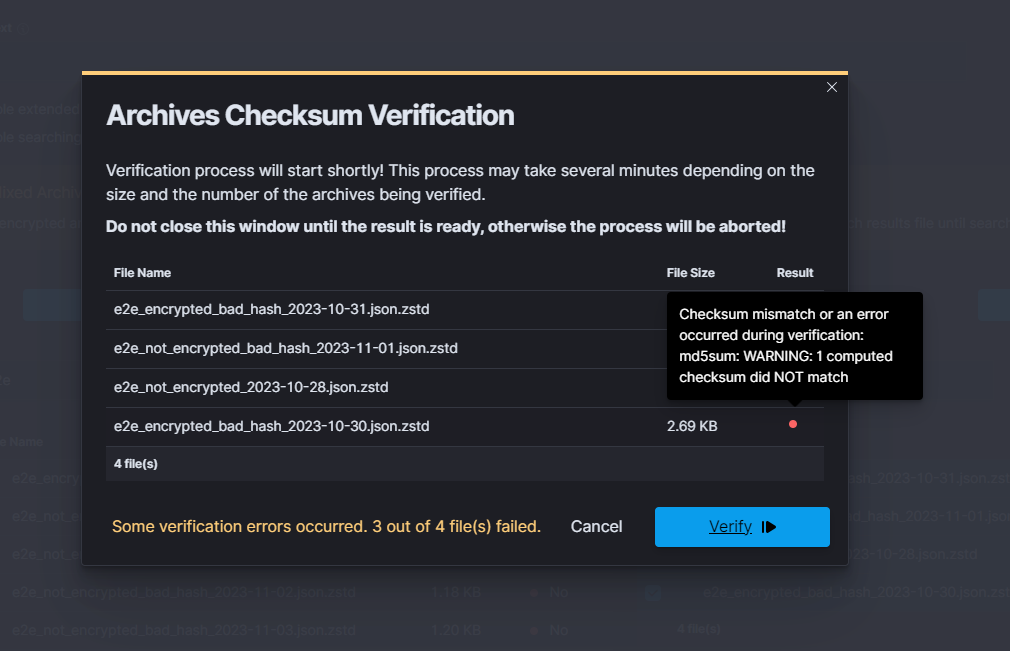
Identifying progress of archivisation/restoration process
The /usr/share/kibana/data/archive/tasks directory contains metadata files, that indicates the current status of the task. That files contains informations about all indices, that:
- are about to be processed (”Waiting” status)
- are processing (”Running” status)
- were processed (”Complete” status)
If everything went according to the plan and the process has successfully finished, that metadata file will be removed. However, when some index cannot be processed or something unexpected happened, there will be “Error” status, with detailed message in the “error” field and metadata will remain in the system.
The above described situation is reflected in the GUI by the Status column in the Task List tables.
Moreover, in the metadata files can be found current process id (pid), total documents count and encryption details.
Uncompleted Tasks removal
List archive folder and find filename generated by uncompleted task.
ls -la /archivefolderpath/
-rw-r--r--. 1 kibana kibana          13 Mar 21 10:07 prd-srv-win-ad-2022.12.
21_2022-12-21.json.zstd
Find document in
.archiveindex using filename from previous stepcurl -s -k -X GET -ulogserver:... http://127.0.0.1:9200/.archive/_search?size=10000 |jq '.'| grep -B4 "prd-srv-win-ad-2022.12.21"Write down it’s ID
"_id": "Q8teA4cBj_ghAWXFcMJA",
      "_score": 1.0,
      "_source": {
        "date": "2023-03-21T08:52:13.502Z",
        "filename": "prd-srv-win-ad-2022.12.21_2022-12-21.json.zstd",
Remove documen using saved ID
curl -s -k -X DELETE -ulogserver:... http://127.0.0.1:9200/.archive/_doc/Q8teA4cBj_ghAWXFcMJA
Command Line tools
Archive files can be handled by the following commands zstd, zstdcat, zstdgrep, zstdless, zstdmt.
zstd
The command for decompress *.zstd the Archive files, for example:
zstd -d winlogbeat-2020.10_2020-10-23.json.zstd -o
 winlogbeat-2020.10_2020-10-23.json
zstdcat
The command for concatenate *.zstd Archive files and print content on the standard output, for example:
zstdcat winlogbeat-2020.10_2020-10-23.json.zstd
zstdgrep
The command for print lines matching a pattern from *.zstd Archive files, for example:
zstdgrep "optima" winlogbeat-2020.10_2020-10-23.json.zstd
Above example is searching documents contain the “optima” phrase in winlogbeat-2020.10_2020-10-23.json.zstd archive file.
zstdless
The command for viewing Archive * .zstd files, for example:
zstdless winlogbeat-2020.10_2020-10-23.json.zstd
zstdmt
The command for compress and decompress Archive *.zdtd file useing multiple CPU core (default is 1), for example:
zstdmt -d winlogbeat-2020.10_2020-10-23.json.zstd -o winlogbeat-2020.10_2020-10-23.json
E-doc
E-doc is one of the most powerful and extensible Wiki-like software. The Energy Logserver have integration plugin with E-doc, which allows you to access E-doc directly from the Energy Logserver GUI. Additionally, Energy Logserver provides access management to the E-doc content.
Login to E-doc
Access to the E-doc is from the main Energy Logserver GUI window via the E-doc button located at the top of the window:

Creating a public site
There are several ways to create a public site:
- by clicking the New Page icon on the existing page;
- by clicking on a link of a non-existent site;
- by entering the path in the browser’s address bar to a non-existent site;
- by duplicating an existing site;
Create a site by clicking the New Page icon on an existing page
On the opened page, click the New Page button in the menu at the top of the opened website:

A new page location selection window will appear, where in the Virtual Folders panel you can select where the new page will be saved.
In the text field at the bottom of the window, the new-page string is entered by default, specifying the address of the page being created:
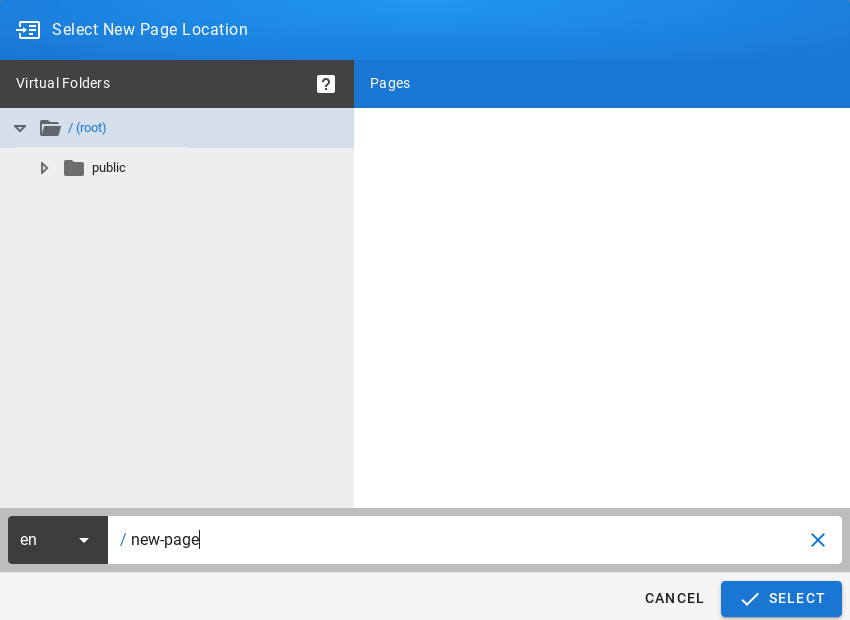
After clicking on the SELECT button at the bottom of the window, a window will appear with the option to select the editor type of the newly created site:

After selecting the site editor (in this case, the Visual Editor editor has been selected), a window with site properties will appear where you can set the site title (change the default page title), set a short site description, change the path to the site and optionally add tags to the site:

A public site should be placed in the path /public which is available for the Guest group and have the public-pages tag assigned. The public-pages tag mark sites are accessible to the “Guest” group.
After completing the site with content, save it by clicking on the Create button located in the menu at the top of the new site editor:

After the site is successfully created, the browser will open the newly created site.
Create a site by typing a nonexistent path into the browser’s address bar
In the address bar of the browser, enter the address of non-existent websites, e.g. by adding /en/public/test-page to the end of the domain name:

The browser will display the information This page does not exists yet., Below there will be a button to create a CREATE PAGE page (if you have permission to create a site at the given address):

After clicking the CREATE PAGE button, a window with site properties will appear where you can set the site title (change the default page title), set a short site description, change the path to the site and optionally add tags to the site:
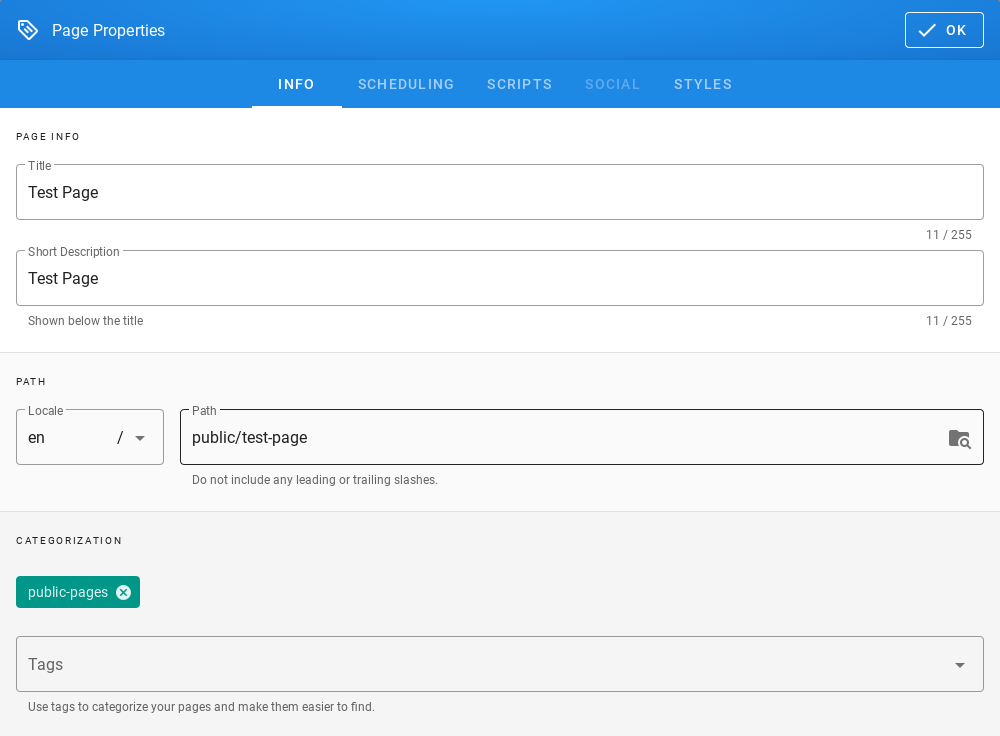
A public site should be placed in the path /public which is available for the Guest group and have the public-pages tag assigned. The public-pages tag mark sites are accessible to the Guest group.
After completing the site with content, save it by clicking on the Create button located in the menu at the top of the new site editor:
After the site is successfully created, the browser will open the newly created site.
Create a site by duplicating an existing site
On the open page, click the Page Actions button in the menu at the top of the open site:

The list of actions that can be performed on the currently open site will appear:
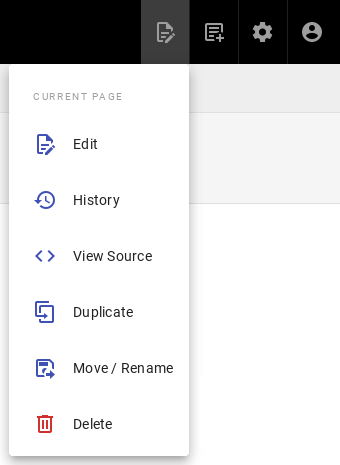
From the expanded list of actions, click on the Duplicate item, then a new page location selection window will appear, where in the Virtual Folders panel you can indicate where the new page will be saved. In the text field at the bottom of the window, the string public/new-page is entered (by default), specifying the address of the page being created:
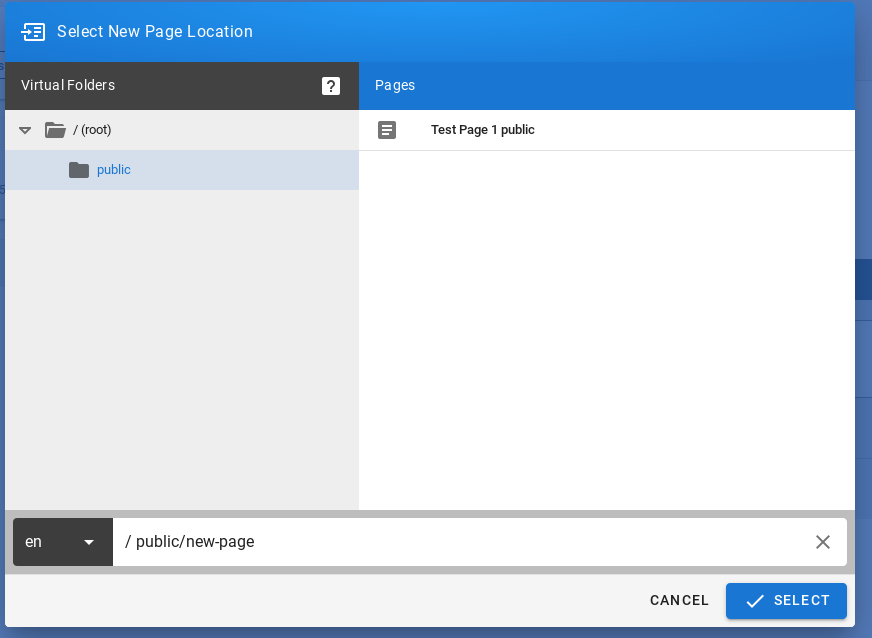
After clicking the SELECT button, a window with site properties will appear where you can set the site title (change the title of the duplicated page), set a short site description (change the description of the duplicated site), change the path to the site and optionally add tags to the site:
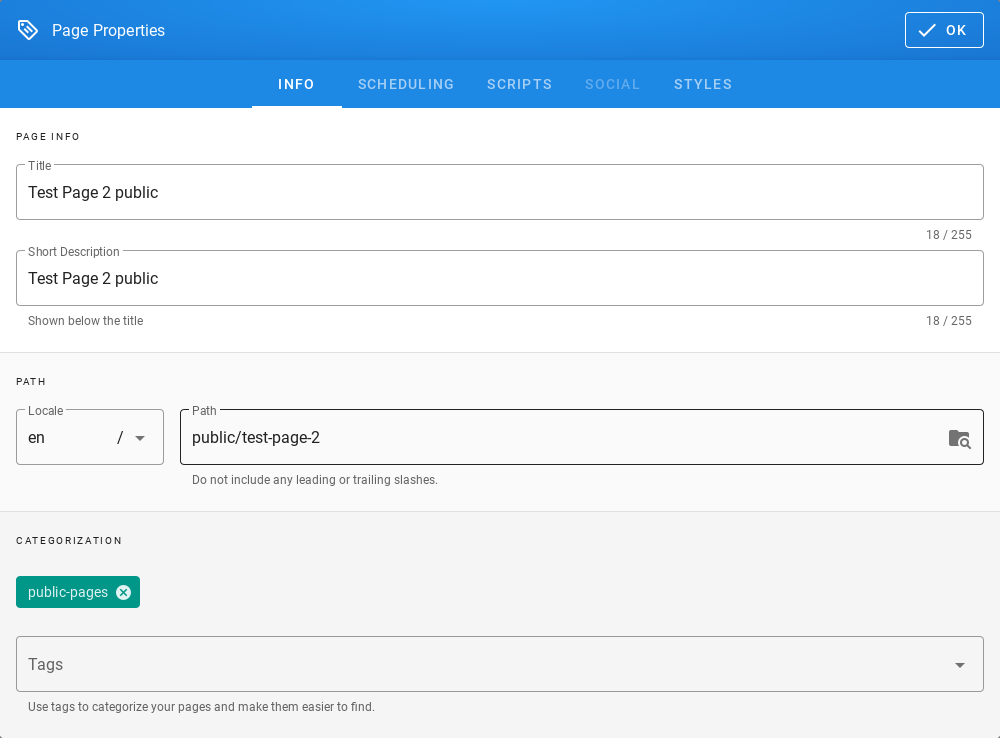
A public site should be placed in the path /public which is available for the Guest group and have the public-pages tag assigned. The public-pages tag mark sites are accessible to the Guest group.
After completing the site with content, save it by clicking on the Create button located in the menu at the top of the new site editor:
After the site is successfully created, the browser will open the newly created site.
Creating a site with the permissions of a given group
To create sites with the permissions of a given group, do the following:
Check the permissions of the group to which the user belongs. To do this, click on the Account button in the top right menu in E-doc:

After clicking on the Account button, a menu with a list of actions to be performed on your own account will be displayed:
From the expanded list of actions, click on the Profiles item, then the profile of the currently logged in user will be displayed. The Groups tile will display the groups to which the currently logged in user belongs:

Then create the site in the path, putting the name of the group to which the user belongs. In this case it will be putting your site in the path starting with /demo(preceded by an abbreviation of the language name):
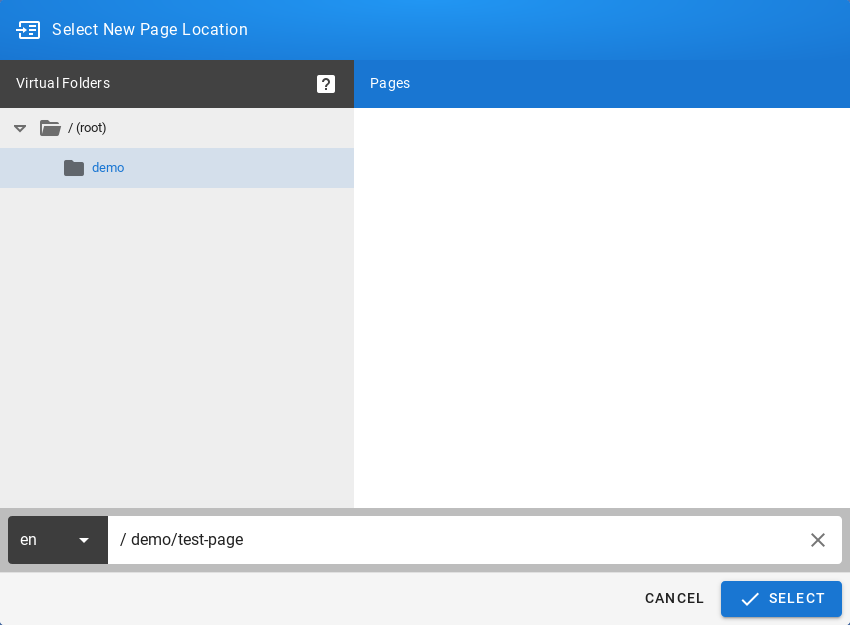
Click the SELECT button at the bottom of the window, a new window will appear with the option to select the editor type for the newly created site:

After selecting the site editor (for example Visual Editor), a window with site properties will appear where you can set the site title (change the default page title), set a short site description, change the path to the site and optionally add tags to the site:
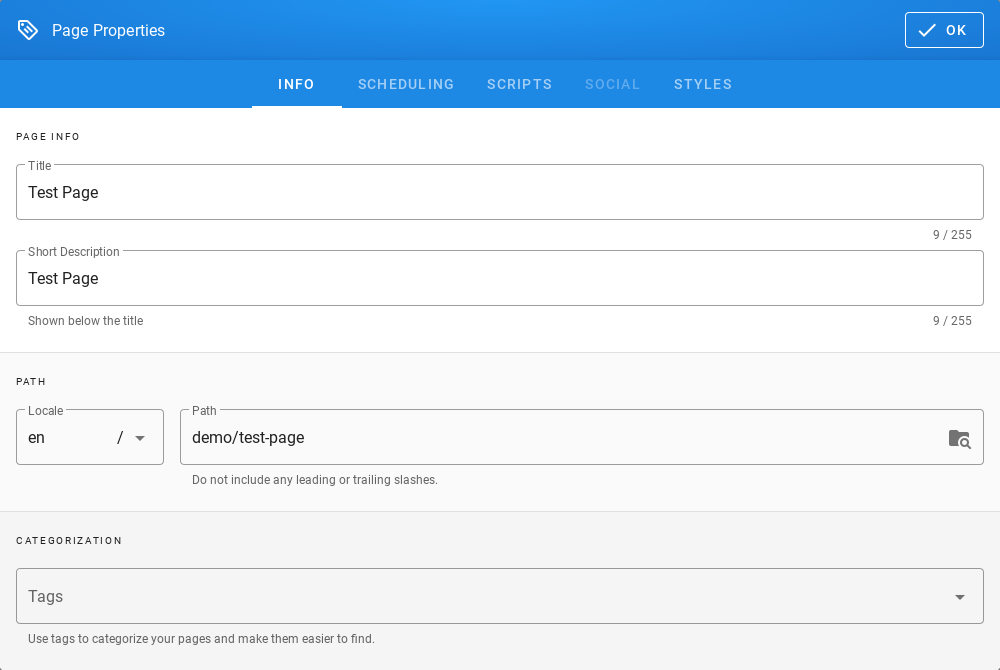
After completing the site with content, save it by clicking the Create button in the menu at the top of the new site editor

After the site is successfully created, the browser will open the newly created site.
Content management
Text formatting features
- change the text size;
- changing the font type;
- bold;
- italics;
- stress;
- strikethrough;
- subscript;
- superscript;
- align (left, right, center, justify);
- numbered list;
- bulleted list;
- to-do list;
- inserting special characters;
- inserting tables;
- inserting text blocks E-doc also offers non-text insertion.
Insert Links
- To insert links, click in the site editor on the Link icon on the editor icon bar:
After clicking on the icon, a text field will appear to enter the website address:
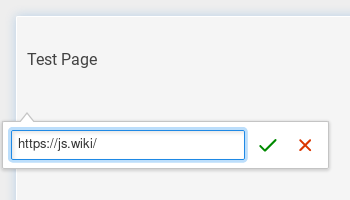
Then click the Save button (green sign next to the text field), then the address to the external site will appear on the current site:
Insert images
To insert images, click in the site editor on the Insert Assets icon on the editor icon bar:

After clicking on the icon, the window for upload images will appear:
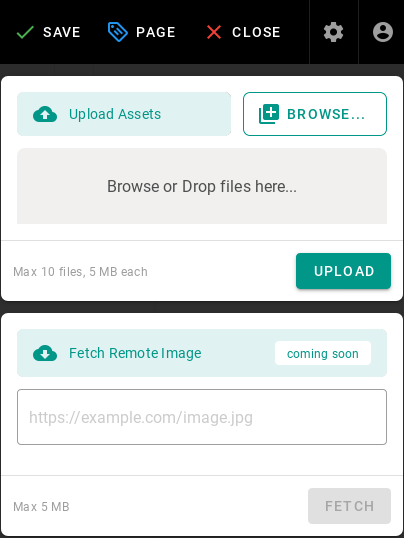
To upload the image, click the Browse button (or from the file manager, drag and drop the file to the Browse or Drop files here … area) then the added file will appear on the list, its name will be on a gray background:
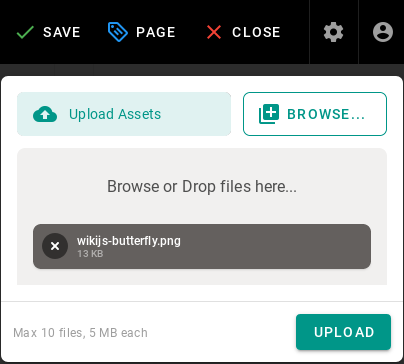
Click the UPLOAD button to send files to the editor, after the upload is completed, you will see information about the status of the operation performed:
After uploading, the image file will also appear in the window where you can select images to insert:
Click on the file name and then the INSERT button to make the image appear on the edited site:
After completing the site with content, save it by clicking the CREATE button in the menu at the top of the editor of the new site:

or the SAVE button in the case of editing an existing site:

After the site is successfully created, the browser will open the newly created site.
Create a “tree” of documents
E-doc does not offer a document tree structure directly. Creating a structure (tree) of documents is done automatically by grouping sites according to the paths in which they are available.
To create document structures (trees), create sites with the following paths:
/en/linux/1-introduction
/en/linux/2-installation
/en/linux/3-configuration
/en/linux/4-administration
/en/linux/5-summary
The items in the menu are sorted alphabetically, so the site titles should begin with a number followed by a dot followed by the name of the site, for example:
- for the site in the path /en/linux/1-introduction you should set the title 1.Introduction;
- for the site in the path /en/linux/2-installation you should set the title 2.Installation;
- for the site in the path /en/linux/3-configuration you should set the title 3.Configuration;
- for the site in the path /en/linux/4-administration you should set the title 4.Administration;
- for the site in the path /en/linux/5-summary you should set the title 5.Summary
In this way, you can create a structure (tree) of documents relating to one topic:
You can create a document with chapters in a similar way. To do this, create sites with the following paths:
/en/elaboration/1-introduction
/en/elaboration/2-chapter-1
/en/elaboration/2-chapter-1
/en/elaboration/2-chapter-1
/en/elaboration/3-summary
The menu items are in alphabetical order. Site titles should begin with a number followed by a period followed by a name that identifies the site’s content:
- for the site in the path /en/elaboration/1-introduction you should set the title 1. Introduction
- for the site in the path /en/elaboration/2-chapter-1 you should set the title 2. Chapter 1
- for the site in the path /en/elaboration/2-chapter-2 you should set the title 2. Chapter 2
- for the site in the path /en/elaboration/2-chapter-3 the title should be set to 2. Chapter 3
- for the site in the path /en/elaboration/3-summary you should set the title 3. Summary
In this way, you can create a structure (tree) of documents related to one document:
Embed allow iframes
iFrames - an element to the HTML language that allows an HTML document to be embedded within another HTML document.
For enable iframes in pages:
- With top menu select
Administration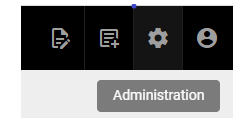
- Now select on left side menu
Rendering
- In
Pipelinemedu selecthtml->html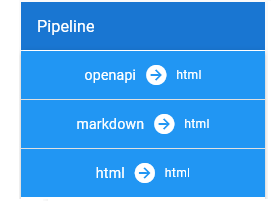
- Then select
Security
- Next enable option
Allow iframes
Applychanges
Now is possible embed iframes in page HTML code.
Example of usage:
- Use iframe tag in page html code.
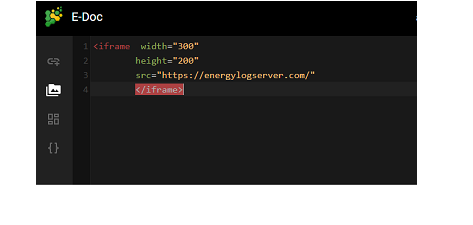
- Result:

Conver Pages
It’s possible convert page between Visoal Editor, MarkDown and Raw HTML.
Example of usage:
- Create or edit page content in
Visual Editor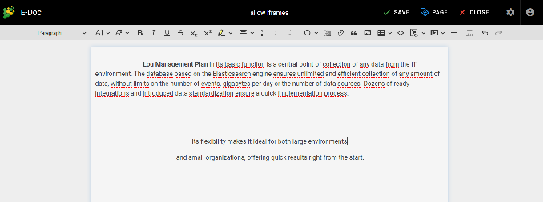
- Click on the
savebutton and later clickclosebutton ‘
- Select
Page ActionandConvert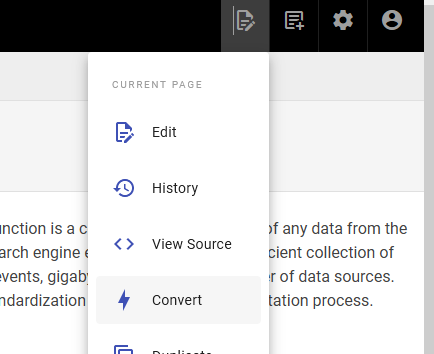
- Choose destination format
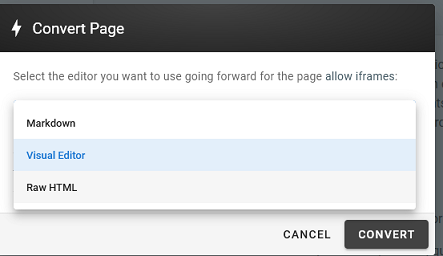
- The content in `Raw HTML format:
CMDB
This module is a tool used to store information about hardware and sofrware assets, its database store information regarding the relationships among its assets.Is a means of understanding the critical assets and their relationships, such as information systyems upstream sources or dependencies of assets. Data coming with indexes wazuh, winlogbeat,syslog and filebeat.
Module CMDB have two tabs:
Infrastructure tab
Get documents button - which get all matching data.
Search by parameters.
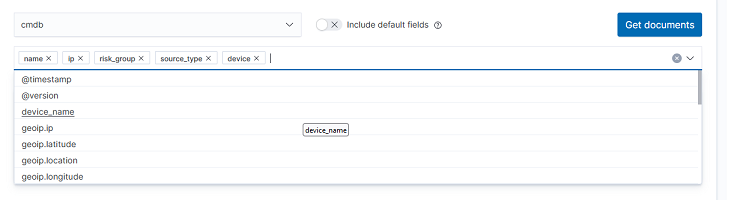
Select query filters - filter data by fields example name or IP.
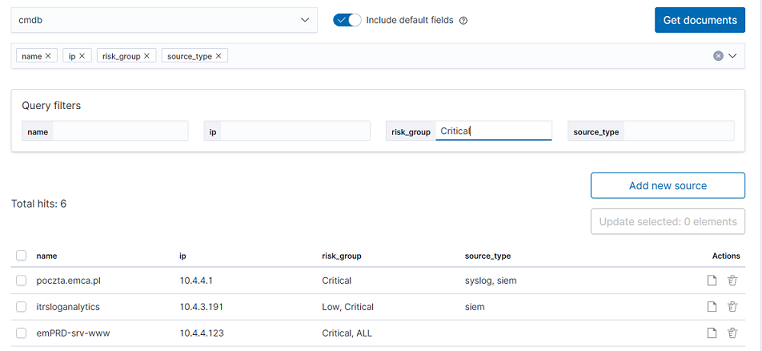
Add new source
- For add new element click
Add new sourcebutton.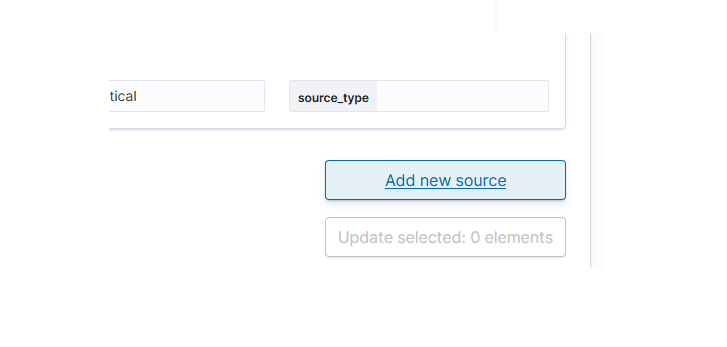
Complete a form:
- name (required)
- ip (optional)
- risk_group (optional)
- lastKeepAlive (optional)
- risk_score (optional)
- siem_id (optional)
- status (optional)
Click
Save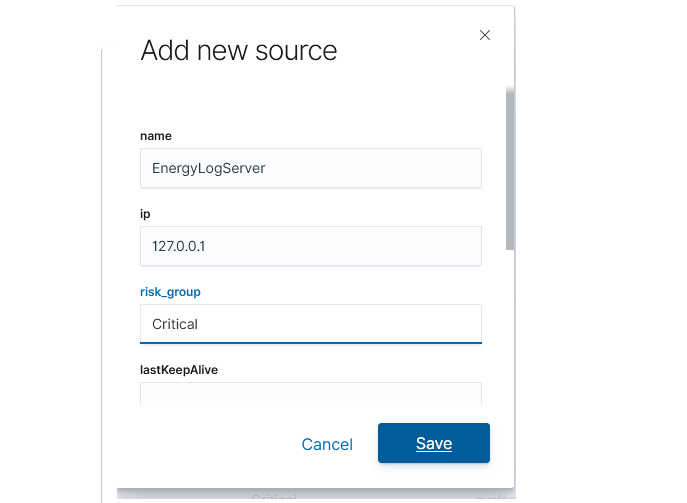
- For add new element click
Update multiple element
- Select multiple items which you needed change
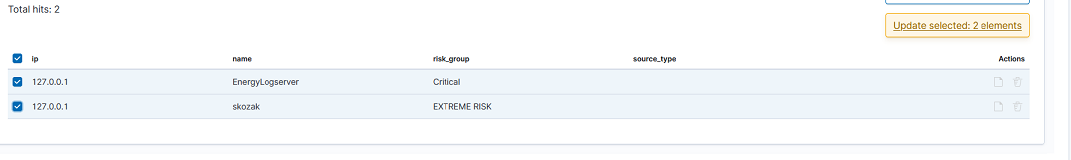
- Select fields for changes (in all selected items)
- Write new value (for all selected items)
- Click
Updatebutton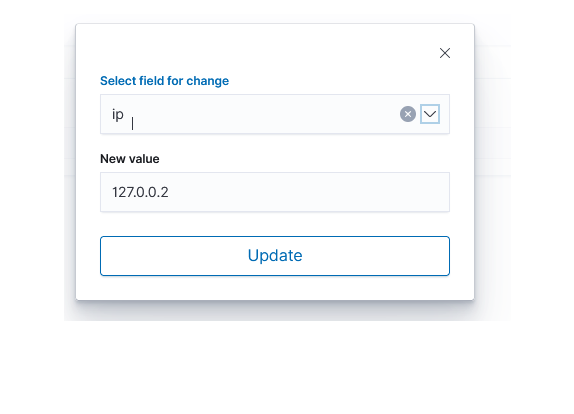
- Select multiple items which you needed change
Update single element
- Select
Updateicon on element
- Change value/values and click
Update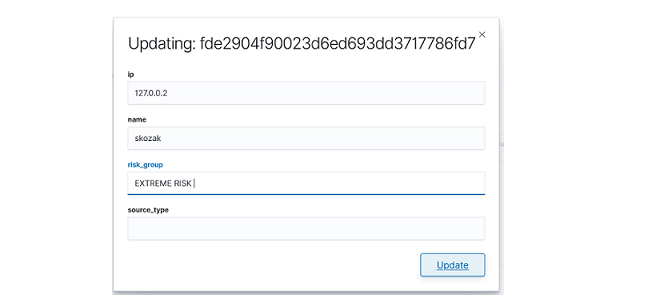
- Select
Relations Tab
- Expand details
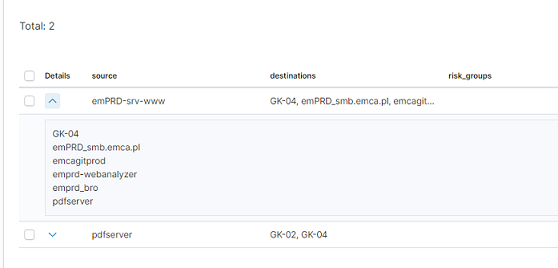
- Edit relation for source
- Click update icon.

- Add new destination for selected source and click
update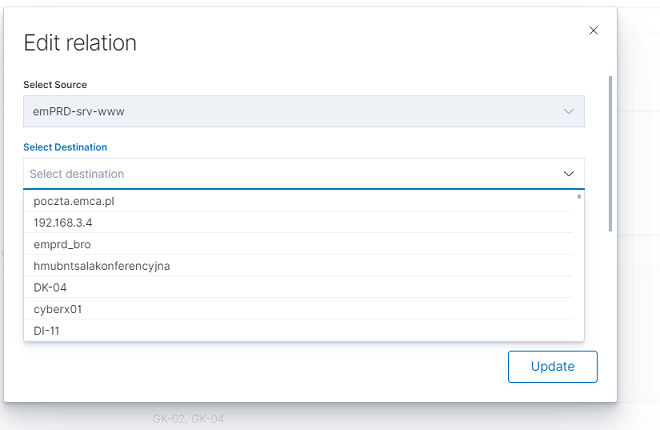
- Delete select destination for delete and click delete destination, confirm with
Updatebutton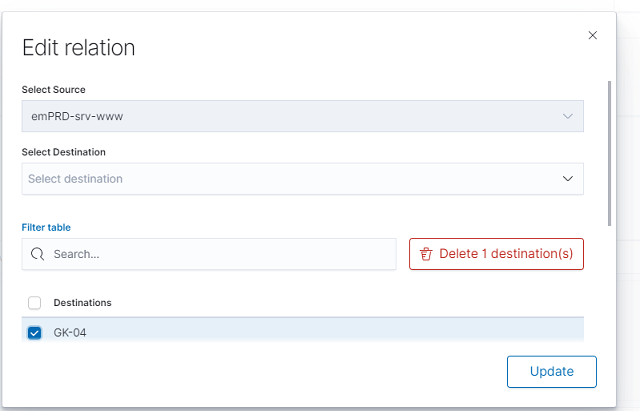
- Click update icon.
- Create relation
- Click
Add new relations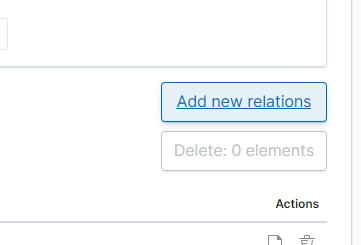
- Select source and one or more destination, next confirm with
Savebutton.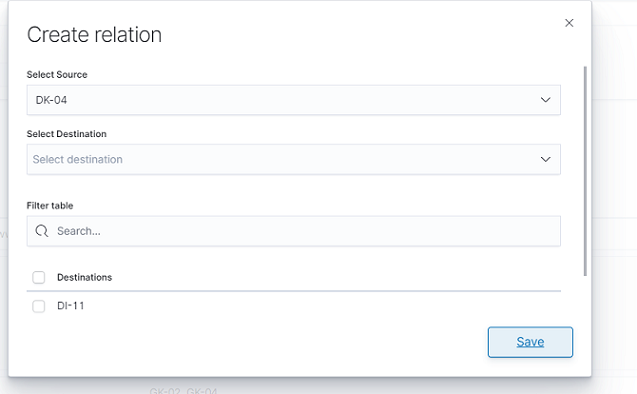
- Click
- Delete relation
- Select delete relation icon
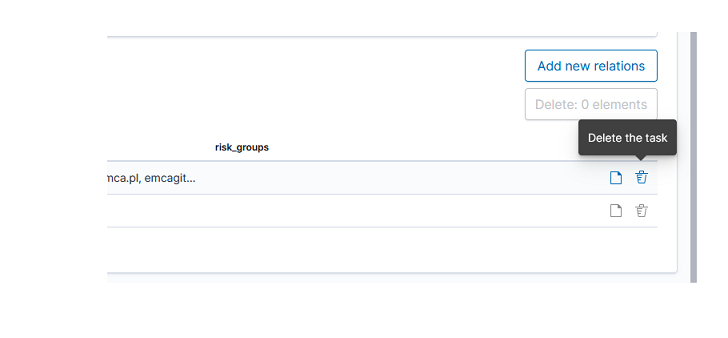
- Confirm delete relation
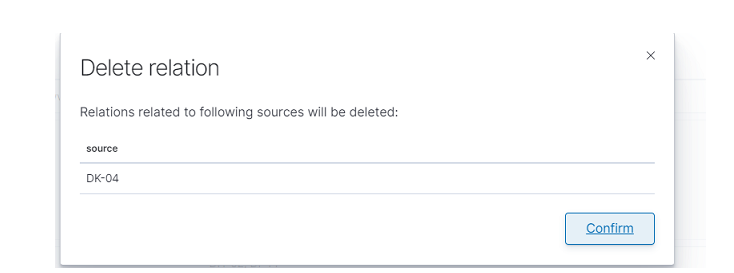
- Select delete relation icon
Integration with network_visualization
Select visualize module
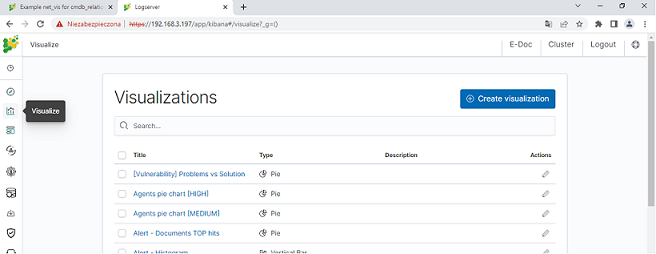
Click create visualization button
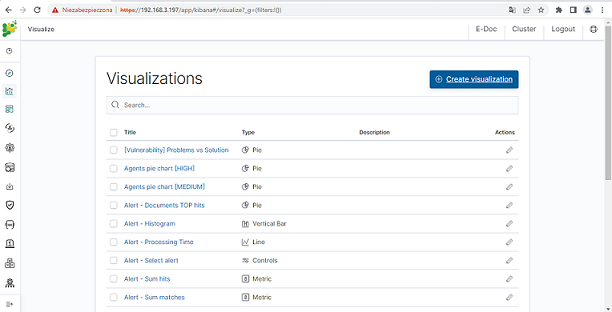
Select Network type
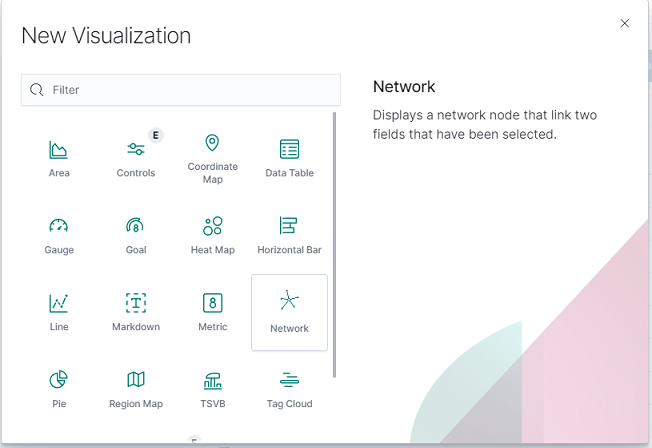
Select
cmdb_relationssource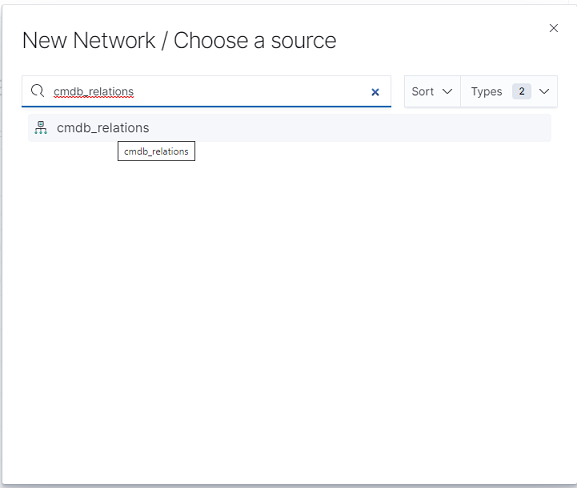
At Buckets menu click
Add,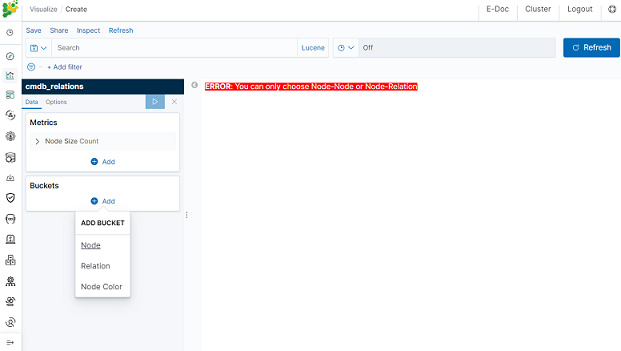
- First bucket Node
- Aggregation: Terms
- Field: source
- Second bucket Node
- Sub aggregation: Terms
- Field: destination
- Third bucket Node Color
- Sub aggregation: Terms
- Field: source_risk_group
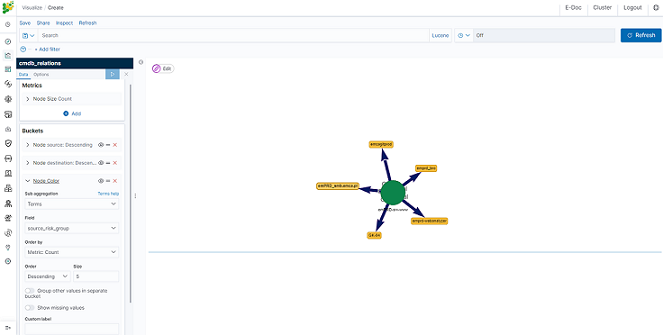
- First bucket Node
Select
optionbutton and matk the checkboxRedirect to CMDB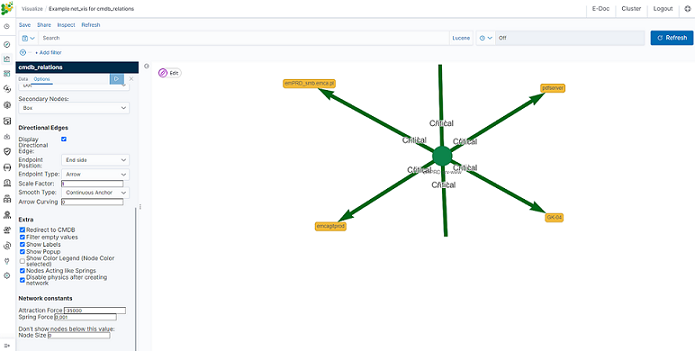
Now if click on some source icon, browser will redirect you to CMDB module with all information for this source.
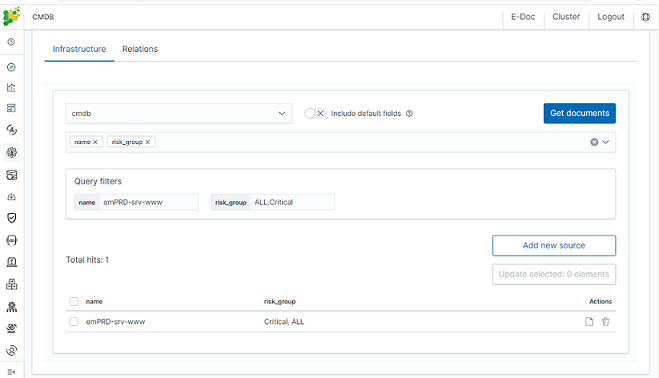
Cerebro - Cluster Health
Cerebro is the Elasticsearch administration tool that allows you to perform the following tasks:
- monitoring and management of indexing nodes, indexes and shards:
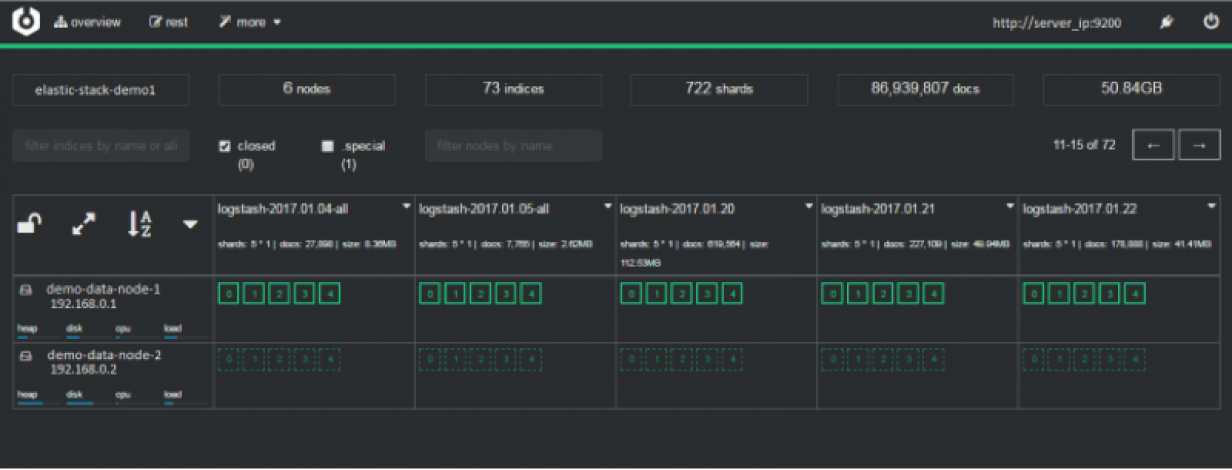
- monitoring and management of index snapshoots :
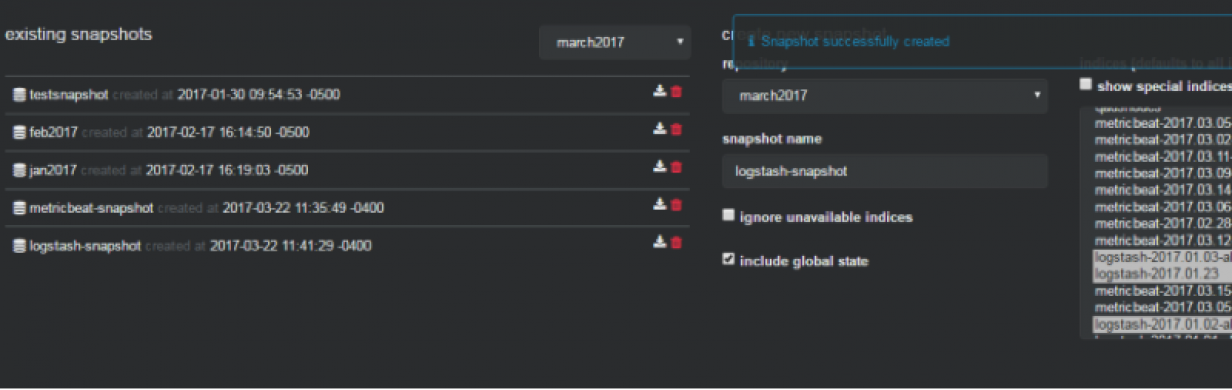
- informing about problems with indexes and shards:
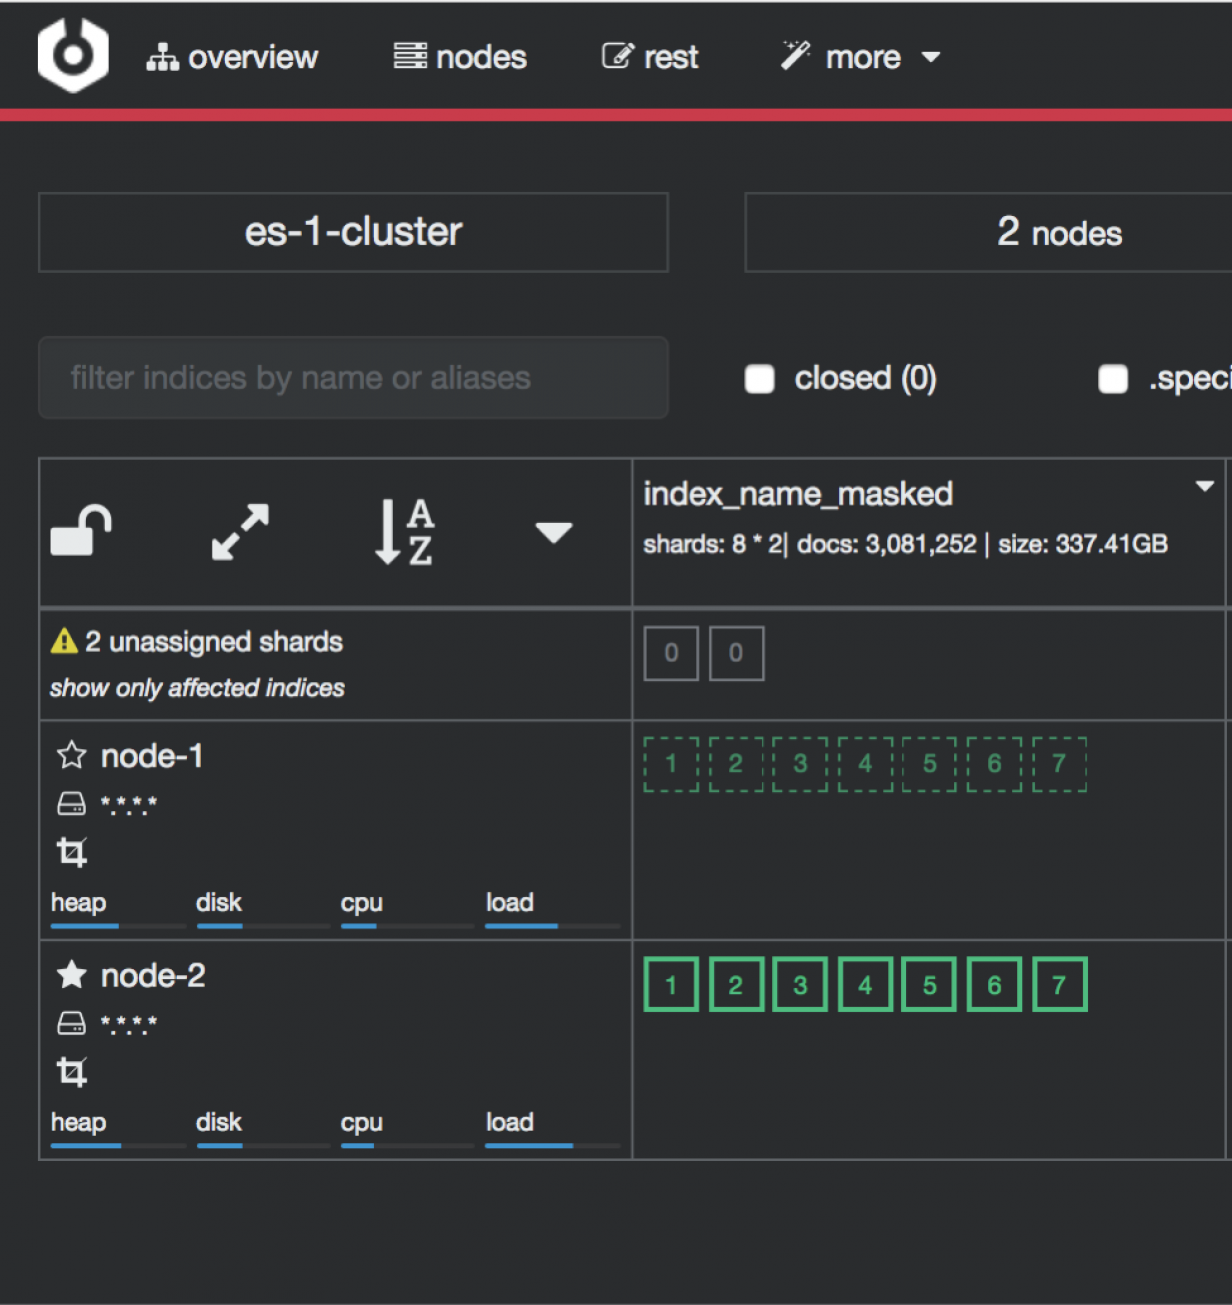
Access to the Cluster module is possible through the button in the upper right corner of the main window.

To configure cerebro see to Configuration section.
Elasticdump
Elasticdump is a tool for moving and saving indices.
Location
/usr/share/kibana/elasticdump/elasticdump
Examples of use
Copy an index from production to staging with analyzer and mapping
elasticdump \
  --input=http://production.es.com:9200/my_index \
  --output=http://staging.es.com:9200/my_index \
  --type=analyzer
elasticdump \
  --input=http://production.es.com:9200/my_index \
  --output=http://staging.es.com:9200/my_index \
  --type=mapping
elasticdump \
  --input=http://production.es.com:9200/my_index \
  --output=http://staging.es.com:9200/my_index \
  --type=data
Backup index data to a file:
elasticdump \
  --input=http://production.es.com:9200/my_index \
  --output=/data/my_index_mapping.json \
  --type=mapping
elasticdump \
  --input=http://production.es.com:9200/my_index \
  --output=/data/my_index.json \
  --type=data
Backup and index to a gzip using stdout
elasticdump \
  --input=http://production.es.com:9200/my_index \
  --output=$ \
  | gzip > /data/my_index.json.gz
Backup the results of a query to a file
elasticdump \
  --input=http://production.es.com:9200/my_index \
  --output=query.json \
  --searchBody="{\"query\":{\"term\":{\"username\": \"admin\"}}}"
Copy a single shard data
elasticdump \
  --input=http://es.com:9200/api \
  --output=http://es.com:9200/api2 \
  --params="{\"preference\":\"_shards:0\"}"
Backup aliases to a file
elasticdump \
  --input=http://es.com:9200/index-name/alias-filter \
  --output=alias.json \
Copy a single type:
elasticdump \
  --input=http://es.com:9200/api/search \
  --input-index=my_index/my_type \
  --output=http://es.com:9200/api/search \
  --output-index=my_index \
  --type=mapping
Usage
elasticdump --input SOURCE --output DESTINATION [OPTIONS]
All parameters
--input
                    Source location (required)
--input-index
                    Source index and type
                    (default: all, example: index/type)
--output
                    Destination location (required)
--output-index
                    Destination index and type
                    (default: all, example: index/type)
--overwrite
                    Overwrite output file if it exists
                    (default: false)
--limit
                    How many objects to move in batch per operation
                    limit is approximate for file streams
                    (default: 100)

--size
                    How many objects to retrieve
                    (default: -1 -> no limit)

--concurrency
                    How many concurrent request is sent to a specified transport
                    (default: 1)

--concurrencyInterval
                    The length of time in milliseconds before the interval count resets. Must be finite.
                    (default: 5000)

--intervalCap
                    The max number of transport request in the given interval of time.
                    (default: 5)

--carryoverConcurrencyCount
                    Whether the task must finish in the given concurrencyInterval
                    (intervalCap will reset to the default whether the request is completed or not)
                    or will be carried over into the next interval count,
                    which will effectively reduce the number of new requests created in the next interval
                    i.e. intervalCap -= <num of carried over requests>
                    (default: true)

--throttleInterval
                    The length of time in milliseconds to delay between getting data from an inputTransport and sending it to an outputTransport
                    (default: 1)

--debug
                    Display the elasticsearch commands being used
                    (default: false)

--quiet
                    Suppress all messages except for errors
                    (default: false)

--type
                    What are we exporting?
                    (default: data, options: [settings, analyzer, data, mapping, alias, template, component_template, index_template])
--filterSystemTemplates
                    Whether to remove metrics-*-* and logs-*-* system templates
                    (default: true])
--templateRegex
                    Regex used to filter templates before passing to the output transport
                    (default: (metrics|logs|\\..+)(-.+)?)
--delete
                    Delete documents one-by-one from the input as they are
                    moved.  Will not delete the source index
                    (default: false)
--headers
                    Add custom headers to Elastisearch requests (helpful when
                    your Elasticsearch instance sits behind a proxy)
                    (default: '{"User-Agent": "elasticdump"}')
--params
                    Add custom parameters to Elastisearch requests uri. Helpful when you for example
                    want to use elasticsearch preference
                    (default: null)
--searchBody
                    Preform a partial extract based on search results
                    (when ES is the input, default values are
                      if ES > 5
                        `'{"query": { "match_all": {} }, "stored_fields": ["*"], "_source": true }'`
                      else
                        `'{"query": { "match_all": {} }, "fields": ["*"], "_source": true }'`
--searchWithTemplate
                    Enable to use Search Template when using --searchBody
                    If using Search Template then searchBody has to consist of "id" field and "params" objects
                    If "size" field is defined within Search Template, it will be overridden by --size parameter
                    See https://www.elastic.co/guide/en/elasticsearch/reference/current/search-template.html for
                    further information
                    (default: false)
--sourceOnly
                    Output only the json contained within the document _source
                    Normal: {"_index":"","_type":"","_id":"", "_source":{SOURCE}}
                    sourceOnly: {SOURCE}
                    (default: false)
--ignore-errors
                    Will continue the read/write loop on write error
                    (default: false)
--scrollId
                    The last scroll Id returned from elasticsearch.
                    This will allow dumps to be resumed used the last scroll Id &
                    `scrollTime` has not expired.
--scrollTime
                    Time the nodes will hold the requested search in order.
                    (default: 10m)
--maxSockets
                    How many simultaneous HTTP requests can we process make?
                    (default:
                      5 [node <= v0.10.x] /
                      Infinity [node >= v0.11.x] )
--timeout
                    Integer containing the number of milliseconds to wait for
                    a request to respond before aborting the request. Passed
                    directly to the request library. Mostly used when you don't
                    care too much if you lose some data when importing
                    but rather have speed.
--offset
                    Integer containing the number of rows you wish to skip
                    ahead from the input transport.  When importing a large
                    index, things can go wrong, be it connectivity, crashes,
                    someone forgetting to `screen`, etc.  This allows you
                    to start the dump again from the last known line written
                    (as logged by the `offset` in the output).  Please be
                    advised that since no sorting is specified when the
                    dump is initially created, there's no real way to
                    guarantee that the skipped rows have already been
                    written/parsed.  This is more of an option for when
                    you want to get most data as possible in the index
                    without concern for losing some rows in the process,
                    similar to the `timeout` option.
                    (default: 0)
--noRefresh
                    Disable input index refresh.
                    Positive:
                      1. Much increase index speed
                      2. Much less hardware requirements
                    Negative:
                      1. Recently added data may not be indexed
                    Recommended to use with big data indexing,
                    where speed and system health in a higher priority
                    than recently added data.
--inputTransport
                    Provide a custom js file to use as the input transport
--outputTransport
                    Provide a custom js file to use as the output transport
--toLog
                    When using a custom outputTransport, should log lines
                    be appended to the output stream?
                    (default: true, except for `$`)
--awsChain
                    Use [standard](https://aws.amazon.com/blogs/security/a-new-and-standardized-way-to-manage-credentials-in-the-aws-sdks/) location and ordering for resolving credentials including environment variables, config files, EC2 and ECS metadata locations
                    _Recommended option for use with AWS_
--awsAccessKeyId
--awsSecretAccessKey
                    When using Amazon Elasticsearch Service protected by
                    AWS Identity and Access Management (IAM), provide
                    your Access Key ID and Secret Access Key
--awsIniFileProfile
                    Alternative to --awsAccessKeyId and --awsSecretAccessKey,
                    loads credentials from a specified profile in aws ini file.
                    For greater flexibility, consider using --awsChain
                    and setting AWS_PROFILE and AWS_CONFIG_FILE
                    environment variables to override defaults if needed
--awsService
                    Sets the AWS service that the signature will be generated for
                    (default: calculated from hostname or host)
--awsRegion
                    Sets the AWS region that the signature will be generated for
                    (default: calculated from hostname or host)
--awsUrlRegex
                    Regular expression that defined valied AWS urls that should be signed
                    (default: ^https?:\\.*.amazonaws.com.*$)
--transform
                    A javascript, which will be called to modify documents
                    before writing it to destination. global variable 'doc'
                    is available.
                    Example script for computing a new field 'f2' as doubled
                    value of field 'f1':
                        doc._source["f2"] = doc._source.f1 * 2;

--httpAuthFile
                    When using http auth provide credentials in ini file in form
                    `user=<username>
                    password=<password>`

--support-big-int
                    Support big integer numbers
--retryAttempts
                    Integer indicating the number of times a request should be automatically re-attempted before failing
                    when a connection fails with one of the following errors `ECONNRESET`, `ENOTFOUND`, `ESOCKETTIMEDOUT`,
                    ETIMEDOUT`, `ECONNREFUSED`, `EHOSTUNREACH`, `EPIPE`, `EAI_AGAIN`
                    (default: 0)

--retryDelay
                    Integer indicating the back-off/break period between retry attempts (milliseconds)
                    (default : 5000)
--parseExtraFields
                    Comma-separated list of meta-fields to be parsed
--maxRows
                    supports file splitting.  Files are split by the number of rows specified
--fileSize
                    supports file splitting.  This value must be a string supported by the **bytes** module.
                    The following abbreviations must be used to signify size in terms of units
                    b for bytes
                    kb for kilobytes
                    mb for megabytes
                    gb for gigabytes
                    tb for terabytes

                    e.g. 10mb / 1gb / 1tb
                    Partitioning helps to alleviate overflow/out of memory exceptions by efficiently segmenting files
                    into smaller chunks that then be merged if needs be.
--fsCompress
                    gzip data before sending output to file.
                    On import the command is used to inflate a gzipped file
--s3AccessKeyId
                    AWS access key ID
--s3SecretAccessKey
                    AWS secret access key
--s3Region
                    AWS region
--s3Endpoint
                    AWS endpoint can be used for AWS compatible backends such as
                    OpenStack Swift and OpenStack Ceph
--s3SSLEnabled
                    Use SSL to connect to AWS [default true]

--s3ForcePathStyle  Force path style URLs for S3 objects [default false]

--s3Compress
                    gzip data before sending to s3
--s3ServerSideEncryption
                    Enables encrypted uploads
--s3SSEKMSKeyId
                    KMS Id to be used with aws:kms uploads
--s3ACL
                    S3 ACL: private | public-read | public-read-write | authenticated-read | aws-exec-read |
                    bucket-owner-read | bucket-owner-full-control [default private]
--retryDelayBase
                    The base number of milliseconds to use in the exponential backoff for operation retries. (s3)
--customBackoff
                    Activate custom customBackoff function. (s3)
--tlsAuth
                    Enable TLS X509 client authentication
--cert, --input-cert, --output-cert
                    Client certificate file. Use --cert if source and destination are identical.
                    Otherwise, use the one prefixed with --input or --output as needed.
--key, --input-key, --output-key
                    Private key file. Use --key if source and destination are identical.
                    Otherwise, use the one prefixed with --input or --output as needed.
--pass, --input-pass, --output-pass
                    Pass phrase for the private key. Use --pass if source and destination are identical.
                    Otherwise, use the one prefixed with --input or --output as needed.
--ca, --input-ca, --output-ca
                    CA certificate. Use --ca if source and destination are identical.
                    Otherwise, use the one prefixed with --input or --output as needed.
--inputSocksProxy, --outputSocksProxy
                    Socks5 host address
--inputSocksPort, --outputSocksPort
                    Socks5 host port
--handleVersion
                    Tells elastisearch transport to handle the `_version` field if present in the dataset
                    (default : false)
--versionType
                    Elasticsearch versioning types. Should be `internal`, `external`, `external_gte`, `force`.
                    NB : Type validation is handle by the bulk endpoint and not elasticsearch-dump
--csvDelimiter
                    The delimiter that will separate columns.
                    (default : ',')
--csvFirstRowAsHeaders
                    If set to true the first row will be treated as the headers.
                    (default : true)
--csvRenameHeaders
                    If you want the first line of the file to be removed and replaced by the one provided in the `csvCustomHeaders` option
                    (default : true)
--csvCustomHeaders  A comma-seperated listed of values that will be used as headers for your data. This param must
                    be used in conjunction with `csvRenameHeaders`
                    (default : null)
--csvWriteHeaders   Determines if headers should be written to the csv file.
                    (default : true)
--csvIgnoreEmpty
                    Set to true to ignore empty rows.
                    (default : false)
--csvSkipLines
                    If number is > 0 the specified number of lines will be skipped.
                    (default : 0)
--csvSkipRows
                    If number is > 0 then the specified number of parsed rows will be skipped
                    (default : 0)
--csvTrim
                    Set to true to trim all white space from columns.
                    (default : false)
--csvRTrim
                    Set to true to right trim all columns.
                    (default : false)
--csvLTrim
                    Set to true to left trim all columns.
                    (default : false)
--csvHandleNestedData
                    Set to true to handle nested JSON/CSV data.
                    NB : This is a very optioninated implementaton !
                    (default : false)
--csvIdColumn
                    Name of the column to extract the record identifier (id) from
                    When exporting to CSV this column can be used to override the default id (@id) column name
                    (default : null)
--csvIndexColumn
                    Name of the column to extract the record index from
                    When exporting to CSV this column can be used to override the default index (@index) column name
                    (default : null)
--csvTypeColumn
                    Name of the column to extract the record type from
                    When exporting to CSV this column can be used to override the default type (@type) column name
                    (default : null)
--help
                    This page
Elasticsearch’s Scroll API
Elasticsearch provides a scroll API to fetch all documents of an index starting from (and keeping) a consistent snapshot in time, which we use under the hood. This method is safe to use for large exports since it will maintain the result set in cache for the given period of time.
NOTE: only works for –output
Bypassing self-sign certificate errors
Set the environment NODE_TLS_REJECT_UNAUTHORIZED=0 before running elasticdump
An alternative method of passing environment variables before execution
NB : This only works with linux shells
NODE_TLS_REJECT_UNAUTHORIZED=0 elasticdump –input=”https://localhost:9200” –output myfile
Curator - Elasticsearch index management tool
Curator is a tool that allows you to perform index management tasks, such as:
- Close Indices
- Delete Indices
- Delete Snapshots
- Forcemerge segments
- Changing Index Settings
- Open Indices
- Reindex data
And other.
Curator installation
Curator is delivered with the client node installer.
Curator configuration
Create directory for configuration:
mkdir /etc/curator
Create directory for Curator logs file:
mkdir /var/log/curator
Running Curator
The curator executable is located in the directory:
/usr/share/kibana/curator/bin/curator
Curator requires two parameters:
- config - path to configuration file for Curator
- path to action file for Curator
Example running command:
/usr/share/kibana/curator/bin/curator --config /etc/curator/curator.conf /etc/curator/close_indices.yml
Sample configuration file
Remember, leave a key empty if there is no value. None will be a string, not a Python “NoneType”
client:
  hosts:
    - 127.0.0.1
  port: 9200
#  url_prefix:
#  use_ssl: False
#  certificate:
  client_cert:
  client_key:
  ssl_no_validate: False
  http_auth: $user:$passowrd
  timeout: 30
  master_only: True

logging:
  loglevel: INFO
  logfile: /var/log/curator/curator.log
  logformat: default
  blacklist: ['elasticsearch', 'urllib3']
Sample action file
close indices
actions:
  1:
    action: close
    description: >-
      Close indices older than 30 days (based on index name), for logstash-
      prefixed indices.
    options:
      delete_aliases: False
      timeout_override:
      continue_if_exception: False
      disable_action: True
    filters:
    - filtertype: pattern
      kind: prefix
      value: logstash-
      exclude:
    - filtertype: age
      source: name
      direction: older
      timestring: '%Y.%m.%d'
      unit: days
      unit_count: 30
      exclude:
delete indices
actions:
  1:
    action: delete_indices
    description: >-
      Delete indices older than 45 days (based on index name), for logstash-
      prefixed indices. Ignore the error if the filter does not result in an
      actionable list of indices (ignore_empty_list) and exit cleanly.
    options:
      ignore_empty_list: True
      timeout_override:
      continue_if_exception: False
      disable_action: True
    filters:
    - filtertype: pattern
      kind: prefix
      value: logstash-
      exclude:
    - filtertype: age
      source: name
      direction: older
      timestring: '%Y.%m.%d'
      unit: days
      unit_count: 45
      exclude:
forcemerge segments
actions:
  1:
    action: forcemerge
    description: >-
      forceMerge logstash- prefixed indices older than 2 days (based on index
      creation_date) to 2 segments per shard.  Delay 120 seconds between each
      forceMerge operation to allow the cluster to quiesce.
      This action will ignore indices already forceMerged to the same or fewer
      number of segments per shard, so the 'forcemerged' filter is unneeded.
    options:
      max_num_segments: 2
      delay: 120
      timeout_override:
      continue_if_exception: False
      disable_action: True
    filters:
    - filtertype: pattern
      kind: prefix
      value: logstash-
      exclude:
    - filtertype: age
      source: creation_date
      direction: older
      unit: days
      unit_count: 2
      exclude:
open indices
actions:
  1:
    action: open
    description: >-
      Open indices older than 30 days but younger than 60 days (based on index
      name), for logstash- prefixed indices.
    options:
      timeout_override:
      continue_if_exception: False
      disable_action: True
    filters:
    - filtertype: pattern
      kind: prefix
      value: logstash-
      exclude:
    - filtertype: age
      source: name
      direction: older
      timestring: '%Y.%m.%d'
      unit: days
      unit_count: 30
      exclude:
    - filtertype: age
      source: name
      direction: younger
      timestring: '%Y.%m.%d'
      unit: days
      unit_count: 60
      exclude:
replica reduce
actions:
  1:
    action: replicas
    description: >-
      Reduce the replica count to 0 for logstash- prefixed indices older than
      10 days (based on index creation_date)
    options:
      count: 0
      wait_for_completion: False
      timeout_override:
      continue_if_exception: False
      disable_action: True
    filters:
    - filtertype: pattern
      kind: prefix
      value: logstash-
      exclude:
    - filtertype: age
      source: creation_date
      direction: older
      unit: days
      unit_count: 10
      exclude:
Cross-cluster Search
Cross-cluster search lets you run a single search request against one or more remote clusters. For example, you can use a cross-cluster search to filter and analyze log data stored on clusters in different data centers.
Configuration
Use
_clusterAPI to add least one remote cluster:curl -u user:password -X PUT "localhost:9200/_cluster/settings?pretty" -H 'Content-Type: application/json' -d' { "persistent": { "cluster": { "remote": { "cluster_one": { "seeds": [ "192.168.0.1:9300" ] }, "cluster_two": { "seeds": [ "192.168.0.2:9300" ] } } } } }'
To search data in index
twitterlocated on thecluster_oneuse following command:curl -u user:password -X GET "localhost:9200/cluster_one:twitter/_search?pretty" -H 'Content-Type: application/json' -d' { "query": { "match": { "user": "kimchy" } } }'
To search data in index
twitterlocated on multiple clusters, use following command:curl -u user:password -X GET "localhost:9200/twitter,cluster_one:twitter,cluster_two:twitter/_search?pretty" -H 'Content-Type: application/json' -d' { "query": { "match": { "user": "kimchy" } } }'
Configure index pattern in Kibana GUI to discover data from multiple clusters:
cluster_one:logstash-*,cluster_two:logstash-*
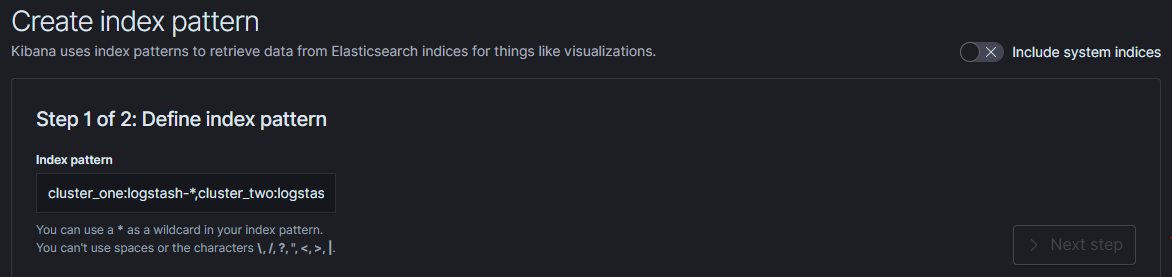
Security
Cross-cluster search uses the Elasticsearch transport layer (default 9300/tcp port) to exchange data. To secure the transmission, encryption must be enabled for the transport layer.
Configuration is in the /etc/elasticsearch/elastisearch.yml file:
# Transport layer encryption
logserverguard.ssl.transport.enabled: true
logserverguard.ssl.transport.pemcert_filepath: "/etc/elasticsearch/ssl/certificate.crt"
logserverguard.ssl.transport.pemkey_filepath: "/etc/elasticsearch/ssl/certificate.key"
logserverguard.ssl.transport.pemkey_password: ""
logserverguard.ssl.transport.pemtrustedcas_filepath: "/etc/elasticsearch/ssl/rootCA.crt"

logserverguard.ssl.transport.enforce_hostname_verification: false
logserverguard.ssl.transport.resolve_hostname: false
Encryption must be enabled on each cluster.
Sync/Copy
The Sync/Copy module allows you to synchronize or copy data between two Elasticsearch clusters. You can copy or synchronize selected indexes or indicate index pattern.
Configuration
Before starting Sync/Copy, complete the source and target cluster data in the Profile and Create profiletab:
- Protocol - http or https;
- Host - IP address ingest node;
- Port - communication port (default 9200);
- Username - username that has permission to get data and save data to the cluster;
- Password - password of the above user
- Cluster name
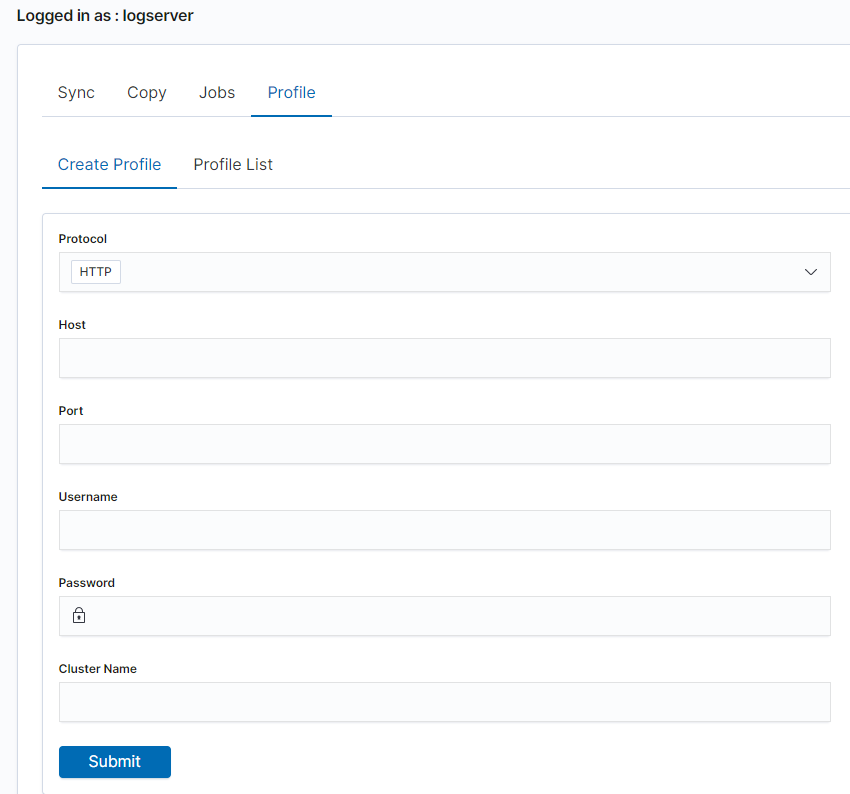
You can view or delete the profile in the Profile List tab.
Synchronize data
To perform data synchronization, follow the instructions:
- go to the
Synctab; - select
Source Profile - select
Destination Profile - enter the index pattern name in
Index pattern to sync - or use switch
Toggle to select between Index pattern or nameand enter indices name. - to create synchronization task, press
Submitbutton
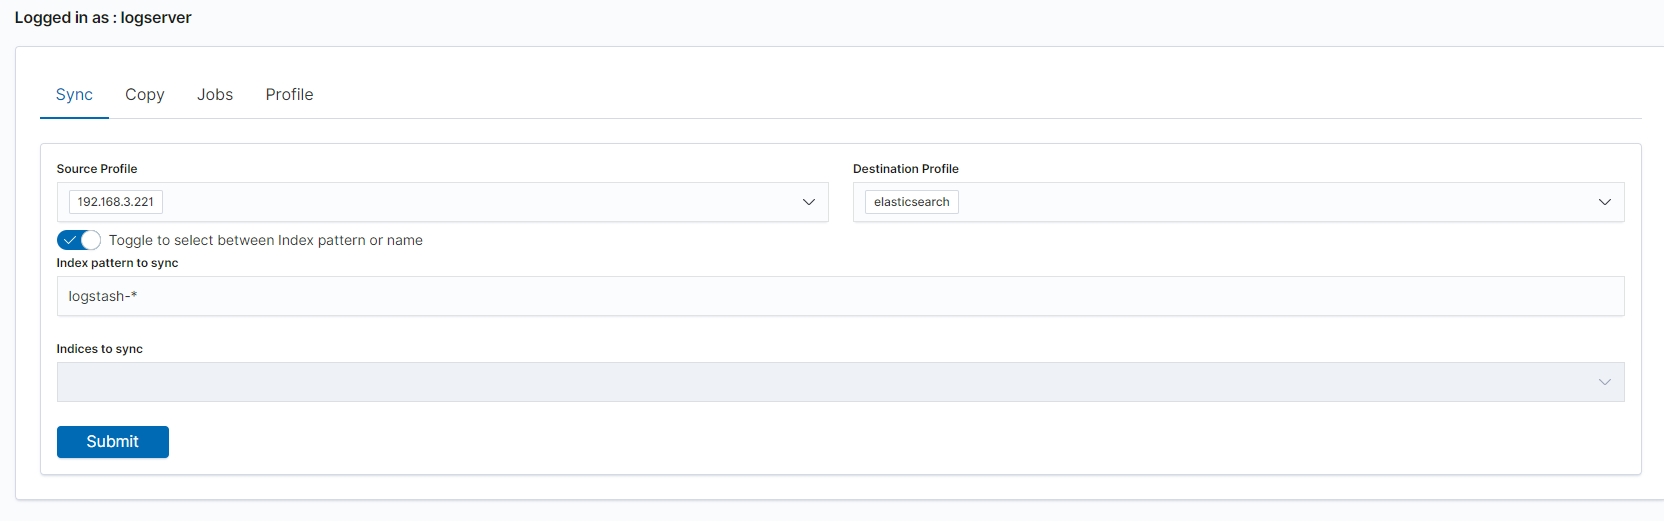
Copy data
To perform data copy, follow the instructions:
- go to the
Copytab; - select
Source Profile - select
Destination Profile - enter the index pattern name in
Index pattern to sync - or use switch
Toggle to select between Index pattern or nameand enter indices name. - to start copying data press the
Submitbutton
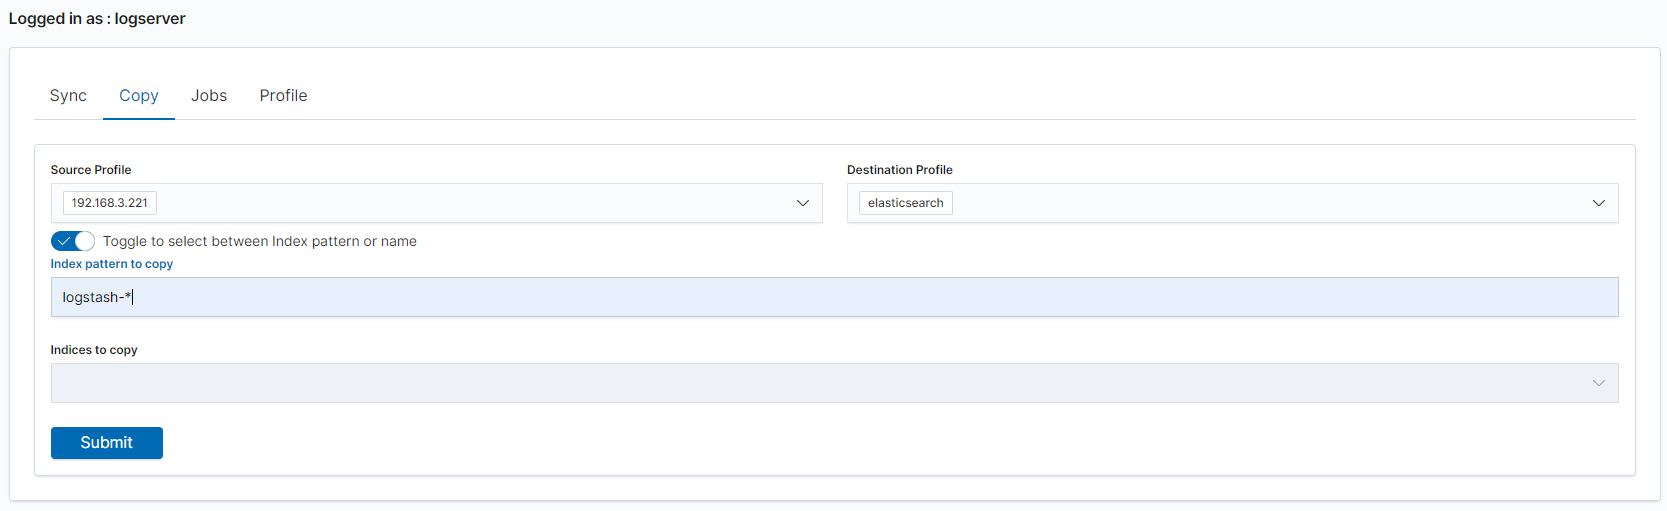
Running Sync/Copy
Prepared Copy/Sync tasks can be run on demand or according to a set schedule.
To do this, go to the Jobs tab. With each task you will find the Action button that allows:
- running the task;
- scheduling task in Cron format;
- deleting task;
- download task logs.
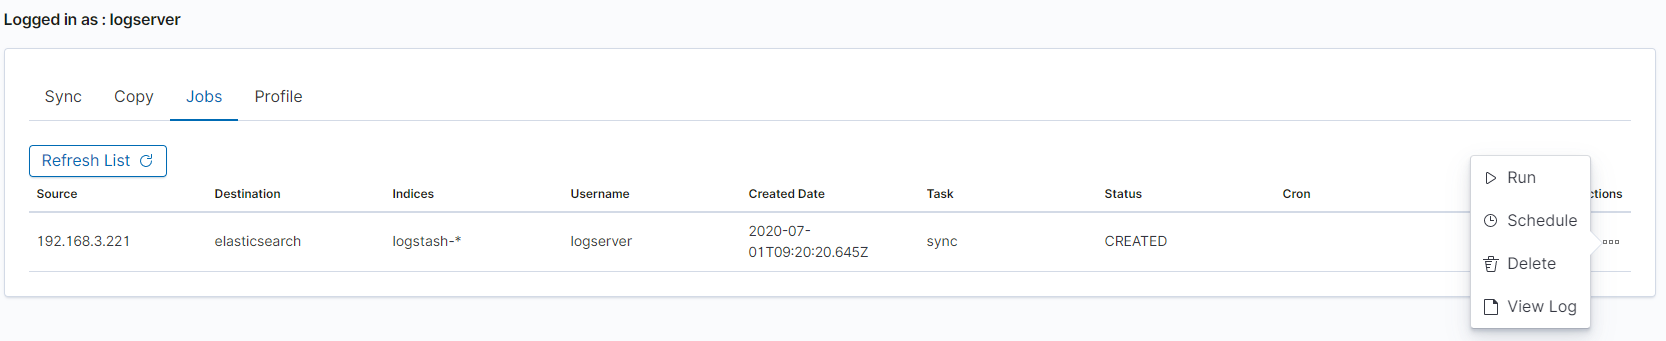
XLSX Import
The XLSX Import module allow to import your xlsx and csv file to indices.
Importing steps
Go to XLSX Import module and select your file and sheet:
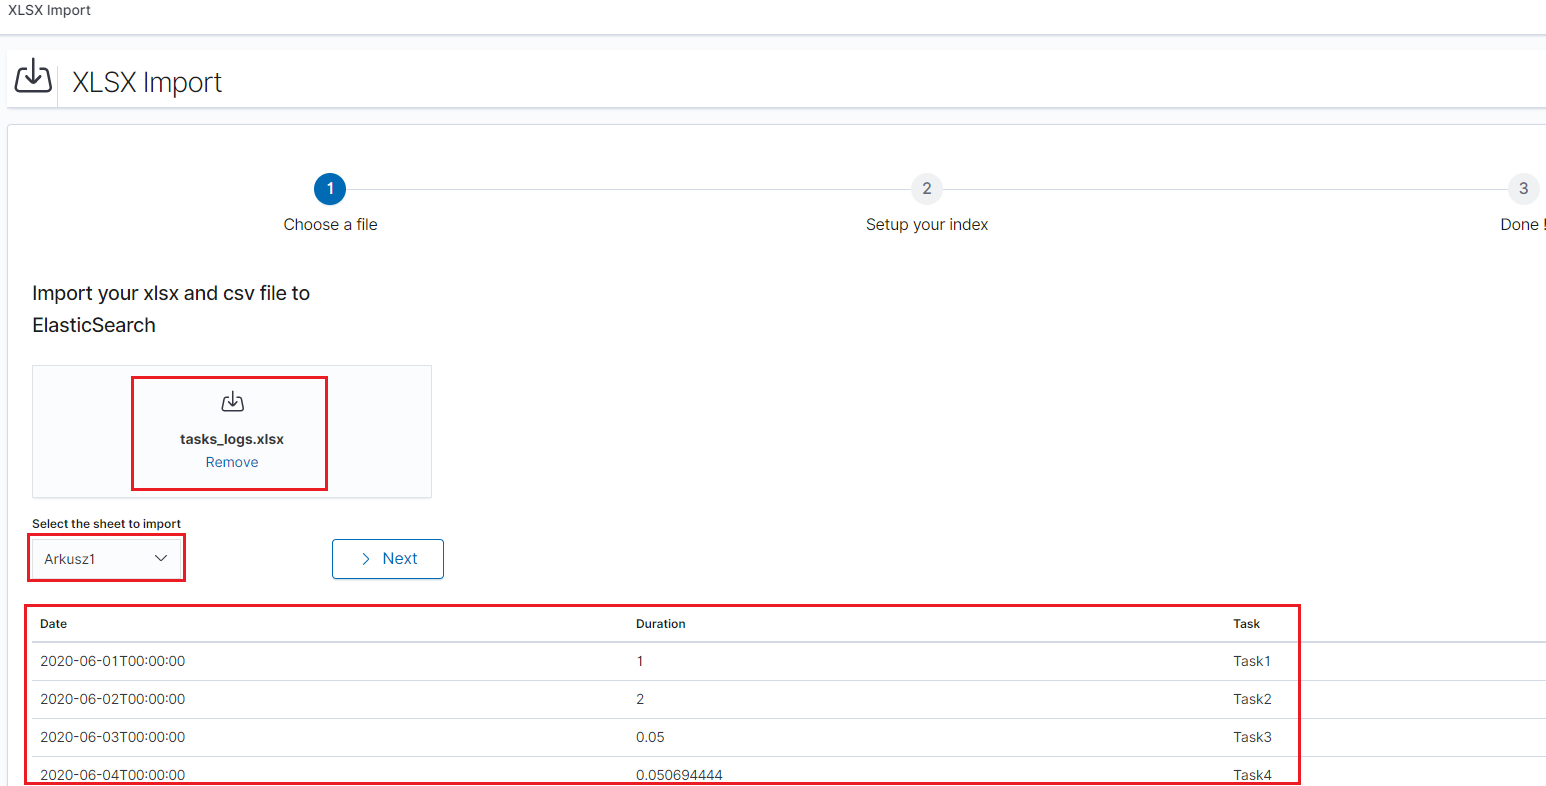
After the data has been successfully loaded, you will see a preview of your data at the bottom of the window.
Press
Nextbutton.In the next step, enter the index name in the
Index namefield, you can also change the pattern for the document ID and select the columns that the import will skip.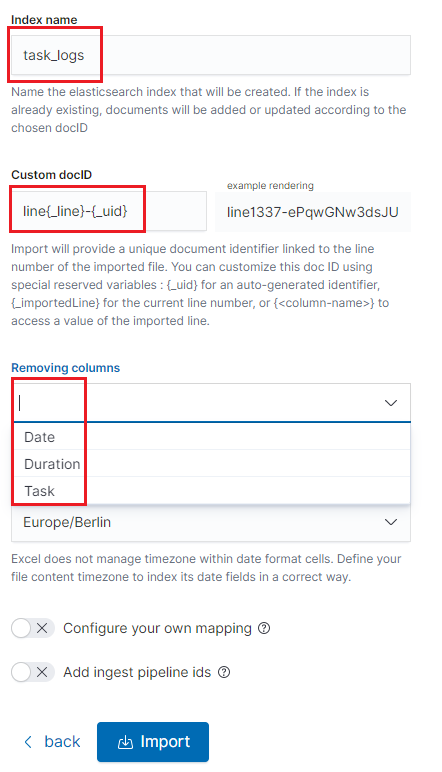
Select the
Configure your own mappingfor every field. You can choose the type and apply more options with the advanced JSON. The list of parameters can be found here, https://www.elastic.co/guide/en/elasticsearch/reference/7.x/mapping-params.htmlAfter the import configuration is complete, select the
Importbutton to start the import process.After the import process is completed, a summary will be displayed. Now you can create a new index pattern to view your data in the Discovery module.
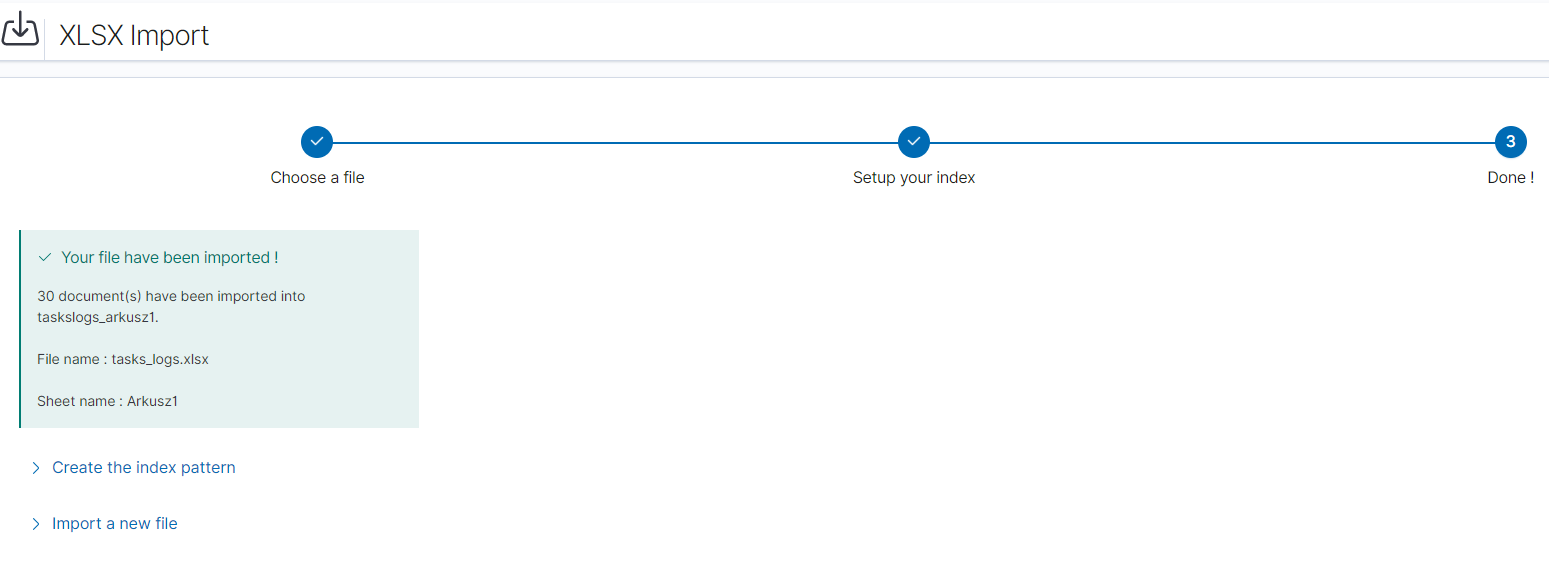
Logtrail
LogTrail module allow to view, analyze, search and tail log events from multiple indices in realtime. Main features of this module are:
- View, analyze and search log events from a centralized interface
- Clean & simple devops friendly interface
- Live tail
- Filter aggregated logs by hosts and program
- Quickly seek to logs based on time
- Supports highlighting of search matches
- Supports multiple Elasticsearch index patterns each with different schemas
- Can be extended by adding additional fields to log event
- Color coding of messages based on field values
Default Logtrail configuration, keeps track of event logs for Elasticsearch, Logstash, Kibana and Alert processes. The module allows you to track events from any index stored in Elasticsearch.
Configuration
The LogTrail module uses the Logstash pipeline to retrieve data from any of the event log files and save its contents to the Elasticsearch index.
Logstash configuration
Example for the file /var/log/messages
Add the Logstash configuration file in the correct pipline (default is “logtrail”):
vi /etc/logstash/conf.d/logtrail/messages.confinput { file { path => "/var/log/messages" start_position => beginning tags => "logtrail_messages" } } filter { if "logtrail_messages" in [tags] { grok { match => { #"message" => "%{SYSLOGTIMESTAMP:syslog_timestamp} %{SYSLOGHOST:hostname} %{DATA:program}(?:\[%{POSINT:pid}\])?: %{GREEDYDATA:syslog_message}" # If syslog is format is "<%PRI%><%syslogfacility%>%TIMESTAMP% %HOSTNAME% %syslogtag%%msg:::sp-if-no-1st-sp%%msg:::drop-last-lf%\n" "message" => "<?%{NONNEGINT:priority}><%{NONNEGINT:facility}>%{SYSLOGTIMESTAMP:syslog_timestamp} %{SYSLOGHOST:hostname} %{DATA:program}(?:\[%{POSINT:pid}\])?: %{GREEDYDATA:syslog_message}" } } date { match => [ "syslog_timestamp", "MMM d HH:mm:ss", "MMM dd HH:mm:ss" ] } ruby { code => "event.set('level',event.get('priority').to_i - ( event.get('facility').to_i * 8 ))" } } } output { if "logtrail_messages" in [tags] { elasticsearch { hosts => "http://localhost:9200" index => "logtrail-messages-%{+YYYY.MM}" user => "logstash" password => "logstash" } } }
Restart the Logstash service
systemctl restart logstash
Kibana configuration
Set up a new pattern index
logtrail-messages*in the Energy Logserver configuration. The procedure is described in the chapter First login.Add a new configuration section in the LogTrail configuration file:
vi /usr/share/kibana/plugins/logtrail/logtrail.json{ "index_patterns" : [ { "es": { "default_index": "logstash-message-*", "allow_url_parameter": false }, "tail_interval_in_seconds": 10, "es_index_time_offset_in_seconds": 0, "display_timezone": "Etc/UTC", "display_timestamp_format": "MMM DD HH:mm:ss", "max_buckets": 500, "default_time_range_in_days" : 0, "max_hosts": 100, "max_events_to_keep_in_viewer": 5000, "fields" : { "mapping" : { "timestamp" : "@timestamp", "display_timestamp" : "@timestamp", "hostname" : "hostname", "program": "program", "message": "syslog_message" }, "message_format": "{{{syslog_message}}}" }, "color_mapping" : { "field": "level", "mapping" : { "0": "#ff0000", "1": "#ff3232", "2": "#ff4c4c", "3": "#ff7f24", "4": "#ffb90f", "5": "#a2cd5a" } } } ] }
Restate the Kibana service
systemctl restart kibana
Using Logtrail
To access of the LogTrail module, click the tile icon from the main menu bar and then go to the „LogTrail” icon.
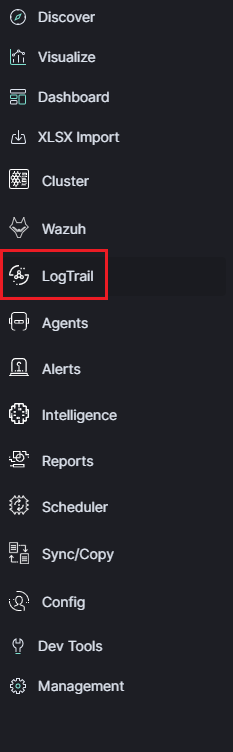
The main module window contains the content of messages that are automatically updated.
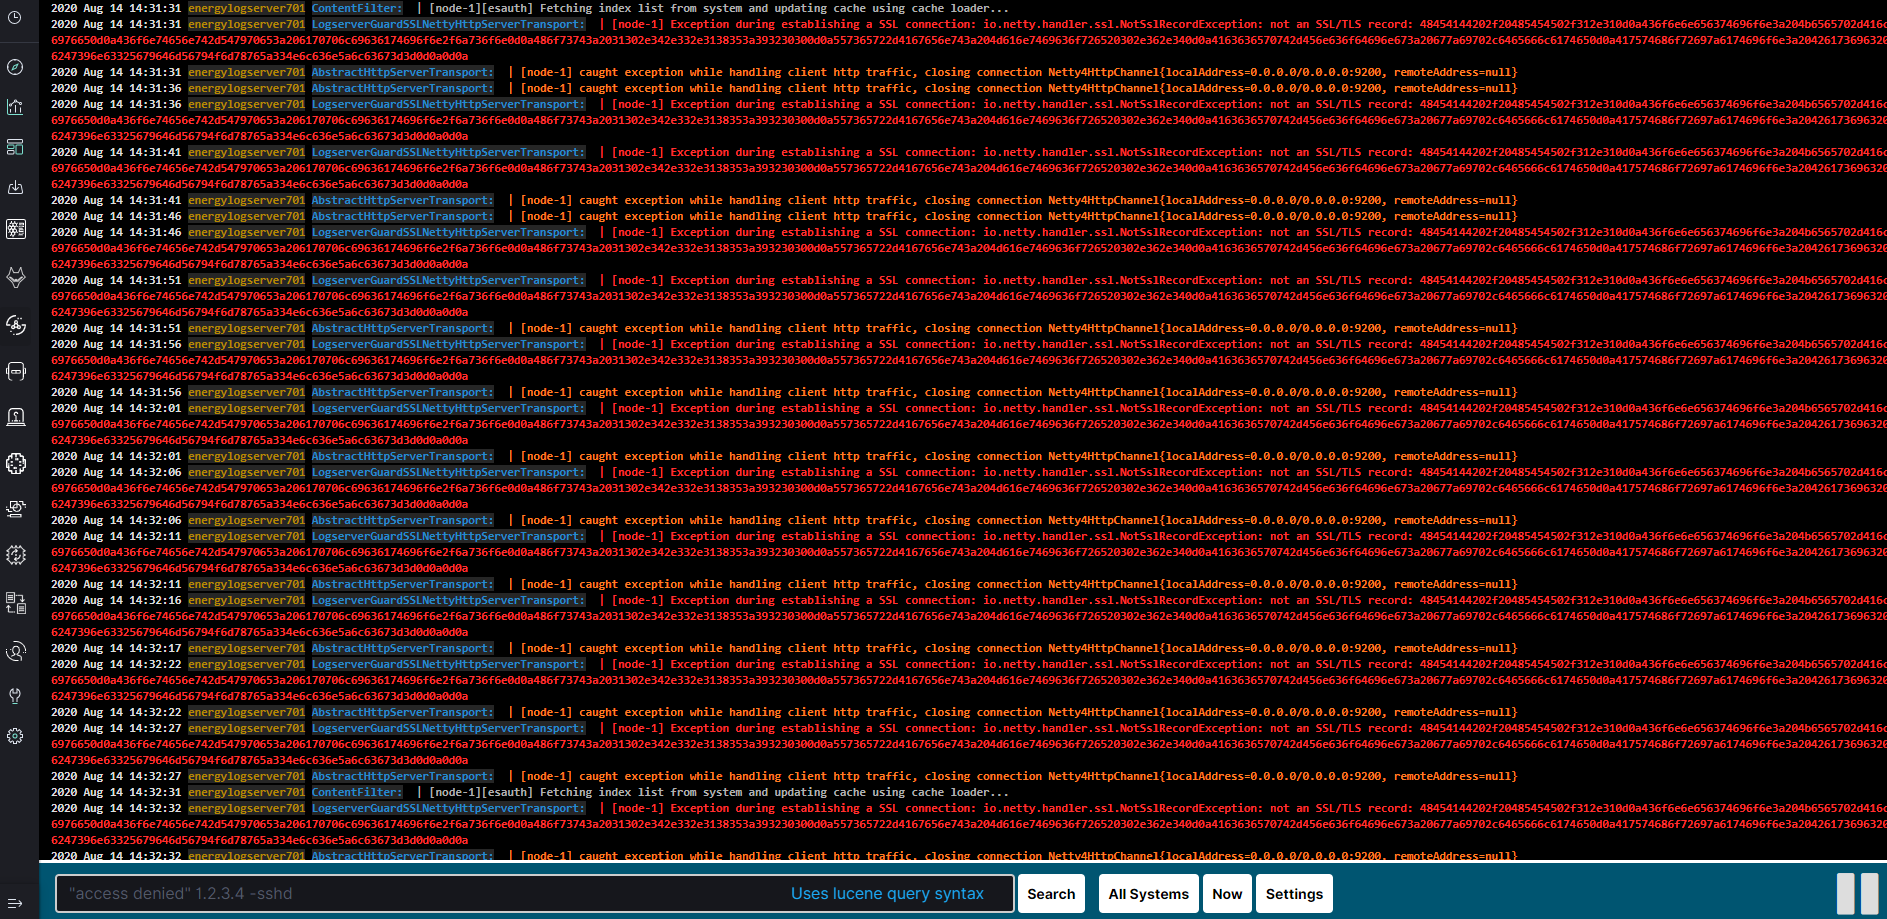
Below is the search and options bar.

It allows you to search for event logs, define the systems from which events will be displayed, define the time range for events and define the index pattern.
Logstash
The Energy Logserver use Logstash service to dynamically unify data from disparate sources and normalize the data into destination of your choose. A Logstash pipeline has two required elements, input and output, and one optional element filter. The input plugins consume data from a source, the filter plugins modify the data as you specify, and the output plugins write the data to a destination. The default location of the Logstash plugin files is: /etc/logstash/conf.d/. This location contain following Energy Logserver
Energy Logserver default plugins:
01-input-beats.conf01-input-syslog.conf01-input-snmp.conf01-input-http.conf01-input-file.conf01-input-database.conf020-filter-beats-syslog.conf020-filter-network.conf099-filter-geoip.conf100-output-elasticsearch.confnaemon_beat.exampleperflogs.example
Logstash - Input “beats”
This plugin wait for receiving data from remote beats services. It use tcp /5044 port for communication:
                input {
                        beats {
                                port => 5044
                        }
                }
Logstash - Input “network”
This plugin read events over a TCP or UDP socket assigns the appropriate tags:
input {
       tcp {
               port => 5514
               type => "network"
               tags => [ "LAN", "TCP" ]
       }
       udp {
               port => 5514
               type => "network"
               tags => [ "LAN", "UDP" ]
       }
}
To redirect the default syslog port (514/TCP/UDP) to the dedicated collector port, follow these steps:
firewall-cmd --add-forward-port=port=514:proto=udp:toport=5514:toaddr=127.0.0.1 --permanent
firewall-cmd --add-forward-port=port=514:proto=tcp:toport=5514:toaddr=127.0.0.1 --permanent
firewall-cmd --reload
systemctl restart firewalld
Logstash - Input SNMP
The SNMP input polls network devices using Simple Network Management Protocol (SNMP) to gather information related to the current state of the devices operation:
input {
  snmp {
    get => ["1.3.6.1.2.1.1.1.0"]
    hosts => [{host => "udp:127.0.0.1/161" community => "public" version => "2c"  retries => 2  timeout => 1000}]
  }
}
Logstash - Input HTTP / HTTPS
Using this input you can receive single or multiline events over http(s). Applications can send an HTTP request to the endpoint started by this input and Logstash will convert it into an event for subsequent processing. Sample definition:
input {
  http {
    host => "0.0.0.0"
    port => "8080"
  }
}
Events are by default sent in plain text. You can enable encryption by setting ssl to true and configuring the ssl_certificate and ssl_key options:
input {
  http {
    host => "0.0.0.0"
    port => "8080"
    ssl => "true"
    ssl_certificate => "path_to_certificate_file"
    ssl_key => "path_to_key_file"
  }
}
Logstash - Input Relp
Installation
For plugins not bundled by default, it is easy to install by running bin/logstash-plugin install logstash-input-relp.
Description
Read RELP events over a TCP socket.
This protocol implements application-level acknowledgments to help protect against message loss.
Message acks only function as far as messages being put into the queue for filters; anything lost after that point will not be retransmitted.
Relp input configuration options
This plugin supports the following configuration options plus the Common Options described later.
| Nr. | Setting | Input type | Required |
|---|---|---|---|
| 1 | host | string | No |
| 2 | port | number | Yes |
| 3 | ssl_cacert | a valid filesystem path | No |
| 4 | ssl_cert | a valid filesystem path | No |
| 5 | ssl_enable | boolean | No |
| 6 | ssl_key | a valid filesystem path | No |
| 7 | ssl_key_passphrase | password | No |
| 8 | ssl_verify | string | boolean |
host - The address to listen on.
port - The port to listen on.
ssl_cacert - The SSL CA certificate, chainfile or CA path. The system CA path is automatically included.
ssl_cert - SSL certificate path
ssl_enable - Enable SSL (must be set for other ssl_ options to take effect).
ssl_key - SSL key path
ssl_key_passphrase - SSL key passphrase
ssl_verify - Verify the identity of the other end of the SSL connection against the CA. For input, sets the field sslsubject to that of the client certificate.
Common Options The following configuration options are supported by all input plugins:
| Nr. | Setting | Input type | Required |
|---|---|---|---|
1 |
add_field |
hash |
No |
2 |
codec |
codec |
No |
3 |
enable_metric |
boolean |
No |
4 |
id |
string |
No |
5 |
tags |
array |
No |
6 |
type |
string |
No |
add_field - Add a field to an event
codec - The codec used for input data. Input codecs are a convenient method for decoding your data before it enters the input, without needing a separate filter in your Logstash pipeline.
enable_metric - Disable or enable metric logging for this specific plugin instance by default we record all the metrics we can, but you can disable metrics collection for a specific plugin.
id - Add a unique ID to the plugin configuration. If no ID is specified, Logstash will generate one. It is strongly recommended to set this ID in your configuration. This is particularly useful when you have two or more plugins of the same type, for example, if you have 2 relp inputs. Adding a named ID in this case will help in monitoring Logstash when using the monitoring APIs.
input {
  relp {
    id => "my_plugin_id"
  }
}
tags - add any number of arbitrary tags to your event.
type - Add a type field to all events handled by this input.
Types are used mainly for filter activation.
The type is stored as part of the event itself, so you can also use the type to search for it in Kibana.
If you try to set a type on an event that already has one (for example when you send an event from a shipper to an indexer) then a new input will not override the existing type. A type set at the shipper stays with that event for its life even when sent to another Logstash server.
Logstash - Input Kafka
This input will read events from a Kafka topic.
Sample definition:
input {
  kafka {
    bootstrap_servers => "10.0.0.1:9092"
    consumer_threads => 3

    topics => ["example"]
    codec => json
    client_id => "hostname"
    group_id => "logstash"
    max_partition_fetch_bytes => "30000000"
    max_poll_records => "1000"

    fetch_max_bytes => "72428800"
    fetch_min_bytes => "1000000"

    fetch_max_wait_ms => "800"

    check_crcs => false

  }
}
bootstrap_servers - A list of URLs of Kafka instances to use for establishing the initial connection to the cluster. This list should be in the form of host1:port1,host2:port2 These urls are just used for the initial connection to discover the full cluster membership (which may change dynamically) so this list need not contain the full set of servers (you may want more than one, though, in case a server is down).
consumer_threads - Ideally you should have as many threads as the number of partitions for a perfect balance — more threads than partitions means that some threads will be idle
topics - A list of topics to subscribe to, defaults to [”logstash”].
codec - The codec used for input data. Input codecs are a convenient method for decoding your data before it enters the input, without needing a separate filter in your Logstash pipeline.
client_id - The id string to pass to the server when making requests. The purpose of this is to be able to track the source of requests beyond just ip/port by allowing a logical application name to be included.
group_id - The identifier of the group this consumer belongs to. Consumer group is a single logical subscriber that happens to be made up of multiple processors. Messages in a topic will be distributed to all Logstash instances with the same group_id.
max_partition_fetch_bytes - The maximum amount of data per-partition the server will return. The maximum total memory used for a request will be #partitions * max.partition.fetch.bytes. This size must be at least as large as the maximum message size the server allows or else it is possible for the producer to send messages larger than the consumer can fetch. If that happens, the consumer can get stuck trying to fetch a large message on a certain partition.
max_poll_records - The maximum number of records returned in a single call to poll().
fetch_max_bytes - The maximum amount of data the server should return for a fetch request. This is not an absolute maximum, if the first message in the first non-empty partition of the fetch is larger than this value, the message will still be returned to ensure that the consumer can make progress.
fetch_min_bytes - The minimum amount of data the server should return for a fetch request. If insufficient data is available the request will wait for that much data to accumulate before answering the request.
fetch_max_wait_ms - The maximum amount of time the server will block before answering the fetch request if there isn’t sufficient data to immediately satisfy fetch_min_bytes. This should be less than or equal to the timeout used in poll_timeout_ms.
check_crcs - Automatically check the CRC32 of the records consumed. This ensures no on-the-wire or on-disk corruption to the messages occurred. This check adds some overhead, so it may be disabled in cases seeking extreme performance.
Logstash - Input File
This plugin stream events from files, normally by tailing them in a manner similar to tail -0F but optionally reading them from the beginning. Sample definition:
file {
    path => "/tmp/access_log"
    start_position => "beginning"
}
Logstash - Input database
This plugin can read data in any database with a JDBC interface into Logstash. You can periodically schedule ingestion using a cron syntax (see schedule setting) or run the query one time to load data into Logstash. Each row in the resultset becomes a single event. Columns in the resultset are converted into fields in the event.
Logasth input - MySQL
Download jdbc driver: https://dev.mysql.com/downloads/connector/j/
Sample definition:
input {
  jdbc {
    jdbc_driver_library => "mysql-connector-java-5.1.36-bin.jar"
    jdbc_driver_class => "com.mysql.jdbc.Driver"
    jdbc_connection_string => "jdbc:mysql://localhost:3306/mydb"
    jdbc_user => "mysql"
    jdbc_password => "mysql"
    parameters => { "favorite_artist" => "Beethoven" }
    schedule => "* * * * *"
    statement => "SELECT * from songs where artist = :favorite_artist"
  }
}
Logasth input - MSSQL
Download jdbc driver: https://docs.microsoft.com/en-us/sql/connect/jdbc/download-microsoft-jdbc-driver-for-sql-server?view=sql-server-ver15
Sample definition:
input {
  jdbc {
    jdbc_driver_library => "./mssql-jdbc-6.2.2.jre8.jar"
    jdbc_driver_class => "com.microsoft.sqlserver.jdbc.SQLServerDriver"
    jdbc_connection_string => "jdbc:sqlserver://VB201001000;databaseName=Database;"
    jdbc_user => "mssql"
    jdbc_password => "mssql"
    jdbc_default_timezone => "UTC"
    statement_filepath => "/usr/share/logstash/plugin/query"
    schedule => "*/5 * * * *"
    sql_log_level => "warn"
    record_last_run => "false"
    clean_run => "true"
  }
}
Logstash input - Oracle
Download jdbc driver: https://www.oracle.com/database/technologies/appdev/jdbc-downloads.html
Sample definition:
input {
  jdbc {
    jdbc_driver_library => "./ojdbc8.jar"
    jdbc_driver_class => "oracle.jdbc.driver.OracleDriver"
    jdbc_connection_string => "jdbc:oracle:thin:@hostname:PORT/SERVICE"
    jdbc_user => "oracle"
    jdbc_password => "oracle"
    parameters => { "favorite_artist" => "Beethoven" }
    schedule => "* * * * *"
    statement => "SELECT * from songs where artist = :favorite_artist"
  }
}
Logstash input - PostgreSQL
Download jdbc driver: https://jdbc.postgresql.org/download.html
Sample definition:
input {
    jdbc {
        jdbc_driver_library => "D:/postgresql-42.2.5.jar"
        jdbc_driver_class => "org.postgresql.Driver"
        jdbc_connection_string => "jdbc:postgresql://127.0.0.1:57610/mydb"
        jdbc_user => "myuser"
        jdbc_password => "mypw"
        statement => "select * from mytable"
    }
}
Logstash - Input CEF
The common event format (CEF) is a standard for the interoperability of event or log generating devices and applications. The standard defines a syntax for log records. It comprises of a standard prefix and a variable extension that is formatted as key-value pairs.
input {
  tcp {
    codec => cef { delimiter => "\r\n" }
    port => 12345
  }
}
This setting allows the following character sequences to have special meaning:
\r(backslash “r”) - means carriage return (ASCII 0x0D)\n(backslash “n”) - means newline (ASCII 0x0A)
Logstash - Input OPSEC
FW1-LogGrabber is a Linux command-line tool to grab logfiles from remote Checkpoint devices. It makes extensive use of OPSEC Log Export APIs (LEA) from Checkpoint’s OPSEC SDK 6.0 for Linux 50.
Build FW1-LogGrabber
FW1-LogGrabber v2.0 and above can be built on Linux x86/amd64 platforms only.
If you are interested in other platforms please check FW1-LogGrabber v1.11.1 website
Download dependencies
FW1-LogGrabber uses API-functions from Checkpoint’s OPSEC SDK 6.0 for Linux 50.
You must take care of downloading the Checkpoint OPSEC SDK and extracting it inside the OPSEC_SDK folder.
You also need to install some required 32-bit libraries.
If you are using Debian or Ubuntu, please run:
sudo apt-get install gcc-multilib g++-multilib libelf-dev:i386 libpam0g:i386 zlib1g-dev:i386
If you are using CentOS or RHEL, please run:
sudo yum install gcc gcc-c++ make glibc-devel.i686 elfutils-libelf-devel.i686 zlib-devel.i686 libstdc++-devel.i686 pam-devel.i686
Compile source code
Building should be as simple as running GNU Make in the project root folder:
make
If the build process complains, you might need to tweak some variables inside the Makefile (e.g. CC, LD and OPSEC_PKG_DIR) according to your environment.
Install FW1-LogGrabber
To install FW1-LogGrabber into its default location /usr/local/fw1-loggrabber (defined by INSTALL_DIR variable), please run
sudo make install
Set environment variables
FW1-LogGraber makes use of two environment variables, which should be defined in the shell configuration files.
LOGGRABBER_CONFIG_PATHdefines a directory containing configuration files (fw1-loggrabber.conf,lea.conf). If the variable is not defined, the program expects to find these files in the current directory.LOGGRABBER_TEMP_PATHdefines a directory where FW1-LogGrabber will store temporary files. If the variable is not defined, the program stores these files in the current directory.
Since the binary is dynamically linked to Checkpoint OPSEC libraries, please also add /usr/local/fw1-loggrabber/lib to LD_LIBRARY_PATH or to your dynamic linker configuration with
sudo echo /usr/local/fw1-loggrabber/lib > /etc/ld.so.conf.d/fw1-loggrabber.conf
sudo ldconfig
Configuration files
lea.conf file
Starting with version 1.11, FW1-LogGrabber uses the default connection configuration procedure for OPSEC applications. This includes server, port and authentication settings. From now on, all this parameters can only be configured using the configuration file lea.conf (see --leaconfigfile option to use a different LEA configuration file) and not using the command-line as before.
lea_server ip <IP address>specifies the IP address of the FW1 management station, to which FW1-LogGrabber should connect to.lea_server port <port number>is the port on the FW1 management station to which FW1-LogGrabber should connect to (for unauthenticated connections only).lea_server auth_port <port number>is the port to be used for authenticated connection to your FW1 management station.lea_server auth_type <authentication mechanism>you can use this parameter to specify the authentication mechanism to be used (default issslca); valid values aresslca,sslca_clear,sslca_comp,sslca_rc4,sslca_rc4_comp,asym_sslca,asym_sslca_comp,asym_sslca_rc4,asym_sslca_rc4_comp,ssl,ssl_opsec,ssl_clear,ssl_clear_opsec,fwn1andauth_opsec.opsec_sslca_file <p12-file>specify the location of the PKCS#12 certificate, when using authenticated connections.opsec_sic_name <LEA client SIC name>is the SIC name of the LEA client for authenticated connections.lea_server opsec_entity_sic_name <LEA server SIC name>is the SIC name of your FW1 management station when using authenticated connections.
fw1-loggrabber.conf file
This paragraph deals with the options that can be set within the configuration file. The default configuration file is fw1-loggrabber.conf (see --configfile option to use a different configuration file). The precedence of given options is as follows: command line, configuration file, default value. E.g. if you set the resolve-mode to be used in the configuration file, this can be overwritten by command line option --noresolve; only if an option isn’t set neither on command line nor in the configuration file, the default value will be used.
DEBUG_LEVEL=<0-3>sets the debug level to the specified value; zero means no output of debug information, and further levels will cause output of program specific as well as OPSEC specific debug information.FW1_LOGFILE=<name of log file>specifies the name of the FW1 logfile to be read; this can be either done exactly or using only a part of the filename; if no exact match can be found in the list of logfiles returned by the FW-1 management station, all logfiles which contain the specified string are processed; if this parameter is omitted, the default logfilefw.logwill be processed.FW1_OUTPUT=<files|logs>specifies whether FW1-LogGrabber should only display the available logfiles (files) on the FW11 server or display the content of these logfiles (logs).FW1_TYPE=<ng|2000>choose which version of FW1 to connect to; for Checkpoint FW-1 5.0 you have to specifyNGand for Checkpoint FW-1 4.1 you have to specify2000.FW1_MODE=<audit|normal>specifies whether to displayauditlogs, which contain administrative actions, ornormalsecurity logs, which contain data about dropped and accepted connections.MODE=<online|online-resume|offline>when using online mode, FW1-LogGrabber starts retrieving logging data from the end of the specified logfile and displays all future log entries (mainly used for continuously processing); the online-resume mode is similar to the online mode, but if FW1-LogGrabber is stopped and started again, it resumes processing from where it was stopped; if you instead choose the offline mode, FW1-LogGrabber quits after having displayed the last log entry.RESOLVE_MODE=<yes|no>with this option (enabled by default), IP addresses will be resolved to names using FW1 name resolving behaviour; this resolving mechanism will not cause the machine running FW1-LogGrabber to initiate DNS requests, but the name resolution will be done directly on the FW1 machine; if you disable resolving mode, IP addresses will be displayed in log output instead of names.RECORD_SEPARATOR=<char>can be used to change the default record separator|(pipe) into another character; if you choose a character which is contained in some log data, the occurrence within the logdata will be escaped by a backslash.LOGGING_CONFIGURATION=<screen|file|syslog>can be used for redirecting logging output to other destinations than the default destinationSTDOUT; currently it is possible to redirect output to a file or to the syslog daemon.OUTPUT_FILE_PREFIX=<prefix of output file>when using file output, this parameter defines a prefix for the output filename; default value is simplyfw1-loggrabber.OUTPUT_FILE_ROTATESIZE=<rotatesize in bytes>when using file output, this parameter specifies the maximum size of the output files, before they will be rotated with suffix-YYYY-MM-DD-hhmmss[-x].log; default value is 1048576 bytes, which equals 1 MB; setting a zero value disables file rotation.SYSLOG_FACILITY=<USER|LOCAL0|...|LOCAL7>when using syslog output, this parameter sets the syslog facility to be used.FW1_FILTER_RULE="<filterexpression1>[;<filterexpression2>]"defines filters fornormallog mode; you can find a more detailed description of filter rules, along with some examples, in a separate chapter below.AUDIT_FILTER_RULE="<filterexpression1>[;<filterexpression2>]"defines filters forauditlog mode; you can find a more detailed description of filter rules, along with some examples, in a separate chapter below.
Command line options
In the following section, all available command line options are described in detail. Most of the options can also be configured using the file fw1-loggrabber.conf (see --configfile option to use a different configuration file). The precedence of given options is as follows: command line, configuration file, default value. E.g. if you set the resolve-mode to be used in the configuration file, this can be overwritten by command line option --noresolve; only if an option isn’t set neither on command line nor in the configuration file, the default value will be used.
Help
Use --help to display basic help and usage information.
Debug level
The --debuglevel option sets the debug level to the specified value. A zero debug level means no output of debug information, while further levels will cause output of program specific as well as OPSEC specific debug
information.
Location of configuration files
The -c <configfilename> or --configfile <configfilename> options allow to specify a non-default configuration file, in which most of the command line options can be configured, as well as other options which are not available as command line parameters.
If this parameter is omitted, the file fw1-loggrabber.conf inside $LOGGRABBER_CONFIG_PATH will be used. See above for a description of all available configuration file options.
Using -l <leaconfigfilename> or --leaconfigfile <leaconfigfilename> instead, it’s possible to use a non-default LEA configuration file. In this file, all connection parameters such as FW1 server, port, authentication method as well as SIC names have to be configured, as usual procedure for OPSEC applications.
If this parameter is omitted, the file lea.conf inside $LOGGRABBER_CONFIG_PATH will be used. See above for a description of all available LEA configuration file options.
Remote log files
With -f <logfilename|pattern|ALL> or --logfile <logfilename|pattern|ALL> you can specify the name of the remote FW1 logfile to be read.
This can be either done exactly or using only a part of the filename. If no exact match can be found in the list of logfiles returned by the FW1 management station, all logfiles which contain the specified string are processed.
A special case is the usage of ALL instead of a logfile name or pattern. In that case all logfiles that are available on the management station, will be processed. If this parameter is omitted, only the default logfile fw.log will be processed.
The first example displays the logfile 2003-03-27_213652.log, while the second one processes all logfiles which contain 2003-03 in their filename.
--logfile 2003-03-27_213652.log
--logfile 2003-03
The default behaviour of FW1-LogGrabber is to display the content of the logfiles and not just their names. This can be explicitely specified using the --showlogs option.
The option --showfiles can be used instead to simply show the available logfiles on the FW1 management station. After the names of the logfiles have been displayed, FW1-LogGrabber quits.
Name resolving behaviour
Using the --resolve option, IP addresses will be resolved to names using FW1 name resolving behaviour. This resolving mechanism will not cause the machine running FW1-LogGrabber to initiate DNS requests, but the name resolution will be done directly on the FW1 machine.
This is the default behavior of FW1-LogGrabber which can be disabled by using --no-resolve. That option will cause IP addresses to be displayed in log output instead of names.
Checkpoint firewall version
The default FW1 version, for which this tool is being developed, is Checkpoint FW1 5.0 (NG) and above. If no other version is explicitly specified, the default version is --ng.
The option --2000 has to be used if you want to connect to older Checkpoint FW1 4.1 (2000) firewalls. You should keep in mind that some options are not available for non-NG firewalls; these include --auth, --showfiles, --auditlog and some more.
Online and Online-Resume modes
Using --online mode, FW1-LogGrabber starts output of logging data at the end of the specified logfile (or fw.log if no logfile name has been specified). This mode is mainly used for continuously processing FW1 log data and continues to display log entries also after scheduled and manual log switches. If you use --logfile to specify another logfile to be processed, you have to consider that no data will be shown, if the file isn’t active anymore.
The --online-resume mode is similar to the above online mode, but starts output of logging data at the last known processed position (which is stored inside a cursor).
In contrast to online mode, when using --offline mode FW1-LogGrabber quits after having displayed the last log entry. This is the default behavior and is mainly used for analysis of historic log data.
Audit and normal logs
Using the --auditlog mode, the content of the audit logfile (fw.adtlog) can be displayed. This includes administrator actions and uses different fields than normal log data.
The default --normallog mode of FW1-LogGrabber processes normal FW1 logfiles. In contrast to the --auditlog option, no administrative actions are displayed in this mode, but all regular log data is.
Filtering
Filter rules provide the possibility to display only log entries that match a given set of rules. There can be specified one or more filter rules using one or multiple --filter arguments on the command line.
All individual filter rules are related by OR. That means a log entry will be displayed if at least one of the filter rules matches. You can specify multiple argument values by separating the values by , (comma).
Within one filter rule, there can be specified multiple arguments that have to be separated by ; (semi-colon). All these arguments are related by AND. That means a filter rule matches a given log entry only, if all of the filter arguments match.
If you specify != instead of = between the name and value of the filter argument, you can negate the name/value pair.
For arguments that expect IP addresses, you can specify either a single IP address, multiple IP addresses separated by , (comma), or a network address with netmask (e.g. 10.0.0.0/255.0.0.0). Currently, it is not possible to specify a network address and a single IP address within the same filter argument.
Supported filter arguments
Normal mode:
action=<ctl|accept|drop|reject|encrypt|decrypt|keyinst>
dst=<IP address>
endtime=<YYYYMMDDhhmmss>
orig=<IP address>
product=<VPN-1 & FireWall-1|SmartDefense>
proto=<icmp|tcp|udp>
rule=<rulenumber|startrule-endrule>
service=<portnumber|startport-endport>
src=<IP address>
starttime=<YYYYMMDDhhmmss>
Audit mode:
action=<ctl|accept|drop|reject|encrypt|decrypt|keyinst>
administrator=<string>
endtime=<YYYYMMDDhhmmss>
orig=<IP address>
product=<SmartDashboard|Policy Editor|SmartView Tracker|SmartView Status|SmartView Monitor|System Monitor|cpstat_monitor|SmartUpdate|CPMI Client>
starttime=<YYYYMMDDhhmmss>
Example filters
Display all dropped connections:
--filter "action=drop"
Display all dropped and rejected connections:
--filter "action=drop,reject"
--filter "action!=accept"
Display all log entries generated by rules 20 to 23:
--filter "rule=20,21,22,23"
--filter "rule=20-23"
Display all log entries generated by rules 20 to 23, 30 or 40 to 42:
--filter "rule=20-23,30,40-42"
Display all log entries to 10.1.1.1 and 10.1.1.2:
--filter "dst=10.1.1.1,10.1.1.2"
Display all log entries from 192.168.1.0/255.255.255.0:
--filter "src=192.168.1.0/255.255.255.0"
Display all log entries starting from 2004/03/02 14:00:00:
--filter "starttime=20040302140000"
Checkpoint device configuration
Modify $FWDIR/conf/fwopsec.conf and define the port to be used for authenticated LEA connections (e.g. 18184):
lea_server port 0
lea_server auth_port 18184
lea_server auth_type sslca
Restart in order to activate changes:
cpstop; cpstart
Create a new OPSEC Application Object with the following details:
Name: e.g. myleaclient
Vendor: User Defined
Server Entities: None
Client Entities: LEA
Initialize Secure Internal Communication (SIC) for recently created OPSEC Application Object and enter (and remember) the activation key (e.g. def456).
Write down the DN of the recently created OPSEC Application Object; this is your Client Distinguished Name, which you need later on.
Open the object of your FW1 management server and write down the DN of that object; this is the Server Distinguished Name, which you will need later on.
Add a rule to the policy to allow the port defined above as well as port 18210/tcp (FW1_ica_pull) in order to allow pulling of PKCS#12 certificate by the FW1-LogGrabber machine from the FW1 management server. Port 18210/tcp can be shut down after the communication between FW1-LogGrabber and the FW1 management server has been established successfully.
Finally, install the policy.
FW1-LogGrabber configuration
Modify $LOGGRABBER_CONFIG_PATH/lea.conf and define the IP address of your FW1 management station (e.g. 10.1.1.1) as well as port (e.g. 18184), authentication type and SIC names for authenticated LEA
connections. You can get the SIC names from the object properties of your LEA client object, respectively the
Management Station object (see above for details about Client DN and Server DN).
lea_server ip 10.1.1.1
lea_server auth_port 18184
lea_server auth_type sslca
opsec_sslca_file opsec.p12
opsec_sic_name "CN=myleaclient,O=cpmodule..gysidy"
lea_server opsec_entity_sic_name "cn=cp_mgmt,o=cpmodule..gysidy"
Get the tool opsec_pull_cert either from opsec-tools.tar.gz from the project home page or directly from the OPSEC SDK. This tool is needed to establish the Secure Internal Communication (SIC) between FW1-LogGrabber and the FW1 management server.
Get the clients certificate from the management station (e.g. 10.1.1.1). The activation key has to be the same as specified before in the firewall policy. After that, copy the resulting PKCS#12 file (default name opsec.p12) to your FW1-LogGrabber directory.
opsec_pull_cert -h 10.1.1.1 -n myleaclient -p def456
Authenticated SSL OPSEC connections
Checkpoint device configuration
Modify $FWDIR/conf/fwopsec.conf and define the port to be used for authenticated LEA connections (e.g. 18184):
lea_server port 0
lea_server auth_port 18184
lea_server auth_type ssl_opsec
Restart in order to activate changes:
cpstop; cpstart
Set a password (e.g. abc123) for the LEA client (e.g. 10.1.1.2):
fw putkey -ssl -p abc123 10.1.1.2
Create a new OPSEC Application Object with the following details:
Name: e.g. myleaclient
Vendor: User Defined
Server Entities: None
Client Entities: LEA
Initialize Secure Internal Communication (SIC) for recently created OPSEC Application Object and enter (and remember) the activation key (e.g. def456).
Write down the DN of the recently created OPSEC Application Object; this is your Client Distinguished Name, which you need later on.
Open the object of your FW1 management server and write down the DN of that object; this is the Server Distinguished Name, which you will need later on.
Add a rule to the policy to allow the port defined above as well as port 18210/tcp (FW1_ica_pull) in order to allow pulling of PKCS#12 certificate from the FW1-LogGrabber machine to the FW1 management server. The port 18210/tcp can be shut down after the communication between FW1-LogGrabber and the FW1 management server has been established successfully.
Finally, install the policy.
FW1-LogGrabber configuration
Modify $LOGGRABBER_CONFIG_PATH/lea.conf and define the IP address of your FW1 management station (e.g. 10.1.1.1) as well as port (e.g. 18184), authentication type and SIC names for authenticated LEA connections. The SIC names you can get from the object properties of your LEA client object respectively the Management Station object (see above for details about Client DN and Server DN).
lea_server ip 10.1.1.1
lea_server auth_port 18184
lea_server auth_type ssl_opsec
opsec_sslca_file opsec.p12
opsec_sic_name "CN=myleaclient,O=cpmodule..gysidy"
lea_server opsec_entity_sic_name "cn=cp_mgmt,o=cpmodule..gysidy"
Set password for the connection to the LEA server. The password has to be the same as specified on the LEA server.
opsec_putkey -ssl -p abc123 10.1.1.1
Get the tool opsec_pull_cert either from opsec-tools.tar.gz from the project home page or directly from the OPSEC SDK. This tool is needed to establish the Secure Internal Communication (SIC) between FW1-LogGrabber and the FW1 management server.
Get the clients certificate from the management station (e.g. 10.1.1.1). The activation key has to be the same as specified before in the firewall policy.
opsec_pull_cert -h 10.1.1.1 -n myleaclient -p def456
Authenticated OPSEC connections
Checkpoint device configuration
Modify $FWDIR/conf/fwopsec.conf and define the port to be used for authenticated LEA connections (e.g. 18184):
lea_server port 0
lea_server auth_port 18184
lea_server auth_type auth_opsec
Restart in order to activate changes
fwstop; fwstart
Set a password (e.g. abc123) for the LEA client (e.g. 10.1.1.2).
fw putkey -opsec -p abc123 10.1.1.2
Add a rule to the policy to allow the port defined above from the FW1-LogGrabber machine to the FW1 management server.
Finally, install the policy.
FW1-LogGrabber configuration
Modify $LOGGRABBER_CONFIG_PATH/lea.conf and define the IP address of your FW1 management station (e.g. 10.1.1.1) as well as the port (e.g. 18184) and authentication type for authenticated LEA connections:
lea_server ip 10.1.1.1
lea_server auth_port 18184
lea_server auth_type auth_opsec
Set password for the connection to the LEA server. The password has to be the same as specified on the LEA server.
opsec_putkey -p abc123 10.1.1.1
Unauthenticated connections
Checkpoint device configuration
Modify $FWDIR/conf/fwopsec.conf and define the port to be used for unauthenticated LEA connections (e.g. 50001):
lea_server port 50001
lea_server auth_port 0
Restart in order to activate changes:
fwstop; fwstart  # for 4.1
cpstop; cpstart  # for NG
Add a rule to the policy to allow the port defined above from the FW1-LogGrabber machine to the FW1 management server.
Finally, install the policy.
FW1-LogGrabber configuration
Modify $LOGGRABBER_CONFIG_PATH/lea.conf and define the IP address of your FW1 management station (e.g. 10.1.1.1) and port (e.g. 50001) for unauthenticated LEA connections:
lea_server ip 10.1.1.1
lea_server port 50001
Logstash - Input SDEE
This Logstash input plugin allows you to call a Cisco SDEE/CIDEE HTTP API, decode the output of it into event(s), and send them on their merry way. The idea behind this plugins came from a need to gather events from Cisco security devices and feed them to ELK stack
Download
Only support for Logstash core 5.6.4.
Download link: https://rubygems.org/gems/logstash-input-sdee
Installation
gem install logstash-input-sdee-0.7.8.gem
Configuration
You need to import host SSL certificate in Java trust store to be able to connect to Cisco IPS device.
Get server certificate from IPS device:
echo | openssl s_client -connect ciscoips:443 2>&1 | sed -ne '/-BEGIN CERTIFICATE-/,/-END CERTIFICATE-/p' > cert.pem
Import it into Java ca certs:
$JAVA_HOME/bin/keytool -keystore $JAVA_HOME/lib/security/cacerts -importcert -alias ciscoips -file cert.pem
Verify if import was successful:
$JAVA_HOME/bin/keytool -keystore $JAVA_HOME/lib/security/cacerts -list
Setup the Logstash input config with SSL connection:
input {
  sdee {
    interval => 60
    http => {
      truststore_password => "changeit"
      url => "https://10.0.2.1"
      auth => {
        user => "cisco"
        password => "p@ssw0rd"
      }
    }
  }
}
Logstash - Input XML
To download xml files via Logstash use input “file”, and set the location of the files in the configuration file:
file {
       path => [ "/etc/logstash/files/*.xml" ]
       mode => "read"
  }
The XML filter takes a field that contains XML and expands it into an actual datastructure.
filter {
      xml {
        source => "message"
      }
    }
More configuration options you can find: https://www.elastic.co/guide/en/logstash/6.8/plugins-filters-xml.html#plugins-filters-xml-options
Logstash - Input WMI
The Logstash input wmi allow to collect data from WMI query. This is useful for collecting performance metrics and other data which is accessible via WMI on a Windows host.
Installation
For plugins not bundled by default, it is easy to install by running:
/usr/share/logstash/bin/logstash-plugin install logstash-input-wmi
Configuration
Configuration example:
input {
      wmi {
        query => "select * from Win32_Process"
        interval => 10
      }
      wmi {
        query => "select PercentProcessorTime from Win32_PerfFormattedData_PerfOS_Processor where name = '_Total'"
      }
      wmi { # Connect to a remote host
        query => "select * from Win32_Process"
        host => "MyRemoteHost"
        user => "mydomain\myuser"
        password => "Password"
      }
    }
More about parameters: https://www.elastic.co/guide/en/logstash/6.8/plugins-inputs-wmi.html#plugins-inputs-wmi-options
Logstash - Filter “beats syslog”
This filter processing an event data with syslog type:
filter {
  if [type] == "syslog" {
    grok {
      match => {
        "message" => [
          # auth: ssh|sudo|su

          "%{SYSLOGTIMESTAMP:[system][auth][timestamp]} %{SYSLOGHOST:[system][auth][hostname]} sshd(?:\[%{POSINT:[system][auth][pid]}\])?: %{DATA:[system][auth][ssh][event]} %{DATA:[system][auth][ssh][method]} for (invalid user )?%{DATA:[system][auth][user]} from %{IPORHOST:[system][auth][ssh][ip]} port %{NUMBER:[system][auth][ssh][port]} ssh2(: %{GREEDYDATA:[system][auth][ssh][signature]})?",

          "%{SYSLOGTIMESTAMP:[system][auth][timestamp]} %{SYSLOGHOST:[system][auth][hostname]} sshd(?:\[%{POSINT:[system][auth][pid]}\])?: %{DATA:[system][auth][ssh][event]} user %{DATA:[system][auth][user]} from %{IPORHOST:[system][auth][ssh][ip]}",

          "%{SYSLOGTIMESTAMP:[system][auth][timestamp]} %{SYSLOGHOST:[system][auth][hostname]} sshd(?:\[%{POSINT:[system][auth][pid]}\])?: Did not receive identification string from %{IPORHOST:[system][auth][ssh][dropped_ip]}",

          "%{SYSLOGTIMESTAMP:[system][auth][timestamp]} %{SYSLOGHOST:[system][auth][hostname]} sudo(?:\[%{POSINT:[system][auth][pid]}\])?: \s*%{DATA:[system][auth][user]} :( %{DATA:[system][auth][sudo][error]} ;)? TTY=%{DATA:[system][auth][sudo][tty]} ; PWD=%{DATA:[system][auth][sudo][pwd]} ; USER=%{DATA:[system][auth][sudo][user]} ; COMMAND=%{GREEDYDATA:[system][auth][sudo][command]}",

          "%{SYSLOGTIMESTAMP:[system][auth][timestamp]} %{SYSLOGHOST:[system][auth][hostname]} %{DATA:[system][auth][program]}(?:\[%{POSINT:[system][auth][pid]}\])?: %{GREEDYMULTILINE:[system][auth][message]}",

          # add/remove user or group
          "%{SYSLOGTIMESTAMP:[system][auth][timestamp]} %{SYSLOGHOST:[system][auth][hostname]} groupadd(?:\[%{POSINT:[system][auth][pid]}\])?: new group: name=%{DATA:system.auth.groupadd.name}, GID=%{NUMBER:system.auth.groupadd.gid}",

          "%{SYSLOGTIMESTAMP:[system][auth][timestamp]} %{SYSLOGHOST:[system][auth][hostname]} userdel(?:\[%{POSINT:[system][auth][pid]}\])?: removed group '%{DATA:[system][auth][groupdel][name]}' owned by '%{DATA:[system][auth][group][owner]}'",

          "%{SYSLOGTIMESTAMP:[system][auth][timestamp]} %{SYSLOGHOST:[system][auth][hostname]} useradd(?:\[%{POSINT:[system][auth][pid]}\])?: new user: name=%{DATA:[system][auth][user][add][name]}, UID=%{NUMBER:[system][auth][user][add][uid]}, GID=%{NUMBER:[system][auth][user][add][gid]}, home=%{DATA:[system][auth][user][add][home]}, shell=%{DATA:[system][auth][user][add][shell]}$",

          "%{SYSLOGTIMESTAMP:[system][auth][timestamp]} %{SYSLOGHOST:[system][auth][hostname]} userdel(?:\[%{POSINT:[system][auth][pid]}\])?: delete user '%{WORD:[system][auth][user][del][name]}'$",

          "%{SYSLOGTIMESTAMP:[system][auth][timestamp]} %{SYSLOGHOST:[system][auth][hostname]} usermod(?:\[%{POSINT:[system][auth][pid]}\])?: add '%{WORD:[system][auth][user][name]}' to group '%{WORD:[system][auth][user][memberof]}'",

          # yum install/erase/update package
         "%{SYSLOGTIMESTAMP:[system][auth][timestamp]} %{DATA:[system][package][action]}: %{NOTSPACE:[system][package][name]}"
        ]
      }
      pattern_definitions => {
        "GREEDYMULTILINE"=> "(.|\n)*"
      }
    }

    date {
      match => [ "[system][auth][timestamp]", "MMM  d HH:mm:ss", "MMM dd HH:mm:ss" ]
      target => "[system][auth][timestamp]"
    }

    mutate {
      convert => { "[system][auth][pid]" => "integer" }
      convert => { "[system][auth][groupadd][gid]" => "integer" }
      convert => { "[system][auth][user][add][uid]" => "integer" }
      convert => { "[system][auth][user][add][gid]" => "integer" }
    }
  }
}
Logstash - Filter “network”
This filter processing event data with network type:
filter {
  if [type] == "network" {
    grok {
      named_captures_only => true
      match => {
        "message" => [

          # Cisco Firewall
          "%{SYSLOG5424PRI}%{NUMBER:log_sequence#}:%{SPACE}%{IPORHOST:device_ip}: (?:.)?%{CISCOTIMESTAMP:log_data} CET: %%{CISCO_REASON:facility}-%{INT:severity_level}-%{CISCO_REASON:facility_mnemonic}:%{SPACE}%{GREEDYDATA:event_message}",

          # Cisco Routers
          "%{SYSLOG5424PRI}%{NUMBER:log_sequence#}:%{SPACE}%{IPORHOST:device_ip}: (?:.)?%{CISCOTIMESTAMP:log_data} CET: %%{CISCO_REASON:facility}-%{INT:severity_level}-%{CISCO_REASON:facility_mnemonic}:%{SPACE}%{GREEDYDATA:event_message}",

          # Cisco Switches
          "%{SYSLOG5424PRI}%{NUMBER:log_sequence#}:%{SPACE}%{IPORHOST:device_ip}: (?:.)?%{CISCOTIMESTAMP:log_data} CET: %%{CISCO_REASON:facility}-%{INT:severity_level}-%{CISCO_REASON:facility_mnemonic}:%{SPACE}%{GREEDYDATA:event_message}",
          "%{SYSLOG5424PRI}%{NUMBER:log_sequence#}:%{SPACE}(?:.)?%{CISCOTIMESTAMP:log_data} CET: %%{CISCO_REASON:facility}-%{INT:severity_level}-%{CISCO_REASON:facility_mnemonic}:%{SPACE}%{GREEDYDATA:event_message}",

          # HP switches
          "%{SYSLOG5424PRI}%{SPACE}%{CISCOTIMESTAMP:log_data} %{IPORHOST:device_ip} %{CISCO_REASON:facility}:%{SPACE}%{GREEDYDATA:event_message}"
        ]

      }
    }

    syslog_pri { }

    if [severity_level] {
      translate {
        dictionary_path => "/etc/logstash/dictionaries/cisco_syslog_severity.yml"
        field => "severity_level"
        destination => "severity_level_descr"
      }
    }

    if [facility] {
      translate {
        dictionary_path => "/etc/logstash/dictionaries/cisco_syslog_facility.yml"
        field => "facility"
        destination => "facility_full_descr"
      }
    }

    #ACL
    if [event_message] =~ /(\d+.\d+.\d+.\d+)/ {
      grok {
        match => {
          "event_message" => [
            "list %{NOTSPACE:[acl][name]} %{WORD:[acl][action]} %{WORD:[acl][proto]} %{IP:[src][ip]}.*%{IP:[dst][ip]}",
            "list %{NOTSPACE:[acl][name]} %{WORD:[acl][action]} %{IP:[src][ip]}",
            "^list %{NOTSPACE:[acl][name]} %{WORD:[acl][action]} %{WORD:[acl][proto]} %{IP:[src][ip]}.*%{IP:[dst][ip]}"
          ]
        }
      }
    }

    if [src][ip] {

      cidr {
        address => [ "%{[src][ip]}" ]
        network => [ "0.0.0.0/32", "10.0.0.0/8", "172.16.0.0/12", "192.168.0.0/16", "fc00::/7", "127.0.0.0/8", "::1/128", "169.254.0.0/16", "fe80::/10","224.0.0.0/4", "ff00::/8","255.255.255.255/32"  ]
        add_field => { "[src][locality]" => "private" }
      }

      if ![src][locality] {
        mutate {
          add_field => { "[src][locality]" => "public" }
        }
      }
    }


    if [dst][ip] {
      cidr {
        address => [ "%{[dst][ip]}" ]
        network => [ "0.0.0.0/32", "10.0.0.0/8", "172.16.0.0/12", "192.168.0.0/16", "fc00::/7", "127.0.0.0/8", "::1/128", "169.254.0.0/16", "fe80::/10","224.0.0.0/4", "ff00::/8","255.255.255.255/32" ]
        add_field => { "[dst][locality]" => "private" }
      }

      if ![dst][locality] {
        mutate {
          add_field => { "[dst][locality]" => "public" }
        }
      }
    }

    # date format
    date {
      match => [ "log_data", "MMM dd HH:mm:ss", "MMM  dd HH:mm:ss","MMM dd HH:mm:ss.SSS", "MMM  dd HH:mm:ss.SSS", "ISO8601" ]
      target => "log_data"
    }

  }
}
Logstash - Filter “geoip”
This filter processing an events data with IP address and check localization:
filter {
  if [src][locality] == "public" {

    geoip {
      source => "[src][ip]"
      target => "[src][geoip]"
      database => "/etc/logstash/geoipdb/GeoLite2-City.mmdb"
      fields => [ "city_name", "country_name", "continent_code", "country_code2", "location" ]
      remove_field => [ "[src][geoip][ip]" ]
    }

    geoip {
      source => "[src][ip]"
      target => "[src][geoip]"
      database => "/etc/logstash/geoipdb/GeoLite2-ASN.mmdb"
      remove_field => [ "[src][geoip][ip]" ]
    }

  }

  if [dst][locality] == "public" {

    geoip {
      source => "[dst][ip]"
      target => "[dst][geoip]"
      database => "/etc/logstash/geoipdb/GeoLite2-City.mmdb"
      fields => [ "city_name", "country_name", "continent_code", "country_code2", "location" ]
      remove_field =>  [ "[dst][geoip][ip]" ]
    }

    geoip {
      source => "[dst][ip]"
      target => "[dst][geoip]"
      database => "/etc/logstash/geoipdb/GeoLite2-ASN.mmdb"
      remove_field => [ "[dst][geoip][ip]" ]
    }
  }

}
Logstash - avoiding duplicate documents
To avoid duplicating the same documents, e.g. if the collector receives the entire event log file on restart, prepare the Logstash filter as follows:
Use the fingerprint Logstash filter to create consistent hashes of one or more fields whose values are unique for the document and store the result in a new field, for example:
fingerprint {
                        source => [ "log_name", "record_number" ]
                        target => "generated_id"
                        method => "SHA1"
                }
- source - The name(s) of the source field(s) whose contents will be used to create the fingerprint
- target - The name of the field where the generated fingerprint will be stored. Any current contents of that field will be overwritten.
- method - If set to
SHA1,SHA256,SHA384,SHA512, orMD5and a key is set, the cryptographic hash function with the same name will be used to generate the fingerprint. When a key set, the keyed-hash (HMAC) digest function will be used.
In the elasticsearch output set the document_id as the value of the generated_id field:
elasticsearch {
                hosts => ["http://localhost:9200"]
                user => "logserver"
                password => "logserver"
                index => "syslog_wec-%{+YYYY.MM.dd}"
                document_id => "%{generated_id}"
        }
- document_id - The document ID for the index. Useful for overwriting existing entries in Elasticsearch with the same ID.
Documents having the same document_id will be indexed only once.
Logstash data enrichment
It is possible to enrich the events that go to the logstash filters with additional fields, the values of which come from the following sources:
- databases, using the
jdbcplugin; - Active Directory or OpenLdap, using the
logstash-filter-ldapplugin; - dictionary files, using the
translateplugin; - external systems using their API, e.g. OP5 Monitor/Nagios
Filter jdbc
This filter executes a SQL query and store the result set in the field specified as target. It will cache the results locally in an LRU cache with expiry.
For example, you can load a row based on an id in the event:
filter {
  jdbc_streaming {
    jdbc_driver_library => "/path/to/mysql-connector-java-5.1.34-bin.jar"
    jdbc_driver_class => "com.mysql.jdbc.Driver"
    jdbc_connection_string => "jdbc:mysql://localhost:3306/mydatabase"
    jdbc_user => "me"
    jdbc_password => "secret"
    statement => "select * from WORLD.COUNTRY WHERE Code = :code"
    parameters => { "code" => "country_code"}
    target => "country_details"
  }
}
More about jdbc plugin parameters: https://www.elastic.co/guide/en/logstash/6.8/plugins-filters-jdbc_streaming.html
Filter logstash-filter-ldap
Download and installation
Configuration
The logstash-filter-ldap filter will add fields queried from a ldap server to the event. The fields will be stored in a variable called target, that you can modify in the configuration file.
If an error occurs during the process tha tags array of the event is updated with either:
- LDAP_ERROR tag: Problem while connecting to the server: bad host, port, username, password, or search_dn -> Check the error message and your configuration.
- LDAP_NOT_FOUND tag: Object wasn’t found.
If error logging is enabled a field called error will also be added to the event. It will contain more details about the problem.
Input event
{
    "@timestamp" => 2018-02-25T10:04:22.338Z,
    "@version" => "1",
    "myUid" => "u501565"
}
Logstash filter
filter {
  ldap {
    identifier_value => "%{myUid}"
    host => "my_ldap_server.com"
    ldap_port => "389"
    username => "<connect_username>"
    password => "<connect_password>"
    search_dn => "<user_search_pattern>"
  }
}
Output event
{
    "@timestamp" => 2018-02-25T10:04:22.338Z,
    "@version" => "1",
    "myUid" => "u501565",
    "ldap" => {
        "givenName" => "VALENTIN",
        "sn" => "BOURDIER"
    }
}
Parameters available
Here is a list of all parameters, with their default value, if any, and their description.
| Option name | Type | Required | Default value | Description | Example | | :——————-: | ——- | ——– | ————– | ———————————————————— | —————————————– | | identifier_value | string | yes | n/a | Identifier of the value to search. If identifier type is uid, then the value should be the uid to search for. | “123456” | | identifier_key | string | no | “uid” | Type of the identifier to search | “uid” | | identifier_type | string | no | “posixAccount” | Object class of the object to search | “person” | | search_dn | string | yes | n/a | Domain name in which search inside the ldap database (usually your userdn or groupdn) | “dc=example,dc=org” | | attributes | array | no | [] | List of attributes to get. If not set, all attributes available will be get | [’givenName’, ‘sn’] | | target | string | no | “ldap” | Name of the variable you want the result being stocked in | “myCustomVariableName” | | host | string | yes | n/a | LDAP server host adress | “ldapserveur.com” | | ldap_port | number | no | 389 | LDAP server port for non-ssl connection | 400 | | ldaps_port | number | no | 636 | LDAP server port for ssl connection | 401 | | use_ssl | boolean | no | false | Enable or not ssl connection for LDAP server. Set-up the good ldap(s)_port depending on that | true | | enable_error_logging | boolean | no | false | When there is a problem with the connection with the LDAP database, write reason in the event | true | | no_tag_on_failure | boolean | no | false | No tags are added when an error (wrong credentials, bad server, ..) occur | true | | username | string | no | n/a | Username to use for search in the database | “cn=SearchUser,ou=person,o=domain” | | password | string | no | n/a | Password of the account linked to previous username | “123456” | | use_cache | boolean | no | true | Choose to enable or not use of buffer | false | | cache_type | string | no | “memory” | Type of buffer to use. Currently, only one is available, “memory” buffer | “memory” | | cache_memory_duration | number | no | 300 | Cache duration (in s) before refreshing values of it | 3600 | | cache_memory_size | number | no | 20000 | Number of object max that the buffer can contains | 100 | | disk_cache_filepath | string | no | nil | Where the cache will periodically be dumped | “/tmp/my-memory-backup” | | disk_cache_schedule | string | no | 10m | Cron period of when the dump of the cache should occured. See here for the syntax. | “10m”, “1h”, “every day at five”, “3h10m” |
Buffer
Like all filters, this filter treat only 1 event at a time. This can lead to some slowing down of the pipeline speed due to the network round-trip time, and high network I/O.
A buffer can be set to mitigate this.
Currently, there is only one basic “memory” buffer.
You can enable / disable use of buffer with the option use_cache.
Memory Buffer
This buffer store data fetched from the LDAP server in RAM, and can be configured with two parameters:
- cache_memory_duration: duration (in s) before a cache entry is refreshed if hit.
- cache_memory_size: number of tuple (identifier, attributes) that the buffer can contains.
Older cache values than your TTL will be removed from cache.
Persistant cache buffer
For the only buffer for now, you will be able to save it to disk periodically.
Some specificities :
- for the memory cache, TTL will be reset
Two parameters are required:
- disk_cache_filepath: path on disk of this backup
- disk_cache_schedule: schedule (every X time unit) of this backup. Please check here for the syntax of this parameter.
Filter translate
A general search and replace tool that uses a configured hash and/or a file to determine replacement values. Currently supported are YAML, JSON, and CSV files. Each dictionary item is a key value pair.
You can specify dictionary entries in one of two ways:
- The dictionary configuration item can contain a hash representing the mapping.
filter {
      translate {
        field => "[http_status]"
        destination => "[http_status_description]"
        dictionary => {
          "100" => "Continue"
          "101" => "Switching Protocols"
          "200" => "OK"
          "500" => "Server Error"
        }
        fallback => "I'm a teapot"
      }
    }
- An external file (readable by logstash) may be specified in the
dictionary_pathconfiguration item:
filter {
  translate {
    dictionary_path => "/etc/logstash/lists/instance_cpu.yml"
    field => "InstanceType"
    destination => "InstanceCPUCount"
    refresh_behaviour => "replace"
  }
}
Sample dictionary file:
"c4.4xlarge": "16"
"c5.xlarge": "4"
"m1.medium": "1"
"m3.large": "2"
"m3.medium": "1"
"m4.2xlarge": "8"
"m4.large": "2"
"m4.xlarge": "4"
"m5a.xlarge": "4"
"m5d.xlarge": "4"
"m5.large": "2"
"m5.xlarge": "4"
"r3.2xlarge": "8"
"r3.xlarge": "4"
"r4.xlarge": "4"
"r5.2xlarge": "8"
"r5.xlarge": "4"
"t2.large": "2"
"t2.medium": "2"
"t2.micro": "1"
"t2.nano": "1"
"t2.small": "1"
"t2.xlarge": "4"
"t3.medium": "2"
External API
A simple filter that checks if an IP (from PublicIpAddress field) address exists in an external system. The result is written to the op5exists field. Then, using a grok filter, the number of occurrences is decoded and put into the op5count field.
ruby {
  code => '
    checkip = event.get("PublicIpAddress")
    output=`curl -s -k -u monitor:monitor "https://192.168.1.1/api/filter/count?query=%5Bhosts%5D%28address%20~~%20%22# {checkip}%22%20%29" 2>&1`
    event.set("op5exists", "#{output}")
  '
}
grok {
  match => { "op5exists" => [ ".*\:%{NUMBER:op5count}" ] }
}
Mathematical calculations
Using Logstash filters, you can perform mathematical calculations for field values and save the results to a new field.
Application example:
filter {
   ruby { code => 'event.set("someField", event.get("field1") + event.get("field2"))' }
}
Logstash - Output to Elasticsearch
This output plugin sends all data to the local Elasticsearch instance and create indexes:
output {
  elasticsearch {
    hosts => [ "127.0.0.1:9200" ]
    index => "%{type}-%{+YYYY.MM.dd}"
    user => "logstash"
    password => "logstash"
  }
}
Logstash plugin for “naemon beat”
This Logstash plugin has example of complete configuration for integration with naemon application:
input {
    beats {
        port => FILEBEAT_PORT
        type => "naemon"
    }
}

filter {
    if [type] == "naemon" {
        grok {
            patterns_dir => [ "/etc/logstash/patterns" ]
            match => { "message" => "%{NAEMONLOGLINE}" }
            remove_field => [ "message" ]
        }
        date {
            match => [ "naemon_epoch", "UNIX" ]
            target => "@timestamp"
            remove_field => [ "naemon_epoch" ]
        }
    }
}

output {
  # Single index
#    if [type] == "naemon" {
#        elasticsearch {
#            hosts => ["ELASTICSEARCH_HOST:ES_PORT"]
#            index => "naemon-%{+YYYY.MM.dd}"
#        }
#    }

  # Separate indexes
  if [type] == "naemon" {
    if "_grokparsefailure" in [tags] {
      elasticsearch {
        hosts => ["ELASTICSEARCH_HOST:ES_PORT"]
        index => "naemongrokfailure"
      }
    }
    else {
      elasticsearch {
        hosts => ["ELASTICSEARCH_HOST:ES_PORT"]
        index => "naemon-%{+YYYY.MM.dd}"
      }
    }
  }
}
Logstash plugin for “perflog”
This Logstash plugin has an example of a complete configuration for integration with perflog:
input {
  tcp {
    port => 6868
    host => "0.0.0.0"
    type => "perflogs"
  }
}

filter {
  if [type] == "perflogs" {
    grok {
      break_on_match => "true"
      match => {
        "message" => [
          "DATATYPE::%{WORD:datatype}\tTIMET::%{NUMBER:timestamp}\tHOSTNAME::%{DATA:hostname}\tSERVICEDESC::%{DATA:servicedescription}\tSERVICEPERFDATA::%{DATA:performance}\tSERVICECHECKCOMMAND::.*?HOSTSTATE::%{WORD:hoststate}\tHOSTSTATETYPE::.*?SERVICESTATE::%{WORD:servicestate}\tSERVICESTATETYPE::%{WORD:servicestatetype}",
          "DATATYPE::%{WORD:datatype}\tTIMET::%{NUMBER:timestamp}\tHOSTNAME::%{DATA:hostname}\tHOSTPERFDATA::%{DATA:performance}\tHOSTCHECKCOMMAND::.*?HOSTSTATE::%{WORD:hoststate}\tHOSTSTATETYPE::%{WORD:hoststatetype}"
        ]
      }
      remove_field => [ "message" ]
    }
    kv {
      source => "performance"
      field_split => "\t"
      remove_char_key => "\.\'"
      trim_key => " "
      target => "perf_data"
      remove_field => [ "performance" ]
      allow_duplicate_values => "false"
      transform_key => "lowercase"
    }
    date {
      match => [ "timestamp", "UNIX" ]
      target => "@timestamp"
      remove_field => [ "timestamp" ]
    }
  }
}

output {
  if [type] == "perflogs" {
    elasticsearch {
      hosts => ["127.0.0.1:9200"]
      index => "perflogs-%{+YYYY.MM.dd}"
    }
  }
}
Logstash plugin for LDAP data enrichement
Download logstash plugin with dependencies
logstash-filter-ldap-0.2.4.zip and upload files to your server.
Unzip file.
Install logstash plugin.
/usr/share/logstash/bin/logstash-plugin install /directory/to/file/logstash-filter-ldap-0.2.4.gemCreate new file in beats pipeline. To do this, go to beats folder (/etc/logstash/conf.d/beats) and create new config file, for example
031-filter-ldap-enrichement.confBelow is an example of the contents of the configuration file:
filter {
  ldap {
    identifier_value => "%{[winlog][event_data][TargetUserName]}"
    identifier_key => "sAMAccountName"
    identifier_type => "person"
    host => "10.0.0.1"
    ldap_port => "389"
    username => "user"
    password => "pass"
    search_dn => "OU=example,DC=example"
    enable_error_logging => true
    attributes => ['sAMAccountType','lastLogon','badPasswordTime']
  }
}
Fields description
identifier_value - Identifier of the value to search. If identifier type is uid, then the value should be the uid to search for.
identifier_key - Type of the identifier to search.
identifier_type - Object class of the object to search.
host - LDAP server host adress.
ldap_port - LDAP server port for non-ssl connection.
username - Username to use for search in the database.
password - Password of the account linked to previous username.
search_dn - Domain name in which search inside the ldap database (usually your userdn or groupdn).
enable_error_logging - When there is a problem with the connection with the LDAP database, write reason in the event.
attributes - List of attributes to get. If not set, all attributes available will be get.
Single password in all Logstash outputs
You can set passwords and other Logstash pipeline settings as environment variables. This can be useful if the password was changed for the logastash user and it must be to update in the configuration files.
Configuration steps:
Create the service file:
mkdir –p /etc/systemd/system/logstash.service.d
vi /etc/systemd/system/logstash.service.d/logstash.conf

[Service]
Environment="ELASTICSEARCH_ES_USER=logserver"
Environment="ELASTICSEARCH_ES_PASSWD=logserver"
Reload systemctl daemon:
systemctl daemon-reloadSample definition of Logstash output pipline seciotn:
output  {
  elasticsearch {
    index => "test-%{+YYYY.MM.dd}"
    user => "${ELASTICSEARCH_ES_USER:elastic}"
    password => "${ELASTICSEARCH_ES_PASSWD:changeme}"
  }
}
Multiline codec
The original goal of this codec was to allow joining of multiline messages from files into a single event. For example, joining Java exception and stacktrace messages into a single event.
    input {
      stdin {
        codec => multiline {
          pattern => "pattern, a regexp"
          negate => "true" or "false"
          what => "previous" or "next"
        }
      }
    }
    input {
      file {
        path => "/var/log/someapp.log"
        codec => multiline {
          # Grok pattern names are valid! :)
          pattern => "^%{TIMESTAMP_ISO8601} "
          negate => true
          what => "previous"
        }
      }
    }
SQL
Energy Logserver SQL lets you write queries in SQL rather than the Query domain-specific language (DSL)
SIEM Examples
Use SQL query to get security related data:
Example 1: Check number of failed login attemps
Query:
SELECT COUNT(sys.client.ip) AS failed_login_attempts FROM syslog-2024.02.23 sys
WHERE postfix_message = "SASL LOGIN authentication failed: UGFzc3dvcmQ6"
Result:
	failed_login_attempts
1	1329
Example 2: Gather host data from different sources in one place using JOIN
Query:
SELECT syslog.host.ip, syslog.host.name, zeek.server_addr, zeek.mac
FROM syslog-2024.02.23 syslog JOIN stream-zeek-2024.02.23 zeek ON zeek.server_addr = syslog.host.ip
Result:
	syslog.host.ip	syslog.host.name	zeek.server_addr	zeek.mac
	192.168.10.1	   example-hostname-1	192.168.10.1	bc:24:11:0g:f9:28
	192.168.10.1	   example-hostname-1	192.168.10.1	bc:24:11:0g:f9:28
	192.168.10.2	   example-hostname-2	192.168.10.2	bs:12:18:0g:f2:66
	192.168.10.1	   example-hostname-1	192.168.10.1	bc:24:11:0g:f9:28
	192.168.10.1	   example-hostname-1	192.168.10.1	bc:24:11:0g:f9:28
Example 3: See MAC addresses and their assigned IP addresses:
Query:
POST /_plugins/_sql
{
  "query" : "SELECT mac, client_addr FROM stream-zeek-2024.02.20 WHERE netflow.zeek.type ='dhcp'"
}
Result:
{
  "schema": [
    {
      "name": "mac",
      "type": "keyword"
    },
    {
      "name": "client_addr",
      "type": "keyword"
    }
  ],
  "total": 3369,
  "datarows": [
    [
      "cs:96:d5:98:55:72",
      "10.7.7.2"
    ],
    [
      "bw:85:58:6a:b7:5a",
      "10.7.7.232"
    ],
    [
      "bc:34:11:0d:s9:88",
      "192.168.10.200"
    ]
    ]
    }
Example 4: Check total number of warnings from syslog:
Query:
SELECT COUNT(sys.syslog_severity_code) AS warnings_total FROM syslog-2024.02.23 sys
WHERE syslog_severity = "warning"
Result:
warnings_total
429822
Example 5: Check number of failed login attemps for every client:
Query:
SELECT sys.client.ip, COUNT(*) AS failed_login_attempts FROM syslog-2024.02.23 sys
WHERE  postfix_message = "SASL LOGIN authentication failed: CGZFzc3evxmQ6"
GROUP BY sys.client.ip
Result:
client.ip	failed_login_attempts
144.220.71.224	3
127.174.131.70	2
146.114.84.226	3
142.169.105.19	5
142.180.112.241	3
155.211.74.18	1
SQL/PPL API
Use the SQL and PPL API to send queries to the SQL plugin. Use the _sql endpoint to send queries in SQL, and the _ppl endpoint to send queries in PPL. For both of these, you can also use the _explain endpoint to translate your query into Domain-specific language (DSL) or to troubleshoot errors.
Query API
Sends an SQL/PPL query to the SQL plugin. You can pass the format for the response as a query parameter.
Query parameters
| Parameter | Data Type | Description |
|---|---|---|
| format | String | The format for the response. The _sql endpoint supports jdbc, csv, raw, and json formats. The _ppl endpoint supports jdbc, csv, and raw formats. Default is jdbc. |
| sanitize | Boolean | Specifies whether to escape special characters in the results. See Response formats for more information. Default is true. |
Request fields
| Field | Data Type | Description |
|---|---|---|
| query | String | The query to be executed. Required. |
| filter | JSON object | The filter for the results. Optional. |
| fetch_size | integer | The number of results to return in one response. Used for paginating results. Default is 1,000. Optional. Only supported for the `jdbc` response format. |
Example request
POST /_plugins/_sql
{
  "query" : "SELECT * FROM accounts"
}
Example response
The response contains the schema and the results:
{
  "schema": [
    {
      "name": "account_number",
      "type": "long"
    },
    {
      "name": "firstname",
      "type": "text"
    },
    {
      "name": "address",
      "type": "text"
    },
    {
      "name": "balance",
      "type": "long"
    },
    {
      "name": "gender",
      "type": "text"
    },
    {
      "name": "city",
      "type": "text"
    },
    {
      "name": "employer",
      "type": "text"
    },
    {
      "name": "state",
      "type": "text"
    },
    {
      "name": "age",
      "type": "long"
    },
    {
      "name": "email",
      "type": "text"
    },
    {
      "name": "lastname",
      "type": "text"
    }
  ],
  "datarows": [
    [
      1,
      "Amber",
      "880 Holmes Lane",
      39225,
      "M",
      "Brogan",
      "Pyrami",
      "IL",
      32,
      "amberduke@pyrami.com",
      "Duke"
    ],
    [
      6,
      "Hattie",
      "671 Bristol Street",
      5686,
      "M",
      "Dante",
      "Netagy",
      "TN",
      36,
      "hattiebond@netagy.com",
      "Bond"
    ],
    [
      13,
      "Nanette",
      "789 Madison Street",
      32838,
      "F",
      "Nogal",
      "Quility",
      "VA",
      28,
      "nanettebates@quility.com",
      "Bates"
    ],
    [
      18,
      "Dale",
      "467 Hutchinson Court",
      4180,
      "M",
      "Orick",
      null,
      "MD",
      33,
      "daleadams@boink.com",
      "Adams"
    ]
  ],
  "total": 4,
  "size": 4,
  "status": 200
}
Response fields
| Field | Data Type | Description |
|---|---|---|
| schema | Array | Specifies the field names and types for all fields. |
| data_rows | 2D array | An array of results. Each result represents one matching row (document). |
| total | Integer | The total number of rows (documents) in the index. |
| size | Integer | The number of results to return in one response. |
| status | String | The HTTP response status Energy Logserver returns after running the query. |
Explain API
The SQL plugin has an explain feature that shows how a query is executed against Energy Logserver, which is useful for debugging and development. A POST request to the _plugins/_sql/_explain or _plugins/_ppl/_explain endpoint returns Domain-specific language (DSL) in JSON format, explaining the query.
You can execute the explain API operation either in command line using curl or in the Dashboards console, like in the example below.
Sample explain request for an SQL query
POST _plugins/_sql/_explain
{
  "query": "SELECT firstname, lastname FROM accounts WHERE age > 20"
}
Sample SQL query explain response
{
  "root": {
    "name": "ProjectOperator",
    "description": {
      "fields": "[firstname, lastname]"
    },
    "children": [
      {
        "name": "OpenSearchIndexScan",
        "description": {
          "request": """OpenSearchQueryRequest(indexName=accounts, sourceBuilder={"from":0,"size":200,"timeout":"1m","query":{"range":{"age":{"from":20,"to":null,"include_lower":false,"include_upper":true,"boost":1.0}}},"_source":{"includes":["firstname","lastname"],"excludes":[]},"sort":[{"_doc":{"order":"asc"}}]}, searchDone=false)"""
        },
        "children": []
      }
    ]
  }
}
Sample explain request for a PPL query
POST _plugins/_ppl/_explain
{
  "query" : "source=accounts | fields firstname, lastname"
}
Sample PPL query explain response
{
  "root": {
    "name": "ProjectOperator",
    "description": {
      "fields": "[firstname, lastname]"
    },
    "children": [
      {
        "name": "OpenSearchIndexScan",
        "description": {
          "request": """OpenSearchQueryRequest(indexName=accounts, sourceBuilder={"from":0,"size":200,"timeout":"1m","_source":{"includes":["firstname","lastname"],"excludes":[]}}, searchDone=false)"""
        },
        "children": []
      }
    ]
  }
}
For queries that require post-processing, the explain response includes a query plan in addition to the Energy Logserver DSL. For those queries that don’t require post processing, you can see a complete DSL.
Paginating results
To get back a paginated response, use the fetch_size parameter. The value of fetch_size should be greater than 0. The default value is 1,000. A value of 0 will fall back to a non-paginated response.
The fetch_size parameter is only supported for the jdbc response format.
{: .note }
Example
The following request contains an SQL query and specifies to return five results at a time:
POST _plugins/_sql/
{
  "fetch_size" : 5,
  "query" : "SELECT firstname, lastname FROM accounts WHERE age > 20 ORDER BY state ASC"
}
The response contains all the fields that a query without fetch_size would contain, and a cursor field that is used to retrieve subsequent pages of results:
{
  "schema": [
    {
      "name": "firstname",
      "type": "text"
    },
    {
      "name": "lastname",
      "type": "text"
    }
  ],
  "cursor": "d:eyJhIjp7fSwicyI6IkRYRjFaWEo1UVc1a1JtVjBZMmdCQUFBQUFBQUFBQU1XZWpkdFRFRkZUMlpTZEZkeFdsWnJkRlZoYnpaeVVRPT0iLCJjIjpbeyJuYW1lIjoiZmlyc3RuYW1lIiwidHlwZSI6InRleHQifSx7Im5hbWUiOiJsYXN0bmFtZSIsInR5cGUiOiJ0ZXh0In1dLCJmIjo1LCJpIjoiYWNjb3VudHMiLCJsIjo5NTF9",
  "total": 956,
  "datarows": [
    [
      "Cherry",
      "Carey"
    ],
    [
      "Lindsey",
      "Hawkins"
    ],
    [
      "Sargent",
      "Powers"
    ],
    [
      "Campos",
      "Olsen"
    ],
    [
      "Savannah",
      "Kirby"
    ]
  ],
  "size": 5,
  "status": 200
}
To fetch subsequent pages, use the cursor from the previous response:
POST /_plugins/_sql
{
   "cursor": "d:eyJhIjp7fSwicyI6IkRYRjFaWEo1UVc1a1JtVjBZMmdCQUFBQUFBQUFBQU1XZWpkdFRFRkZUMlpTZEZkeFdsWnJkRlZoYnpaeVVRPT0iLCJjIjpbeyJuYW1lIjoiZmlyc3RuYW1lIiwidHlwZSI6InRleHQifSx7Im5hbWUiOiJsYXN0bmFtZSIsInR5cGUiOiJ0ZXh0In1dLCJmIjo1LCJpIjoiYWNjb3VudHMiLCJsIjo5NTF9"
}
The next response contains only the datarows of the results and a new cursor.
{
  "cursor": "d:eyJhIjp7fSwicyI6IkRYRjFaWEo1UVc1a1JtVjBZMmdCQUFBQUFBQUFBQU1XZWpkdFRFRkZUMlpTZEZkeFdsWnJkRlZoYnpaeVVRPT0iLCJjIjpbeyJuYW1lIjoiZmlyc3RuYW1lIiwidHlwZSI6InRleHQifSx7Im5hbWUiOiJsYXN0bmFtZSIsInR5cGUiOiJ0ZXh0In1dLCJmIjo1LCJpIjoiYWNjb3VudHMabcde12345",
  "datarows": [
    [
      "Abbey",
      "Karen"
    ],
    [
      "Chen",
      "Ken"
    ],
    [
      "Ani",
      "Jade"
    ],
    [
      "Peng",
      "Hu"
    ],
    [
      "John",
      "Doe"
    ]
  ]
}
The datarows can have more than the fetch_size number of records in case nested fields are flattened.
The last page of results has only datarows and no cursor. The cursor context is automatically cleared on the last page.
To explicitly clear the cursor context, use the _plugins/_sql/close endpoint operation:
POST /_plugins/_sql/close
{
   "cursor": "d:eyJhIjp7fSwicyI6IkRYRjFaWEo1UVc1a1JtVjBZMmdCQUFBQUFBQUFBQU1XZWpkdFRFRkZUMlpTZEZkeFdsWnJkRlZoYnpaeVVRPT0iLCJjIjpbeyJuYW1lIjoiZmlyc3RuYW1lIiwidHlwZSI6InRleHQifSx7Im5hbWUiOiJsYXN0bmFtZSIsInR5cGUiOiJ0ZXh0In1dLCJmIjo1LCJpIjoiYWNjb3VudHMiLCJsIjo5NTF9"
}'
The response is an acknowledgement from Energy Logserver:
{"succeeded":true}
Filtering results
You can use the filter parameter to add more conditions to the Energy Logserver DSL directly.
The following SQL query returns the names and account balances of all customers. The results are then filtered to contain only those customers with less than $10,000 balance.
POST /_plugins/_sql/
{
  "query" : "SELECT firstname, lastname, balance FROM accounts",
  "filter" : {
    "range" : {
      "balance" : {
        "lt" : 10000
      }
    }
  }
}
The response contains the matching results:
{
  "schema": [
    {
      "name": "firstname",
      "type": "text"
    },
    {
      "name": "lastname",
      "type": "text"
    },
    {
      "name": "balance",
      "type": "long"
    }
  ],
  "total": 2,
  "datarows": [
    [
      "Hattie",
      "Bond",
      5686
    ],
    [
      "Dale",
      "Adams",
      4180
    ]
  ],
  "size": 2,
  "status": 200
}
You can use the Explain API to see how this query is executed against Energy Logserver:
POST /_plugins/_sql/_explain
{
  "query" : "SELECT firstname, lastname, balance FROM accounts",
  "filter" : {
    "range" : {
      "balance" : {
        "lt" : 10000
      }
    }
  }
}'
The response contains the Boolean query in Energy Logserver DSL that corresponds to the query above:
{
  "from": 0,
  "size": 200,
  "query": {
    "bool": {
      "filter": [{
        "bool": {
          "filter": [{
            "range": {
              "balance": {
                "from": null,
                "to": 10000,
                "include_lower": true,
                "include_upper": false,
                "boost": 1.0
              }
            }
          }],
          "adjust_pure_negative": true,
          "boost": 1.0
        }
      }],
      "adjust_pure_negative": true,
      "boost": 1.0
    }
  },
  "_source": {
    "includes": [
      "firstname",
      "lastname",
      "balance"
    ],
    "excludes": []
  }
}
Using parameters
You can use the parameters field to pass parameter values to a prepared SQL query.
The following explain operation uses an SQL query with an age parameter:
POST /_plugins/_sql/_explain
{
  "query": "SELECT * FROM accounts WHERE age = ?",
  "parameters": [{
    "type": "integer",
    "value": 30
  }]
}
The response contains the Boolean query in Energy Logserver DSL that corresponds to the SQL query above:
{
  "from": 0,
  "size": 200,
  "query": {
    "bool": {
      "filter": [{
        "bool": {
          "must": [{
            "term": {
              "age": {
                "value": 30,
                "boost": 1.0
              }
            }
          }],
          "adjust_pure_negative": true,
          "boost": 1.0
        }
      }],
      "adjust_pure_negative": true,
      "boost": 1.0
    }
  }
}
Response formats
The SQL plugin provides the jdbc, csv, raw, and json response formats that are useful for different purposes. The jdbc format is widely used because it provides the schema information and adds more functionality, such as pagination. Besides the JDBC driver, various clients can benefit from a detailed and well-formatted response.
JDBC format
By default, the SQL plugin returns the response in the standard JDBC format. This format is provided for the JDBC driver and clients that need both the schema and the result set to be well formatted.
Example request
The following query does not specify the response format, so the format is set to jdbc:
POST _plugins/_sql
{
  "query" : "SELECT firstname, lastname, age FROM accounts ORDER BY age LIMIT 2"
}
Example response
In the response, the schema contains the field names and types, and the datarows field contains the result set:
{
  "schema": [{
      "name": "firstname",
      "type": "text"
    },
    {
      "name": "lastname",
      "type": "text"
    },
    {
      "name": "age",
      "type": "long"
    }
  ],
  "total": 4,
  "datarows": [
    [
      "Nanette",
      "Bates",
      28
    ],
    [
      "Amber",
      "Duke",
      32
    ]
  ],
  "size": 2,
  "status": 200
}
If an error of any type occurs, Energy Logserver returns the error message.
The following query searches for a non-existent field unknown:
POST /_plugins/_sql
{
  "query" : "SELECT unknown FROM accounts"
}
The response contains the error message and the cause of the error:
{
  "error": {
    "reason": "Invalid SQL query",
    "details": "Field [unknown] cannot be found or used here.",
    "type": "SemanticAnalysisException"
  },
  "status": 400
}
Energy Logserver DSL JSON format
If you set the format to json, the original Energy Logserver response is returned in JSON format. Because this is the native response from Energy Logserver, extra effort is needed to parse and interpret it.
Example request
The following query sets the response format to json:
POST _plugins/_sql?format=json
{
  "query" : "SELECT firstname, lastname, age FROM accounts ORDER BY age LIMIT 2"
}
Example response
The response is the original response from Energy Logserver:
{
  "_shards": {
    "total": 5,
    "failed": 0,
    "successful": 5,
    "skipped": 0
  },
  "hits": {
    "hits": [{
        "_index": "accounts",
        "_type": "account",
        "_source": {
          "firstname": "Nanette",
          "age": 28,
          "lastname": "Bates"
        },
        "_id": "13",
        "sort": [
          28
        ],
        "_score": null
      },
      {
        "_index": "accounts",
        "_type": "account",
        "_source": {
          "firstname": "Amber",
          "age": 32,
          "lastname": "Duke"
        },
        "_id": "1",
        "sort": [
          32
        ],
        "_score": null
      }
    ],
    "total": {
      "value": 4,
      "relation": "eq"
    },
    "max_score": null
  },
  "took": 100,
  "timed_out": false
}
CSV format
You can also specify to return results in CSV format.
Example request
POST /_plugins/_sql?format=csv
{
  "query" : "SELECT firstname, lastname, age FROM accounts ORDER BY age"
}
Example response
firstname,lastname,age
Nanette,Bates,28
Amber,Duke,32
Dale,Adams,33
Hattie,Bond,36
Sanitizing results in CSV format
By default, Energy Logserver sanitizes header cells (field names) and data cells (field contents) according to the following rules:
- If a cell starts with
+,-,=, or@, the sanitizer inserts a single quote (') at the start of the cell. - If a cell contains one or more commas (
,), the sanitizer surrounds the cell with double quotes (").
Example
The following query indexes a document with cells that either start with special characters or contain commas:
PUT /userdata/_doc/1?refresh=true
{
  "+firstname": "-Hattie",
  "=lastname": "@Bond",
  "address": "671 Bristol Street, Dente, TN"
}
You can use the query below to request results in CSV format:
POST /_plugins/_sql?format=csv
{
  "query" : "SELECT * FROM userdata"
}
In the response, cells that start with special characters are prefixed with '. The cell that has commas is surrounded with quotation marks:
'+firstname,'=lastname,address
'Hattie,'@Bond,"671 Bristol Street, Dente, TN"
To skip sanitizing, set the sanitize query parameter to false:
POST /_plugins/_sql?format=csvandsanitize=false
{
  "query" : "SELECT * FROM userdata"
}
The response contains the results in the original CSV format:
=lastname,address,+firstname
@Bond,"671 Bristol Street, Dente, TN",-Hattie
Raw format
You can use the raw format to pipe the results to other command line tools for post-processing.
Example request
POST /_plugins/_sql?format=raw
{
  "query" : "SELECT firstname, lastname, age FROM accounts ORDER BY age"
}
Example response
Nanette|Bates|28
Amber|Duke|32
Dale|Adams|33
Hattie|Bond|36
By default, Energy Logserver sanitizes results in raw format according to the following rule:
- If a data cell contains one or more pipe characters (
|), the sanitizer surrounds the cell with double quotes.
Example
The following query indexes a document with pipe characters (|) in its fields:
PUT /userdata/_doc/1?refresh=true
{
  "+firstname": "|Hattie",
  "=lastname": "Bond|",
  "|address": "671 Bristol Street| Dente| TN"
}
You can use the query below to request results in raw format:
POST /_plugins/_sql?format=raw
{
  "query" : "SELECT * FROM userdata"
}
The query returns cells with the | character surrounded by quotation marks:
"|address"|=lastname|+firstname
"671 Bristol Street| Dente| TN"|"Bond|"|"|Hattie"
SQL
SQL in Energy Logserver bridges the gap between traditional relational database concepts and the flexibility of Energy Logserver’s document-oriented data storage. This integration gives you the ability to use your SQL knowledge to query, analyze, and extract insights from your data.
SQL and Energy Logserver terminology
Here’s how core SQL concepts map to Energy Logserver:
| SQL | Energy Logserver |
|---|---|
| Table | Index |
| Row | Document |
| Column | Field |
REST API
To use the SQL plugin with your own applications, send requests to the _plugins/_sql endpoint:
POST _plugins/_sql
{
  "query": "SELECT * FROM my-index LIMIT 50"
}
You can query multiple indexes by using a comma-separated list:
POST _plugins/_sql
{
  "query": "SELECT * FROM my-index1,myindex2,myindex3 LIMIT 50"
}
You can also specify an index pattern with a wildcard expression:
POST _plugins/_sql
{
  "query": "SELECT * FROM my-index* LIMIT 50"
}
To run the above query in the command line, use the curl command:
curl -XPOST https://localhost:9200/_plugins/_sql -u 'admin:admin' -k -H 'Content-Type: application/json' -d '{"query": "SELECT * FROM my-index* LIMIT 50"}'
You can specify the response format as JDBC, standard Energy Logserver JSON, CSV, or raw. By default, queries return data in JDBC format. The following query sets the format to JSON:
POST _plugins/_sql?format=json
{
  "query": "SELECT * FROM my-index LIMIT 50"
}
See the rest of this guide for more information about request parameters, settings, supported operations, and tools.
Basic queries
Use the SELECT clause, along with FROM, WHERE, GROUP BY, HAVING, ORDER BY, and LIMIT to search and aggregate data.
Among these clauses, SELECT and FROM are required, as they specify which fields to retrieve and which indexes to retrieve them from. All other clauses are optional. Use them according to your needs.
Syntax
The complete syntax for searching and aggregating data is as follows:
SELECT [DISTINCT] (* | expression) [[AS] alias] [, ...]
FROM index_name
[WHERE predicates]
[GROUP BY expression [, ...]
 [HAVING predicates]]
[ORDER BY expression [IS [NOT] NULL] [ASC | DESC] [, ...]]
[LIMIT [offset, ] size]
Fundamentals
Apart from the predefined keywords of SQL, the most basic elements are literal and identifiers. A literal is a numeric, string, date or boolean constant. An identifier is an Energy Logserver index or field name. With arithmetic operators and SQL functions, use literals and identifiers to build complex expressions.
Rule expressionAtom:
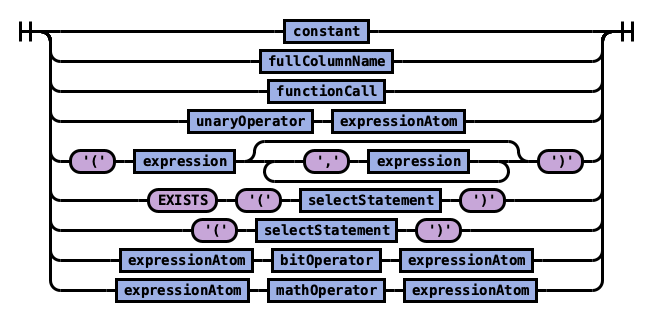 expressionAtom
The expression in turn can be combined into a predicate with logical operator. Use a predicate in the WHERE and HAVING clause to filter out data by specific conditions.
Rule expression:
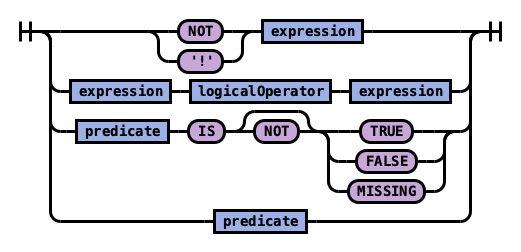 expression
Rule predicate:
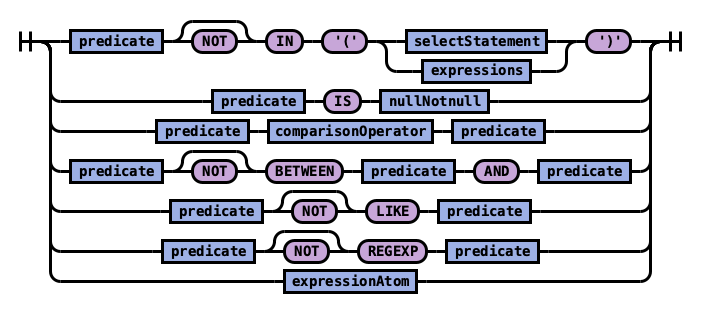 expression
Execution Order
These SQL clauses execute in an order different from how they appear:
FROM index
 WHERE predicates
  GROUP BY expressions
   HAVING predicates
    SELECT expressions
     ORDER BY expressions
      LIMIT size
Select
Specify the fields to be retrieved.
Syntax
Rule selectElements:
 selectElements
Rule selectElement:
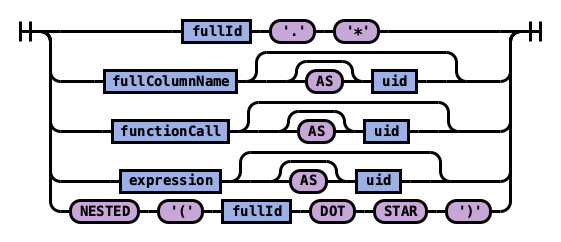 selectElements
Example 1: Use * to retrieve all fields in an index:
SELECT *
FROM accounts
| account_number | firstname | gender | city | balance | employer | state | address | lastname | age | |
|---|---|---|---|---|---|---|---|---|---|---|
| 1 | Amber | M | Brogan | 39225 | Pyrami | IL | amberduke@pyrami.com | 880 Holmes Lane | Duke | 32 |
| 16 | Hattie | M | Dante | 5686 | Netagy | TN | hattiebond@netagy.com | 671 Bristol Street | Bond | 36 |
| 13 | Nanette | F | Nogal | 32838 | Quility | VA | nanettebates@quility.com | 789 Madison Street | Bates | 28 |
| 18 | Dale | M | Orick | 4180 | MD | daleadams@boink.com | 467 Hutchinson Court | Adams | 33 |
Example 2: Use field name(s) to retrieve only specific fields:
SELECT firstname, lastname
FROM accounts
| firstname | lastname |
|---|---|
| Amber | Duke |
| Hattie | Bond |
| Nanette | Bates |
| Dale | Adams |
Example 3: Use field aliases instead of field names. Field aliases are used to make field names more readable:
SELECT account_number AS num
FROM accounts
| num |
|---|
| 1 |
| 6 |
| 13 |
| 18 |
Example 4: Use the DISTINCT clause to get back only unique field values. You can specify one or more field names:
SELECT DISTINCT age
FROM accounts
| age |
|---|
| 28 |
| 32 |
| 33 |
| 36 |
From
Specify the index that you want search.
You can specify subqueries within the FROM clause.
Syntax
Rule tableName:
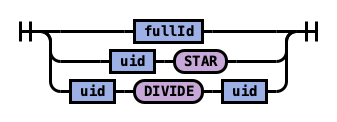 tableName
Example 1: Use index aliases to query across indexes.
In this sample query, acc is an alias for the accounts index:
SELECT account_number, accounts.age
FROM accounts
or
SELECT account_number, acc.age
FROM accounts acc
| account_number | age |
|---|---|
| 1 | 32 |
| 6 | 36 |
| 13 | 28 |
| 18 | 33 |
Example 2: Use index patterns to query indexes that match a specific pattern:
SELECT account_number
FROM account*
| account_number |
|---|
| 1 |
| 6 |
| 13 |
| 18 |
Where
Specify a condition to filter the results.
| Operators | Behavior |
|---|---|
| = | Equal to. |
| <> | Not equal to. |
| > | Greater than. |
| < | Less than. |
| >= | Greater than or equal to. |
| <= | Less than or equal to. |
| IN | Specify multiple `OR` operators. |
| BETWEEN | Similar to a range query. |
| LIKE | Use for full-text search. For more information about full-text queries. |
| IS NULL | Check if the field value is `NULL`. |
| IS NOT NULL | Check if the field value is `NOT NULL`. |
Combine comparison operators (=, <>, >, >=, <, <=) with boolean operators NOT, AND, or OR to build more complex expressions.
Example 1: Use comparison operators for numbers, strings, or dates:
SELECT account_number
FROM accounts
WHERE account_number = 1
| account_number |
|---|
| 1 |
Example 2: Energy Logserver allows for flexible schema,so documents in an index may have different fields. Use IS NULL or IS NOT NULL to retrieve only missing fields or existing fields. Energy Logserver does not differentiate between missing fields and fields explicitly set to NULL:
SELECT account_number, employer
FROM accounts
WHERE employer IS NULL
| account_number | employer |
|---|---|
| 18 |
Example 3: Deletes a document that satisfies the predicates in the WHERE clause:
DELETE FROM accounts
WHERE age > 30
Group By
Group documents with the same field value into buckets.
Example 1: Group by fields:
SELECT age
FROM accounts
GROUP BY age
| id | age |
|---|---|
| 0 | 28 |
| 1 | 32 |
| 2 | 33 |
| 3 | 36 |
Example 2: Group by field alias:
SELECT account_number AS num
FROM accounts
GROUP BY num
| id | num |
|---|---|
| 0 | 1 |
| 1 | 6 |
| 2 | 13 |
| 3 | 18 |
Example 4: Use scalar functions in the GROUP BY clause:
SELECT ABS(age) AS a
FROM accounts
GROUP BY ABS(age)
| id | a |
|---|---|
| 0 | 28.0 |
| 1 | 32.0 |
| 2 | 33.0 |
| 3 | 36.0 |
Having
Use the HAVING clause to aggregate inside each bucket based on aggregation functions (COUNT, AVG, SUM, MIN, and MAX).
The HAVING clause filters results from the GROUP BY clause:
Example 1:
SELECT age, MAX(balance)
FROM accounts
GROUP BY age HAVING MIN(balance) > 10000
| id | age | MAX (balance) |
|---|---|---|
| 0 | 28 | 32838 |
| 1 | 32 | 39225 |
Order By
Use the ORDER BY clause to sort results into your desired order.
Example 1: Use ORDER BY to sort by ascending or descending order. Besides regular field names, using ordinal, alias, or scalar functions are supported:
SELECT account_number
FROM accounts
ORDER BY account_number DESC
| account_number |
|---|
| 18 |
| 13 |
| 6 |
| 1 |
Example 2: Specify if documents with missing fields are to be put at the beginning or at the end of the results. The default behavior of Energy Logserver is to return nulls or missing fields at the end. To push them before non-nulls, use the IS NOT NULL operator:
SELECT employer
FROM accounts
ORDER BY employer IS NOT NULL
| employer |
|---|
| Netagy |
| Pyrami |
| Quility |
Limit
Specify the maximum number of documents that you want to retrieve. Used to prevent fetching large amounts of data into memory.
Example 1: If you pass in a single argument, it’s mapped to the size parameter in Energy Logserver and the from parameter is set to 0.
SELECT account_number
FROM accounts
ORDER BY account_number LIMIT 1
| account_number |
|---|
| 1 |
Example 2: If you pass in two arguments, the first is mapped to the from parameter and the second to the size parameter in Energy Logserver. You can use this for simple pagination for small indexes, as it’s inefficient for large indexes.
Use ORDER BY to ensure the same order between pages:
SELECT account_number
FROM accounts
ORDER BY account_number LIMIT 1, 1
| account_number |
|---|
| 6 |
Complex queries
Besides simple SFW (SELECT-FROM-WHERE) queries, the SQL plugin supports complex queries such as subquery, join, union, and minus. These queries operate on more than one Energy Logserver index. To examine how these queries execute behind the scenes, use the explain operation.
Joins
Energy Logserver SQL supports inner joins, cross joins, and left outer joins.
Constraints
Joins have a number of constraints:
You can only join two indexes.
You must use aliases for indexes (for example,
people p).Within an ON clause, you can only use AND conditions.
In a WHERE statement, don’t combine trees that contain multiple indexes. For example, the following statement works:
WHERE (a.type1 > 3 OR a.type1 < 0) AND (b.type2 > 4 OR b.type2 < -1)
The following statement does not:
WHERE (a.type1 > 3 OR b.type2 < 0) AND (a.type1 > 4 OR b.type2 < -1)
You can’t use GROUP BY or ORDER BY for results.
LIMIT with OFFSET (e.g.
LIMIT 25 OFFSET 25) is not supported.
Description
The JOIN clause combines columns from one or more indexes using values common to each.
 tableSource
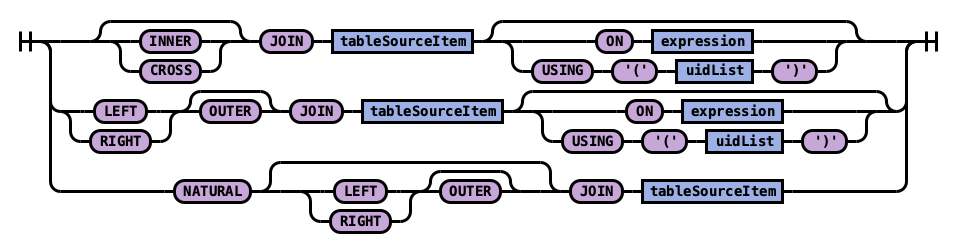 joinPart
Example 1: Inner join
Inner join creates a new result set by combining columns of two indexes based on your join predicates. It iterates the two indexes and compares each document to find the ones that satisfy the join predicates. You can optionally precede the JOIN clause with an INNER keyword.
The join predicate(s) is specified by the ON clause.
SQL query:
SELECT
  a.account_number, a.firstname, a.lastname,
  e.id, e.name
FROM accounts a
JOIN employees_nested e
 ON a.account_number = e.id
Explain:
The explain output is complicated, because a JOIN clause is associated with two Energy Logserver DSL queries that execute in separate query planner frameworks. You can interpret it by examining the Physical Plan and Logical Plan objects.
{
  "Physical Plan" : {
    "Project [ columns=[a.account_number, a.firstname, a.lastname, e.name, e.id] ]" : {
      "Top [ count=200 ]" : {
        "BlockHashJoin[ conditions=( a.account_number = e.id ), type=JOIN, blockSize=[FixedBlockSize with size=10000] ]" : {
          "Scroll [ employees_nested as e, pageSize=10000 ]" : {
            "request" : {
              "size" : 200,
              "from" : 0,
              "_source" : {
                "excludes" : [ ],
                "includes" : [
                  "id",
                  "name"
                ]
              }
            }
          },
          "Scroll [ accounts as a, pageSize=10000 ]" : {
            "request" : {
              "size" : 200,
              "from" : 0,
              "_source" : {
                "excludes" : [ ],
                "includes" : [
                  "account_number",
                  "firstname",
                  "lastname"
                ]
              }
            }
          },
          "useTermsFilterOptimization" : false
        }
      }
    }
  },
  "description" : "Hash Join algorithm builds hash table based on result of first query, and then probes hash table to find matched rows for each row returned by second query",
  "Logical Plan" : {
    "Project [ columns=[a.account_number, a.firstname, a.lastname, e.name, e.id] ]" : {
      "Top [ count=200 ]" : {
        "Join [ conditions=( a.account_number = e.id ) type=JOIN ]" : {
          "Group" : [
            {
              "Project [ columns=[a.account_number, a.firstname, a.lastname] ]" : {
                "TableScan" : {
                  "tableAlias" : "a",
                  "tableName" : "accounts"
                }
              }
            },
            {
              "Project [ columns=[e.name, e.id] ]" : {
                "TableScan" : {
                  "tableAlias" : "e",
                  "tableName" : "employees_nested"
                }
              }
            }
          ]
        }
      }
    }
  }
}
Result set:
| a.account_number | a.firstname | a.lastname | e.id | e.name |
|---|---|---|---|---|
| 6 | Hattie | Bond | 6 | Jane Smith |
Example 2: Cross join
Cross join, also known as cartesian join, combines each document from the first index with each document from the second.
The result set is the the cartesian product of documents of both indexes.
This operation is similar to the inner join without the ON clause that specifies the join condition.
It’s risky to perform cross join on two indexes of large or even medium size. It might trigger a circuit breaker that terminates the query to avoid running out of memory. {: .warning }
SQL query:
SELECT
  a.account_number, a.firstname, a.lastname,
  e.id, e.name
FROM accounts a
JOIN employees_nested e
Result set:
| a.account_number | a.firstname | a.lastname | e.id | e.name |
|---|---|---|---|---|
| 1 | Amber | Duke | 3 | Bob Smith |
| 1 | Amber | Duke | 4 | Susan Smith |
| 1 | Amber | Duke | 6 | Jane Smith |
| 6 | Hattie | Bond | 3 | Bob Smith |
| 6 | Hattie | Bond | 4 | Susan Smith |
| 6 | Hattie | Bond | 6 | Jane Smith |
| 13 | Nanette | Bates | 3 | Bob Smith |
| 13 | Nanette | Bates | 4 | Susan Smith |
| 13 | Nanette | Bates | 6 | Jane Smith |
| 18 | Dale | Adams | 3 | Bob Smith |
| 18 | Dale | Adams | 4 | Susan Smith |
| 18 | Dale | Adams | 6 | Jane Smith |
Example 3: Left outer join
Use left outer join to retain rows from the first index if it does not satisfy the join predicate. The keyword OUTER is optional.
SQL query:
SELECT
  a.account_number, a.firstname, a.lastname,
  e.id, e.name
FROM accounts a
LEFT JOIN employees_nested e
 ON a.account_number = e.id
Result set:
| a.account_number | a.firstname | a.lastname | e.id | e.name |
|---|---|---|---|---|
| 1 | Amber | Duke | null | null |
| 6 | Hattie | Bond | 6 | Jane Smith |
| 13 | Nanette | Bates | null | null |
| 18 | Dale | Adams | null | null |
Subquery
A subquery is a complete SELECT statement used within another statement and enclosed in parenthesis.
From the explain output, you can see that some subqueries are actually transformed to an equivalent join query to execute.
Example 1: Table subquery
SQL query:
SELECT a1.firstname, a1.lastname, a1.balance
FROM accounts a1
WHERE a1.account_number IN (
  SELECT a2.account_number
  FROM accounts a2
  WHERE a2.balance > 10000
)
Explain:
{
  "Physical Plan" : {
    "Project [ columns=[a1.balance, a1.firstname, a1.lastname] ]" : {
      "Top [ count=200 ]" : {
        "BlockHashJoin[ conditions=( a1.account_number = a2.account_number ), type=JOIN, blockSize=[FixedBlockSize with size=10000] ]" : {
          "Scroll [ accounts as a2, pageSize=10000 ]" : {
            "request" : {
              "size" : 200,
              "query" : {
                "bool" : {
                  "filter" : [
                    {
                      "bool" : {
                        "adjust_pure_negative" : true,
                        "must" : [
                          {
                            "bool" : {
                              "adjust_pure_negative" : true,
                              "must" : [
                                {
                                  "bool" : {
                                    "adjust_pure_negative" : true,
                                    "must_not" : [
                                      {
                                        "bool" : {
                                          "adjust_pure_negative" : true,
                                          "must_not" : [
                                            {
                                              "exists" : {
                                                "field" : "account_number",
                                                "boost" : 1
                                              }
                                            }
                                          ],
                                          "boost" : 1
                                        }
                                      }
                                    ],
                                    "boost" : 1
                                  }
                                },
                                {
                                  "range" : {
                                    "balance" : {
                                      "include_lower" : false,
                                      "include_upper" : true,
                                      "from" : 10000,
                                      "boost" : 1,
                                      "to" : null
                                    }
                                  }
                                }
                              ],
                              "boost" : 1
                            }
                          }
                        ],
                        "boost" : 1
                      }
                    }
                  ],
                  "adjust_pure_negative" : true,
                  "boost" : 1
                }
              },
              "from" : 0
            }
          },
          "Scroll [ accounts as a1, pageSize=10000 ]" : {
            "request" : {
              "size" : 200,
              "from" : 0,
              "_source" : {
                "excludes" : [ ],
                "includes" : [
                  "firstname",
                  "lastname",
                  "balance",
                  "account_number"
                ]
              }
            }
          },
          "useTermsFilterOptimization" : false
        }
      }
    }
  },
  "description" : "Hash Join algorithm builds hash table based on result of first query, and then probes hash table to find matched rows for each row returned by second query",
  "Logical Plan" : {
    "Project [ columns=[a1.balance, a1.firstname, a1.lastname] ]" : {
      "Top [ count=200 ]" : {
        "Join [ conditions=( a1.account_number = a2.account_number ) type=JOIN ]" : {
          "Group" : [
            {
              "Project [ columns=[a1.balance, a1.firstname, a1.lastname, a1.account_number] ]" : {
                "TableScan" : {
                  "tableAlias" : "a1",
                  "tableName" : "accounts"
                }
              }
            },
            {
              "Project [ columns=[a2.account_number] ]" : {
                "Filter [ conditions=[AND ( AND account_number ISN null, AND balance GT 10000 ) ] ]" : {
                  "TableScan" : {
                    "tableAlias" : "a2",
                    "tableName" : "accounts"
                  }
                }
              }
            }
          ]
        }
      }
    }
  }
}
Result set:
| a1.firstname | a1.lastname | a1.balance |
|---|---|---|
| Amber | Duke | 39225 |
| Nanette | Bates | 32838 |
Example 2: From subquery
SQL query:
SELECT a.f, a.l, a.a
FROM (
  SELECT firstname AS f, lastname AS l, age AS a
  FROM accounts
  WHERE age > 30
) AS a
Explain:
{
  "from" : 0,
  "size" : 200,
  "query" : {
    "bool" : {
      "filter" : [
        {
          "bool" : {
            "must" : [
              {
                "range" : {
                  "age" : {
                    "from" : 30,
                    "to" : null,
                    "include_lower" : false,
                    "include_upper" : true,
                    "boost" : 1.0
                  }
                }
              }
            ],
            "adjust_pure_negative" : true,
            "boost" : 1.0
          }
        }
      ],
      "adjust_pure_negative" : true,
      "boost" : 1.0
    }
  },
  "_source" : {
    "includes" : [
      "firstname",
      "lastname",
      "age"
    ],
    "excludes" : [ ]
  }
}
Result set:
| f | l | a |
|---|---|---|
| Amber | Duke | 32 |
| Dale | Adams | 33 |
| Hattie | Bond | 36 |
Functions
The SQL language supports all SQL plugin common functions, including relevance search, but also introduces a few function synonyms, which are available in SQL only.
These synonyms are provided by the V1 engine. For more information, see Limitations.
Match query
The MATCHQUERY and MATCH_QUERY functions are synonyms for the MATCH relevance function. They don’t accept additional arguments but provide an alternate syntax.
Syntax
To use matchquery or match_query, pass in your search query and the field name that you want to search against:
match_query(field_expression, query_expression[, option=<option_value>]*)
matchquery(field_expression, query_expression[, option=<option_value>]*)
field_expression = match_query(query_expression[, option=<option_value>]*)
field_expression = matchquery(query_expression[, option=<option_value>]*)
You can specify the following options in any order:
analyzerboost
Example
You can use MATCHQUERY to replace MATCH:
SELECT account_number, address
FROM accounts
WHERE MATCHQUERY(address, 'Holmes')
Alternatively, you can use MATCH_QUERY to replace MATCH:
SELECT account_number, address
FROM accounts
WHERE address = MATCH_QUERY('Holmes')
The results contain documents in which the address contains “Holmes”:
| account_number | address |
|---|---|
| 1 | 880 Holmes Lane |
Multi-match
There are three synonyms for MULTI_MATCH, each with a slightly different syntax. They accept a query string and a fields list with weights. They can also accept additional optional parameters.
Syntax
multimatch('query'=query_expression[, 'fields'=field_expression][, option=<option_value>]*)
multi_match('query'=query_expression[, 'fields'=field_expression][, option=<option_value>]*)
multimatchquery('query'=query_expression[, 'fields'=field_expression][, option=<option_value>]*)
The fields parameter is optional and can contain a single field or a comma-separated list (whitespace characters are not allowed). The weight for each field is optional and is specified after the field name. It should be delimited by the caret character – ^ – without whitespace.
Example
The following queries show the fields parameter of a multi-match query with a single field and a field list:
multi_match('fields' = "Tags^2,Title^3.4,Body,Comments^0.3", ...)
multi_match('fields' = "Title", ...)
You can specify the following options in any order:
analyzerboostsloptypetie_breakeroperator
Query string
The QUERY function is a synonym for ‘QUERY_STRING`.
Syntax
query('query'=query_expression[, 'fields'=field_expression][, option=<option_value>]*)
The fields parameter is optional and can contain a single field or a comma-separated list (whitespace characters are not allowed). The weight for each field is optional and is specified after the field name. It should be delimited by the caret character – ^ – without whitespace.
Example
The following queries show the fields parameter of a multi-match query with a single field and a field list:
query('fields' = "Tags^2,Title^3.4,Body,Comments^0.3", ...)
query('fields' = "Tags", ...)
You can specify the following options in any order:
analyzerboostslopdefault_field
Example of using query_string in SQL and PPL queries:
The following is a sample REST API search request in Energy Logserver DSL.
GET accounts/_search
{
  "query": {
    "query_string": {
      "query": "Lane Street",
      "fields": [ "address" ],
    }
  }
}
The request above is equivalent to the following query function:
SELECT account_number, address
FROM accounts
WHERE query('address:Lane OR address:Street')
The results contain addresses that contain “Lane” or “Street”:
| account_number | address |
|---|---|
| 1 | 880 Holmes Lane |
| 6 | 671 Bristol Street |
| 13 | 789 Madison Street |
Match phrase
The MATCHPHRASEQUERY function is a synonym for MATCH_PHRASE.
Syntax
matchphrasequery(query_expression, field_expression[, option=<option_value>]*)
You can specify the following options in any order:
analyzerboostslop
Score query
To return a relevance score along with every matching document, use the SCORE, SCOREQUERY, or SCORE_QUERY functions.
Syntax
The SCORE function expects two arguments. The first argument is the MATCH_QUERY expression. The second argument is an optional floating-point number to boost the score (the default value is 1.0):
SCORE(match_query_expression, score)
SCOREQUERY(match_query_expression, score)
SCORE_QUERY(match_query_expression, score)
Example
The following example uses the SCORE function to boost the documents’ scores:
SELECT account_number, address, _score
FROM accounts
WHERE SCORE(MATCH_QUERY(address, 'Lane'), 0.5) OR
  SCORE(MATCH_QUERY(address, 'Street'), 100)
ORDER BY _score
The results contain matches with corresponding scores:
| account_number | address | score |
|---|---|---|
| 1 | 880 Holmes Lane | 0.5 |
| 6 | 671 Bristol Street | 100 |
| 13 | 789 Madison Street | 100 |
Wildcard query
To search documents by a given wildcard, use the WILDCARDQUERY or WILDCARD_QUERY functions.
Syntax
wildcardquery(field_expression, query_expression[, boost=<value>])
wildcard_query(field_expression, query_expression[, boost=<value>])
Example
The following example uses a wildcard query:
SELECT account_number, address
FROM accounts
WHERE wildcard_query(address, '*Holmes*');
The results contain documents that match the wildcard expression:
| account_number | address :— | :— 1 | 880 Holmes Lane
JSON Support
SQL plugin supports JSON by following PartiQL specification, a SQL-compatible query language that lets you query semi-structured and nested data for any data format. The SQL plugin only supports a subset of the PartiQL specification.
Querying nested collection
PartiQL extends SQL to allow you to query and unnest nested collections. In Energy Logserver, this is very useful to query a JSON index with nested objects or fields.
To follow along, use the bulk operation to index some sample data:
POST employees_nested/_bulk?refresh
{"index":{"_id":"1"}}
{"id":3,"name":"Bob Smith","title":null,"projects":[{"name":"SQL Spectrum querying","started_year":1990},{"name":"SQL security","started_year":1999},{"name":"Energy Logserver security","started_year":2015}]}
{"index":{"_id":"2"}}
{"id":4,"name":"Susan Smith","title":"Dev Mgr","projects":[]}
{"index":{"_id":"3"}}
{"id":6,"name":"Jane Smith","title":"Software Eng 2","projects":[{"name":"SQL security","started_year":1998},{"name":"Hello security","started_year":2015,"address":[{"city":"Dallas","state":"TX"}]}]}
Example 1: Unnesting a nested collection
This example finds the nested document (projects) with a field value (name) that satisfies the predicate (contains security). Because each parent document can have more than one nested documents, the nested document that matches is flattened. In other words, the final result is the cartesian product between the parent and nested documents.
SELECT e.name AS employeeName,
       p.name AS projectName
FROM employees_nested AS e,
       e.projects AS p
WHERE p.name LIKE '%security%'
Explain:
{
  "from" : 0,
  "size" : 200,
  "query" : {
    "bool" : {
      "filter" : [
        {
          "bool" : {
            "must" : [
              {
                "nested" : {
                  "query" : {
                    "wildcard" : {
                      "projects.name" : {
                        "wildcard" : "*security*",
                        "boost" : 1.0
                      }
                    }
                  },
                  "path" : "projects",
                  "ignore_unmapped" : false,
                  "score_mode" : "none",
                  "boost" : 1.0,
                  "inner_hits" : {
                    "ignore_unmapped" : false,
                    "from" : 0,
                    "size" : 3,
                    "version" : false,
                    "seq_no_primary_term" : false,
                    "explain" : false,
                    "track_scores" : false,
                    "_source" : {
                      "includes" : [
                        "projects.name"
                      ],
                      "excludes" : [ ]
                    }
                  }
                }
              }
            ],
            "adjust_pure_negative" : true,
            "boost" : 1.0
          }
        }
      ],
      "adjust_pure_negative" : true,
      "boost" : 1.0
    }
  },
  "_source" : {
    "includes" : [
      "name"
    ],
    "excludes" : [ ]
  }
}
Result set:
| employeeName | projectName |
|---|---|
| Bob Smith | Energy Logserver Security |
| Bob Smith | SQL security |
| Jane Smith | Hello security |
| Jane Smith | SQL security |
Example 2: Unnesting in existential subquery
To unnest a nested collection in a subquery to check if it satisfies a condition:
SELECT e.name AS employeeName
FROM employees_nested AS e
WHERE EXISTS (
    SELECT *
    FROM e.projects AS p
    WHERE p.name LIKE '%security%'
)
Explain:
{
"from" : 0,
"size" : 200,
"query" : {
"bool" : {
"filter" : [
{
"bool" : {
"must" : [
{
"nested" : {
"query" : {
"bool" : {
"must" : [
{
"bool" : {
"must" : [
{
"bool" : {
"must_not" : [
{
"bool" : {
"must_not" : [
{
"exists" : {
"field" : "projects",
"boost" : 1.0
}
}
],
"adjust_pure_negative" : true,
"boost" : 1.0
}
}
],
"adjust_pure_negative" : true,
"boost" : 1.0
}
},
{
"wildcard" : {
"projects.name" : {
"wildcard" : "*security*",
"boost" : 1.0
}
}
}
],
"adjust_pure_negative" : true,
"boost" : 1.0
}
}
],
"adjust_pure_negative" : true,
"boost" : 1.0
}
},
"path" : "projects",
"ignore_unmapped" : false,
"score_mode" : "none",
"boost" : 1.0
}
}
],
"adjust_pure_negative" : true,
"boost" : 1.0
}
}
],
"adjust_pure_negative" : true,
"boost" : 1.0
}
},
"_source" : {
"includes" : [
"name"
],
"excludes" : [ ]
}
}
Result set:
| employeeName | :— | :— Bob Smith | Jane Smith |
Metadata queries
To see basic metadata about your indexes, use the SHOW and DESCRIBE commands.
 showStatement
 showFilter
Example 1: See metadata for indexes
To see metadata for indexes that match a specific pattern, use the SHOW command.
Use the wildcard % to match all indexes:
SHOW TABLES LIKE %
| TABLE_CAT | TABLE_SCHEM | TABLE_NAME | TABLE_TYPE | REMARKS | TYPE_CAT | TYPE_SCHEM | TYPE_NAME | SELF_REFERENCING_COL_NAME | REF_GENERATION :— | :— docker-cluster | null | accounts | BASE TABLE | null | null | null | null | null | null docker-cluster | null | employees_nested | BASE TABLE | null | null | null | null | null | null
Example 2: See metadata for a specific index
To see metadata for an index name with a prefix of acc:
SHOW TABLES LIKE acc%
| TABLE_CAT | TABLE_SCHEM | TABLE_NAME | TABLE_TYPE | REMARKS | TYPE_CAT | TYPE_SCHEM | TYPE_NAME | SELF_REFERENCING_COL_NAME | REF_GENERATION :— | :— docker-cluster | null | accounts | BASE TABLE | null | null | null | null | null | null
Example 3: See metadata for fields
To see metadata for field names that match a specific pattern, use the DESCRIBE command:
DESCRIBE TABLES LIKE accounts
| TABLE_CAT | TABLE_SCHEM | TABLE_NAME | COLUMN_NAME | DATA_TYPE | TYPE_NAME | COLUMN_SIZE | BUFFER_LENGTH | DECIMAL_DIGITS | NUM_PREC_RADIX | NULLABLE | REMARKS | COLUMN_DEF | SQL_DATA_TYPE | SQL_DATETIME_SUB | CHAR_OCTET_LENGTH | ORDINAL_POSITION | IS_NULLABLE | SCOPE_CATALOG | SCOPE_SCHEMA | SCOPE_TABLE | SOURCE_DATA_TYPE | IS_AUTOINCREMENT | IS_GENERATEDCOLUMN :— | :— | :— | :— | :— | :— | :— | :— | :— | :— | :— | :— | :— | :— | :— | :— | :— | :— | :— | :— | :— | :— | :— docker-cluster | null | accounts | account_number | null | long | null | null | null | 10 | 2 | null | null | null | null | null | 1 | | null | null | null | null | NO | docker-cluster | null | accounts | firstname | null | text | null | null | null | 10 | 2 | null | null | null | null | null | 2 | | null | null | null | null | NO | docker-cluster | null | accounts | address | null | text | null | null | null | 10 | 2 | null | null | null | null | null | 3 | | null | null | null | null | NO | docker-cluster | null | accounts | balance | null | long | null | null | null | 10 | 2 | null | null | null | null | null | 4 | | null | null | null | null | NO | docker-cluster | null | accounts | gender | null | text | null | null | null | 10 | 2 | null | null | null | null | null | 5 | | null | null | null | null | NO | docker-cluster | null | accounts | city | null | text | null | null | null | 10 | 2 | null | null | null | null | null | 6 | | null | null | null | null | NO | docker-cluster | null | accounts | employer | null | text | null | null | null | 10 | 2 | null | null | null | null | null | 7 | | null | null | null | null | NO | docker-cluster | null | accounts | state | null | text | null | null | null | 10 | 2 | null | null | null | null | null | 8 | | null | null | null | null | NO | docker-cluster | null | accounts | age | null | long | null | null | null | 10 | 2 | null | null | null | null | null | 9 | | null | null | null | null | NO | docker-cluster | null | accounts | email | null | text | null | null | null | 10 | 2 | null | null | null | null | null | 10 | | null | null | null | null | NO | docker-cluster | null | accounts | lastname | null | text | null | null | null | 10 | 2 | null | null | null | null | null | 11 | | null | null | null | null | NO |
Aggregate functions
Aggregate functions operate on subsets defined by the GROUP BY clause. In the absence of a GROUP BY clause, aggregate functions operate on all elements of the result set. You can use aggregate functions in the GROUP BY, SELECT, and HAVING clauses.
Energy Logserver supports the following aggregate functions.
Function | Description
:— | :—
AVG | Returns the average of the results.
COUNT | Returns the number of results.
SUM | Returns the sum of the results.
MIN | Returns the minimum of the results.
MAX | Returns the maximum of the results.
VAR_POP or VARIANCE | Returns the population variance of the results after discarding nulls. Returns 0 when there is only one row of results.
VAR_SAMP | Returns the sample variance of the results after discarding nulls. Returns null when there is only one row of results.
STD or STDDEV | Returns the sample standard deviation of the results. Returns 0 when there is only one row of results.
STDDEV_POP | Returns the population standard deviation of the results. Returns 0 when there is only one row of results.
STDDEV_SAMP | Returns the sample standard deviation of the results. Returns null when there is only one row of results.
The examples below reference an employees table. You can try out the examples by indexing the following documents into Energy Logserver using the bulk index operation:
PUT employees/_bulk?refresh
{"index":{"_id":"1"}}
{"employee_id": 1, "department":1, "firstname":"Amber", "lastname":"Duke", "sales":1356, "sale_date":"2020-01-23"}
{"index":{"_id":"2"}}
{"employee_id": 1, "department":1, "firstname":"Amber", "lastname":"Duke", "sales":39224, "sale_date":"2021-01-06"}
{"index":{"_id":"6"}}
{"employee_id":6, "department":1, "firstname":"Hattie", "lastname":"Bond", "sales":5686, "sale_date":"2021-06-07"}
{"index":{"_id":"7"}}
{"employee_id":6, "department":1, "firstname":"Hattie", "lastname":"Bond", "sales":12432, "sale_date":"2022-05-18"}
{"index":{"_id":"13"}}
{"employee_id":13,"department":2, "firstname":"Nanette", "lastname":"Bates", "sales":32838, "sale_date":"2022-04-11"}
{"index":{"_id":"18"}}
{"employee_id":18,"department":2, "firstname":"Dale", "lastname":"Adams", "sales":4180, "sale_date":"2022-11-05"}
GROUP BY
The GROUP BY clause defines subsets of a result set. Aggregate functions operate on these subsets and return one result row for each subset.
You can use an identifier, ordinal, or expression in the GROUP BY clause.
Using an identifier in GROUP BY
You can specify the field name (column name) to aggregate on in the GROUP BY clause. For example, the following query returns the department numbers and the total sales for each department:
SELECT department, sum(sales)
FROM employees
GROUP BY department;
| department | sum(sales) |
|---|---|
| 1 | 58700< |
| 2 | 37018 |
Using an ordinal in GROUP BY
You can specify the column number to aggregate on in the GROUP BY clause. The column number is determined by the column position in the SELECT clause. For example, the following query is equivalent to the query above. It returns the department numbers and the total sales for each department. It groups the results by the first column of the result set, which is department:
SELECT department, sum(sales)
FROM employees
GROUP BY 1;
| department | sum(sales) |
|---|---|
| 1 | 58700 |
| 2 | 37018 |
Using an expression in GROUP BY
You can use an expression in the GROUP BY clause. For example, the following query returns the average sales for each year:
SELECT year(sale_date), avg(sales)
FROM employees
GROUP BY year(sale_date);
| year(start_date) | avg(sales) |
|---|---|
| 2020 | 1356.0 |
| 2021 | 22455.0 |
| 2022 | 16484.0 |
SELECT
You can use aggregate expressions in the SELECT clause either directly or as part of a larger expression. In addition, you can use expressions as arguments of aggregate functions.
Using aggregate expressions directly in SELECT
The following query returns the average sales for each department:
SELECT department, avg(sales)
FROM employees
GROUP BY department;
| department | avg(sales) |
|---|---|
| 1 | 14675.0 |
| 2 | 18509.0 |
Using aggregate expressions as part of larger expressions in SELECT
The following query calculates the average commission for the employees of each department as 5% of the average sales:
SELECT department, avg(sales) * 0.05 as avg_commission
FROM employees
GROUP BY department;
| department | avg_commission |
|---|---|
| 1 | 733.75 |
| 2 | 925.45 |
Using expressions as arguments to aggregate functions
The following query calculates the average commission amount for each department. First it calculates the commission amount for each sales value as 5% of the sales. Then it determines the average of all commission values:
SELECT department, avg(sales * 0.05) as avg_commission
FROM employees
GROUP BY department;
| department | avg_commission |
|---|---|
| 1 | 733.75 |
| 2 | 925.45 |
COUNT
The COUNT function accepts arguments, such as *, or literals, such as 1.
The following table describes how various forms of the COUNT function operate.
| Function type | Description |
|---|---|
| COUNT(field) | Counts the number of rows where the value of the given field (or expression) is not null. |
| COUNT(*) | Counts the total number of rows in a table. |
| COUNT(1) [same as COUNT(*)] | Counts any non-null literal. |
For example, the following query returns the count of sales for each year:
SELECT year(sale_date), count(sales)
FROM employees
GROUP BY year(sale_date);
| year(sale_date) | count(sales) |
|---|---|
| 2020 | 1 |
| 2021 | 2 |
| 2022 | 3 |
HAVING
Both WHERE and HAVING are used to filter results. The WHERE filter is applied before the GROUP BY phase, so you cannot use aggregate functions in a WHERE clause. However, you can use the WHERE clause to limit the rows to which the aggregate is then applied.
The HAVING filter is applied after the GROUP BY phase, so you can use the HAVING clause to limit the groups that are included in the results.
HAVING with GROUP BY
You can use aggregate expressions or their aliases defined in a SELECT clause in a HAVING condition.
The following query uses an aggregate expression in the HAVING clause. It returns the number of sales for each employee who made more than one sale:
SELECT employee_id, count(sales)
FROM employees
GROUP BY employee_id
HAVING count(sales) > 1;
| employee_id | count(sales) |
|---|---|
| 1 | 2 |
| 6 | 2 |
The aggregations in a HAVING clause do not have to be the same as the aggregations in a SELECT list. The following query uses the count function in the HAVING clause but the sum function in the SELECT clause. It returns the total sales amount for each employee who made more than one sale:
SELECT employee_id, sum(sales)
FROM employees
GROUP BY employee_id
HAVING count(sales) > 1;
| employee_id | sum (sales) |
|---|---|
| 1 | 40580 |
| 6 | 18120 |
As an extension of the SQL standard, you are not restricted to using only identifiers in the GROUP BY clause. The following query uses an alias in the GROUP BY clause and is equivalent to the previous query:
SELECT employee_id as id, sum(sales)
FROM employees
GROUP BY id
HAVING count(sales) > 1;
| id | sum (sales) |
|---|---|
| 1 | 40580 |
| 6 | 18120 |
You can also use an alias for an aggregate expression in the HAVING clause. The following query returns the total sales for each department where sales exceed $40,000:
SELECT department, sum(sales) as total
FROM employees
GROUP BY department
HAVING total > 40000;
| department | total |
|---|---|
| 1 | 58700 |
If an identifier is ambiguous (for example, present both as a SELECT alias and as an index field), the preference is given to the alias. In the following query the identifier is replaced with the expression aliased in the SELECT clause:
SELECT department, sum(sales) as sales
FROM employees
GROUP BY department
HAVING sales > 40000;
| department | sales |
|---|---|
| 1 | 58700 |
HAVING without GROUP BY
You can use a HAVING clause without a GROUP BY clause. In this case, the whole set of data is to be considered one group. The following query will return True if there is more than one value in the department column:
SELECT 'True' as more_than_one_department FROM employees HAVING min(department) < max(department);
| more_than_one_department |
|---|
| True |
If all employees in the employee table belonged to the same department, the result would contain zero rows:
| more_than_one_department |
|---|
Delete
The DELETE statement deletes documents that satisfy the predicates in the WHERE clause.
If you don’t specify the WHERE clause, all documents are deleted.
Setting
The DELETE statement is disabled by default. To enable the DELETE functionality in SQL, you need to update the configuration by sending the following request:
PUT _plugins/_query/settings
{
"transient": {
"plugins.sql.delete.enabled": "true"
}
}
 singleDeleteStatement
Example
SQL query:
DELETE FROM accounts
WHERE age > 30
Explain:
{
"size" : 1000,
"query" : {
"bool" : {
"must" : [
{
"range" : {
"age" : {
"from" : 30,
"to" : null,
"include_lower" : false,
"include_upper" : true,
"boost" : 1.0
}
}
}
],
"adjust_pure_negative" : true,
"boost" : 1.0
}
},
"_source" : false
}
Result set:
{
"schema" : [
{
"name" : "deleted_rows",
"type" : "long"
}
],
"total" : 1,
"datarows" : [
[
3
]
],
"size" : 1,
"status" : 200
}
The datarows field shows the number of documents deleted.
PPL - Piped Processing Language
Piped Processing Language (PPL) is a query language that lets you use pipe (|) syntax to explore, discover, and query data stored in Energy Logserver.
To quickly get up and running with PPL, use SQL in Energy Logserver Dashboards.
The PPL syntax consists of commands delimited by the pipe character (|) where data flows from left to right through each pipeline.
search command | command 1 | command 2 ...
You can only use read-only commands like search, where, fields, rename, dedup, stats, sort, eval, head, top, and rare.
Quick start
To get started with PPL, choose Dev Tools in Energy Logserver Dashboards and use the bulk operation to index some sample data:
PUT accounts/_bulk?refresh
{"index":{"_id":"1"}}
{"account_number":1,"balance":39225,"firstname":"Amber","lastname":"Duke","age":32,"gender":"M","address":"880 Holmes Lane","employer":"Pyrami","email":"amberduke@pyrami.com","city":"Brogan","state":"IL"}
{"index":{"_id":"6"}}
{"account_number":6,"balance":5686,"firstname":"Hattie","lastname":"Bond","age":36,"gender":"M","address":"671 Bristol Street","employer":"Netagy","email":"hattiebond@netagy.com","city":"Dante","state":"TN"}
{"index":{"_id":"13"}}
{"account_number":13,"balance":32838,"firstname":"Nanette","lastname":"Bates","age":28,"gender":"F","address":"789 Madison Street","employer":"Quility","city":"Nogal","state":"VA"}
{"index":{"_id":"18"}}
{"account_number":18,"balance":4180,"firstname":"Dale","lastname":"Adams","age":33,"gender":"M","address":"467 Hutchinson Court","email":"daleadams@boink.com","city":"Orick","state":"MD"}
Go to SQL and select PPL.
The following example returns firstname and lastname fields for documents in an accounts index with age greater than 18:
search source=accounts
| where age > 18
| fields firstname, lastname
Example response
| firstname | lastname |
|---|---|
| Amber | Duke |
| Hattie | Bond |
| Nanette | Bates |
| Dale | Adams |
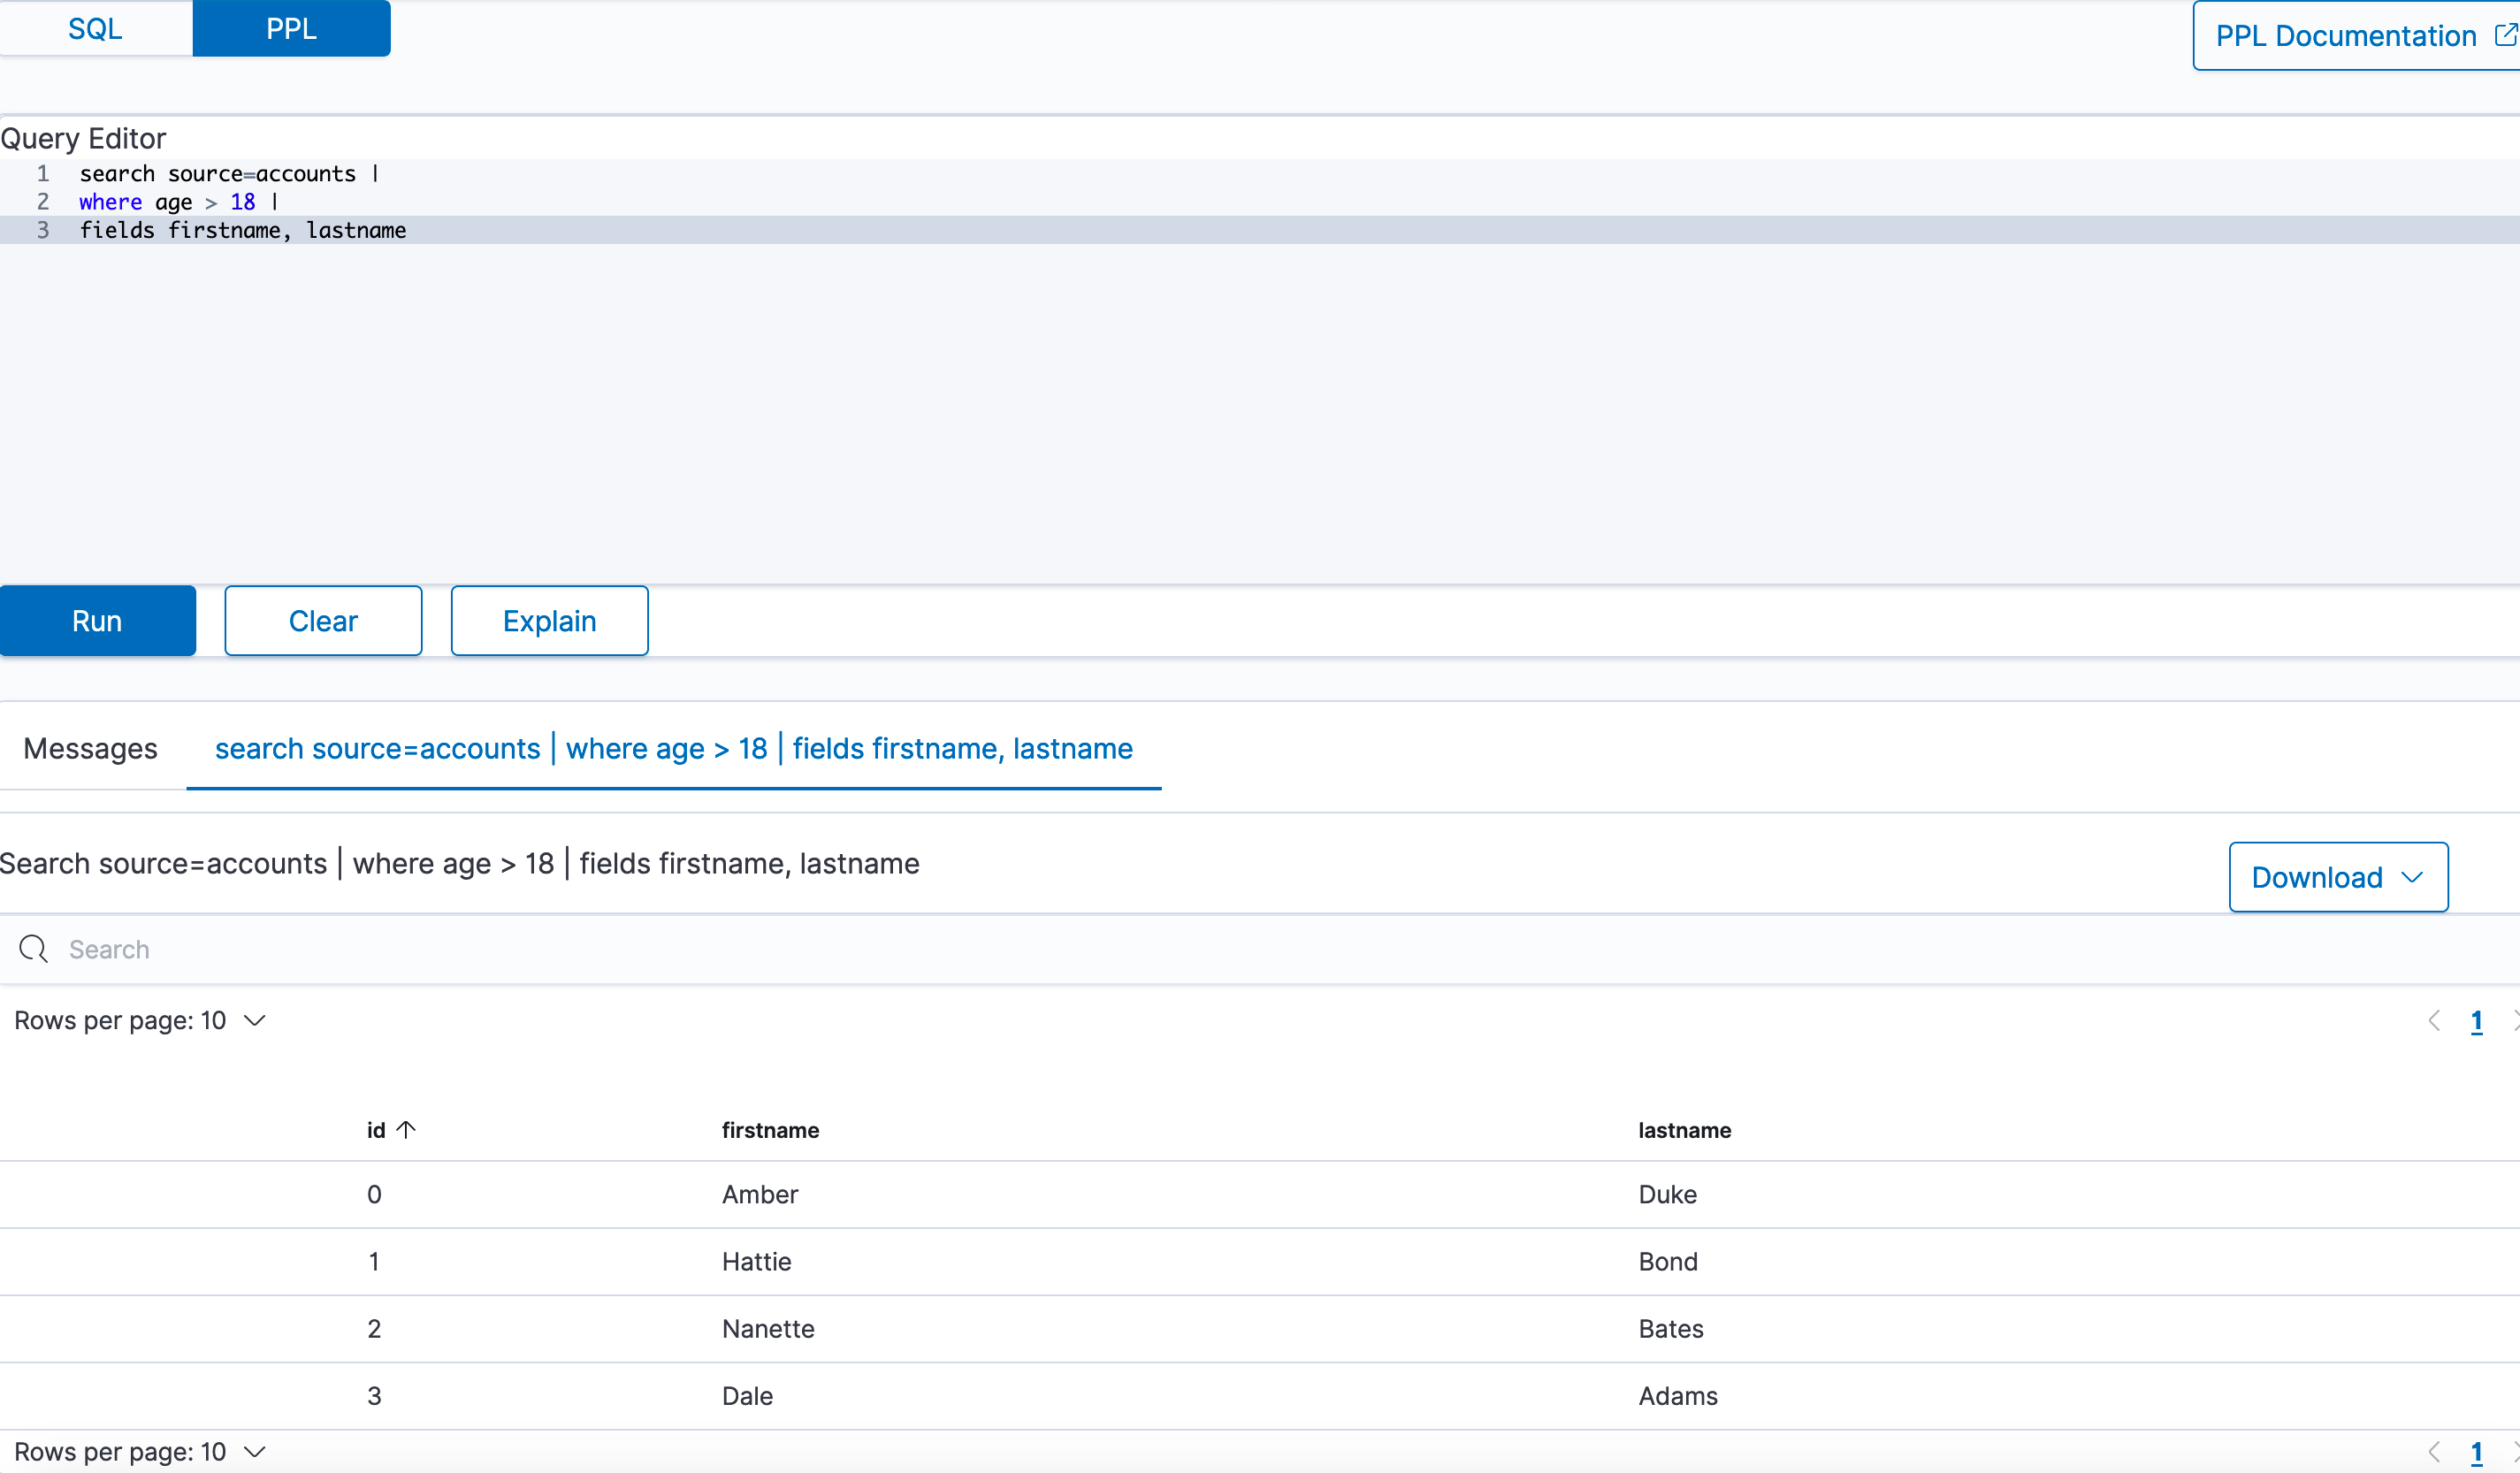 PPL query workbench
PPL syntax
Every PPL query starts with the search command. It specifies the index to search and retrieve documents from. Subsequent commands can follow in any order.
Currently, PPL supports only one search command, which can be omitted to simplify the query.
{ : .note}
Syntax
search source=<index> [boolean-expression]
source=<index> [boolean-expression]
| Field | Description | Required |
|---|---|---|
| search | Specifies search keywords. | Yes |
| index | Specifies which index to query from. | No |
| bool-expression | Specifies an expression that evaluates to a Boolean value. | No |
Examples
Example 1: Search through accounts index
In the following example, the search command refers to an accounts index as the source and uses fields and where commands for the conditions:
search source=accounts
| where age > 18
| fields firstname, lastname
In the following examples, angle brackets < > enclose required arguments and square brackets [ ] enclose optional arguments.
Example 2: Get all documents
To get all documents from the accounts index, specify it as the source:
search source=accounts;
| account_number | firstname | address | balance | gender | city | employer | state | age | lastname | |
|---|---|---|---|---|---|---|---|---|---|---|
| 1 | Amber | 880 Holmes Lane | 39225 | M | Brogan | Pyrami | IL | 32 | amberduke@pyrami.com | Duke |
| 6 | Hattie | 671 Bristol Street | 5686 | M | Dante | Netagy | TN | 36 | hattiebond@netagy.com | Bond |
| 13 | Nanette | 789 Madison Street | 32838 | F | Nogal | Quility | VA | 28 | null | Bates |
| 18 | Dale | 467 Hutchinson Court | 4180 | M | Orick | null | MD | 33 | daleadams@boink.com | Adams |
Example 3: Get documents that match a condition
To get all documents from the accounts index that either have account_number equal to 1 or have gender as F, use the following query:
search source=accounts account_number=1 or gender=\"F\";
| account_number | firstname | address | balance | gender | city | employer | state | age | lastname | |
|---|---|---|---|---|---|---|---|---|---|---|
| 1 | Amber | 880 Holmes Lane | 39225 | M | Brogan | Pyrami | IL | 32 | amberduke@pyrami.com | Duke |
| 13 | Nanette | 789 Madison Street | 32838 | F | Nogal | Quility | VA | 28 | null | Bates |
Commands
PPL supports all SQL common functions, including relevance search, but also introduces few more functions (called commands) which are available in PPL only.
dedup
The dedup (data deduplication) command removes duplicate documents defined by a field from the search result.
Syntax
dedup [int] <field-list> [keepempty=<bool>] [consecutive=<bool>]
| Field | Description | Type | Required | Default |
|---|---|---|---|---|
| int | Retain the specified number of duplicate events for each combination. The number must be greater than 0. If you do not specify a number, only the first occurring event is kept and all other duplicates are removed from the results. | string | No | 1 |
| keepempty | If true, keep the document if any field in the field list has a null value or a field missing. | nested list of objects | No | False |
| consecutive | If true, remove only consecutive events with duplicate combinations of values. | Boolean | No | False |
| field-list | Specify a comma-delimited field list. At least one field is required. | String or comma-separated list of strings | Yes | - |
Example 1: Dedup by one field
To remove duplicate documents with the same gender:
search source=accounts | dedup gender | fields account_number, gender;
| account_number | gender |
|---|---|
| 1 | M |
| 13 | F |
Example 2: Keep two duplicate documents
To keep two duplicate documents with the same gender:
search source=accounts | dedup 2 gender | fields account_number, gender;
| account_number | gender |
|---|---|
| 1 | M |
| 6 | M |
| 13 | F |
Example 3: Keep or ignore an empty field by default
To keep two duplicate documents with a null field value:
search source=accounts | dedup email keepempty=true | fields account_number, email;
| account_number | |
|---|---|
| 1 | amberduke@pyrami.com |
| 6 | hattiebond@netagy.com |
| 13 | null |
| 18 | daleadams@boink.com |
To remove duplicate documents with the null field value:
search source=accounts | dedup email | fields account_number, email;
| account_number | |
|---|---|
| 1 | amberduke@pyrami.com |
| 6 | hattiebond@netagy.com |
| 18 | daleadams@boink.com |
Example 4: Dedup of consecutive documents
To remove duplicates of consecutive documents:
search source=accounts | dedup gender consecutive=true | fields account_number, gender;
| account_number | gender |
|---|---|
| 1 | M |
| 13 | F |
| 18 | M |
Limitations
The dedup command is not rewritten to Energy Logserver DSL, it is only executed on the coordination node.
eval
The eval command evaluates an expression and appends its result to the search result.
Syntax
eval <field>=<expression> ["," <field>=<expression> ]...
| Field | Description | Required |
|---|---|---|
| field | If a field name does not exist, a new field is added. If the field name already exists, it's overwritten. | Yes |
| expression | Specify any supported expression. | Yes |
Example 1: Create a new field
To create a new doubleAge field for each document. doubleAge is the result of age multiplied by 2:
search source=accounts | eval doubleAge = age * 2 | fields age, doubleAge;
| age | doubleAge | |
|---|---|
| 32 | 64 |
| 36 | 72 |
| 28 | 56 |
| 33 | 66 |
Example 2: Overwrite the existing field
To overwrite the age field with age plus 1:
search source=accounts | eval age = age + 1 | fields age;
| age |
|---|
| 33 |
| 37 |
| 29 |
| 34 |
Example 3: Create a new field with a field defined with the eval command
To create a new field ddAge. ddAge is the result of doubleAge multiplied by 2, where doubleAge is defined in the eval command:
search source=accounts | eval doubleAge = age * 2, ddAge = doubleAge * 2 | fields age, doubleAge, ddAge;
| age | doubleAge | ddAge |
|---|---|---|
| 32 | 64 | 128 |
| 36 | 72 | 144 |
| 28 | 56 | 112 |
| 33 | 66 | 132 |
Limitation
The eval command is not rewritten to Energy Logserver DSL, it is only executed on the coordination node.
fields
Use the fields command to keep or remove fields from a search result.
Syntax
fields [+|-] <field-list>
| Field | Description | Required | Default |
|---|---|---|---|
| index | Plus (+) keeps only fields specified in the field list. Minus (-) removes all fields specified in the field list. | No | + |
| field list | Specify a comma-delimited list of fields. | Yes | No default |
Example 1: Select specified fields from result
To get account_number, firstname, and lastname fields from a search result:
search source=accounts | fields account_number, firstname, lastname;
| account_number | firstname | lastname |
|---|---|---|
| 1 | Amber | Duke |
| 6 | Hattie | Bond |
| 13 | Nanette | Bates |
| 18 | Dale | Adams |
Example 2: Remove specified fields from a search result
To remove the account_number field from the search results:
search source=accounts | fields account_number, firstname, lastname | fields - account_number;
| firstname | lastname |
|---|---|
| Amber | Duke |
| Hattie | Bond |
| Nanette | Bates |
| Dale | Adams |
parse
Use the parse command to parse a text field using regular expression and append the result to the search result.
Syntax
parse <field> <regular-expression>
| Field | Description | Required |
|---|---|---|
| field | A text field. | Yes |
| regular-expression | The regular expression used to extract new fields from the given test field. If a new field name exists, it will replace the original field. | Yes |
The regular expression is used to match the whole text field of each document with Java regex engine. Each named capture group in the expression will become a new STRING field.
Example 1: Create new field
The example shows how to create new field host for each document. host will be the hostname after @ in email field. Parsing a null field will return an empty string.
os> source=accounts | parse email '.+@(?<host>.+)' | fields email, host ;
fetched rows / total rows = 4/4
| host | |
|---|---|
| amberduke@pyrami.com | pyrami.com |
| hattiebond@netagy.com | netagy.com |
| null | null |
| daleadams@boink.com | boink.com |
Example 2: Override the existing field
The example shows how to override the existing address field with street number removed.
os> source=accounts | parse address '\d+ (?<address>.+)' | fields address ;
fetched rows / total rows = 4/4
| address |
|---|
| Holmes Lane |
| Bristol Street |
| Madison Street |
| Hutchinson Court |
Example 3: Filter and sort be casted parsed field
The example shows how to sort street numbers that are higher than 500 in address field.
os> source=accounts | parse address '(?<streetNumber>\d+) (?<street>.+)' | where cast(streetNumber as int) > 500 | sort num(streetNumber) | fields streetNumber, street ;
fetched rows / total rows = 3/3
| streetNumber | street |
|---|---|
| 671 | Bristol Street |
| 789 | Madison Street |
| 880 | Holmes Lane |
Limitations
A few limitations exist when using the parse command:
- Fields defined by parse cannot be parsed again. For example,
source=accounts | parse address '\d+ (?<street>.+)' | parse street '\w+ (?<road>\w+)' ;will fail to return any expressions. - Fields defined by parse cannot be overridden with other commands. For example, when entering
source=accounts | parse address '\d+ (?<street>.+)' | eval street='1' | where street='1' ;wherewill not match any documents sincestreetcannot be overridden. - The text field used by parse cannot be overridden. For example, when entering
source=accounts | parse address '\d+ (?<street>.+)' | eval address='1' ;streetwill not be parse since address is overridden. - Fields defined by parse cannot be filtered/sorted after using them in the
statscommand. For example,source=accounts | parse email '.+@(?<host>.+)' | stats avg(age) by host | where host=pyrami.com ;wherewill not parse the domain listed.
rename
Use the rename command to rename one or more fields in the search result.
Syntax
rename <source-field> AS <target-field>["," <source-field> AS <target-field>]...
| Field | Description | Required |
|---|---|---|
| source-field | The name of the field that you want to rename. | Yes |
| target-field | The name you want to rename to. | Yes |
Example 1: Rename one field
Rename the account_number field as an:
search source=accounts | rename account_number as an | fields an;
| an |
|---|
| 1 |
| 6 |
| 13 |
| 18 |
Example 2: Rename multiple fields
Rename the account_number field as an and employer as emp:
search source=accounts | rename account_number as an, employer as emp | fields an, emp;
| an | emp |
|---|---|
| 1 | Pyrami |
| 6 | Netagy |
| 13 | Quility |
| 18 | null |
Limitations
The rename command is not rewritten to Energy Logserver DSL, it is only executed on the coordination node.
sort
Use the sort command to sort search results by a specified field.
Syntax
sort [count] <[+|-] sort-field>...
| Field | Description | Required | Default |
|---|---|---|---|
| count | The maximum number results to return from the sorted result. If count=0, all results are returned. | No | 1000 |
| [+|-] | Use plus [+] to sort by ascending order and minus [-] to sort by descending order. | No | Ascending order |
| sort-field | Specify the field that you want to sort by. | Yes | - |
Example 1: Sort by one field
To sort all documents by the age field in ascending order:
search source=accounts | sort age | fields account_number, age;
| account_number | age |
|---|---|
| 13 | 28 |
| 1 | 32 |
| 18 | 33 |
| 6 | 36 |
Example 2: Sort by one field and return all results
To sort all documents by the age field in ascending order and specify count as 0 to get back all results:
search source=accounts | sort 0 age | fields account_number, age;
| account_number | age |
|---|---|
| 13 | 28 |
| 1 | 32 |
| 18 | 33 |
| 6 | 36 |
Example 3: Sort by one field in descending order
To sort all documents by the age field in descending order:
search source=accounts | sort - age | fields account_number, age;
| account_number | age |
|---|---|
| 6 | 36 |
| 18 | 33 |
| 1 | 32 |
| 13 | 28 |
Example 4: Specify the number of sorted documents to return
To sort all documents by the age field in ascending order and specify count as 2 to get back two results:
search source=accounts | sort 2 age | fields account_number, age;
| account_number | age |
|---|---|
| 13 | 28 |
| 1 | 32 |
Example 5: Sort by multiple fields
To sort all documents by the gender field in ascending order and age field in descending order:
search source=accounts | sort + gender, - age | fields account_number, gender, age;
| account_number | gender | age |
|---|---|---|
| 13 | F | 28 |
| 6 | M | 36 |
| 18 | M | 33 |
| 1 | M | 32 |
stats
Use the stats command to aggregate from search results.
The following table lists the aggregation functions and also indicates how each one handles null or missing values:
| Function | NULL | MISSING |
|---|---|---|
| COUNT | Not counted | Not counted |
| SUM | Ignore | Ignore |
| AVG | Ignore | Ignore |
| MAX | Ignore | Ignore |
| MIN | Ignore | Ignore |
Syntax
stats <aggregation>... [by-clause]...
| Field | Description | Required | Default |
|---|---|---|---|
| aggregation | Specify a statistical aggregation function. The argument of this function must be a field. | Yes | 1000 |
| by-clause | Specify one or more fields to group the results by. If not specified, the stats command returns only one row, which is the aggregation over the entire result set. | No | - |
Example 1: Calculate the average value of a field
To calculate the average age of all documents:
search source=accounts | stats avg(age);
| avg(age) |
|---|
| 32.25 |
Example 2: Calculate the average value of a field by group
To calculate the average age grouped by gender:
search source=accounts | stats avg(age) by gender;
| gender | avg(age) |
|---|---|
| F | 28.0 |
| M | 33.666666666666664 |
Example 3: Calculate the average and sum of a field by group
To calculate the average and sum of age grouped by gender:
search source=accounts | stats avg(age), sum(age) by gender;
| gender | avg(age) | sum(age) |
|---|---|---|
| F | 28 | 28 |
| M | 33.666666666666664 | 101 |
Example 4: Calculate the maximum value of a field
To calculate the maximum age:
search source=accounts | stats max(age);
| max(age) |
|---|
| 36 |
Example 5: Calculate the maximum and minimum value of a field by group
To calculate the maximum and minimum age values grouped by gender:
search source=accounts | stats max(age), min(age) by gender;
| gender | min(age) | max(age) |
|---|---|---|
| F | 28 | 28 |
| M | 32 | 36 |
where
Use the where command with a bool expression to filter the search result. The where command only returns the result when the bool expression evaluates to true.
Syntax
where <boolean-expression>
| Field | Description | Required |
|---|---|---|
| bool-expression | An expression that evaluates to a boolean value. | No |
Example: Filter result set with a condition
To get all documents from the accounts index where account_number is 1 or gender is F:
search source=accounts | where account_number=1 or gender=\"F\" | fields account_number, gender;
| account_number | gender |
|---|---|
| 1 | M |
| 13 | F |
head
Use the head command to return the first N number of results in a specified search order.
Syntax
head [N]
| Field | Description | Required | Default |
|---|---|---|---|
| N | Specify the number of results to return. | No | 10 |
Example 1: Get the first 10 results
To get the first 10 results:
search source=accounts | fields firstname, age | head;
| firstname | age |
|---|---|
| Amber | 32 |
| Hattie | 36 |
| Nanette | 28 |
Example 2: Get the first N results
To get the first two results:
search source=accounts | fields firstname, age | head 2;
| firstname | age |
|---|---|
| Amber | 32 |
| Hattie | 36 |
Limitations
The head command is not rewritten to Energy Logserver DSL, it is only executed on the coordination node.
rare
Use the rare command to find the least common values of all fields in a field list.
A maximum of 10 results are returned for each distinct set of values of the group-by fields.
Syntax
rare <field-list> [by-clause]
| Field | Description | Required | ||
|---|---|---|---|---|
| field-list | Specify a comma-delimited list of field names. | No `by-clause` | Specify one or more fields to group the results by. | No |
Example 1: Find the least common values in a field
To find the least common values of gender:
search source=accounts | rare gender;
| gender |
|---|
| F |
| M |
Example 2: Find the least common values grouped by gender
To find the least common age grouped by gender:
search source=accounts | rare age by gender;
| gender | age |
|---|---|
| F | 28 |
| M | 32 |
| M | 33 |
Limitations
The rare command is not rewritten to Energy Logserver DSL, it is only executed on the coordination node.
top
Use the top command to find the most common values of all fields in the field list.
Syntax
top [N] <field-list> [by-clause]
| Field | Description | Default |
|---|---|---|
| N | Specify the number of results to return. | 10 |
| field-list | Specify a comma-delimited list of field names. | - |
| by-clause | Specify one or more fields to group the results by. | - |
Example 1: Find the most common values in a field
To find the most common genders:
search source=accounts | top gender;
| gender |
|---|
| M |
| F |
Example 2: Find the most common value in a field
To find the most common gender:
search source=accounts | top 1 gender;
| gender |
|---|
| M |
Example 3: Find the most common values grouped by gender
To find the most common age grouped by gender:
search source=accounts | top 1 age by gender;
| gender | age |
|---|---|
| F | 28 |
| M | 32 |
Limitations
The top command is not rewritten to Energy Logserver DSL, it is only executed on the coordination node.
Identifiers
An identifier is an ID to name your database objects, such as index names, field names, aliases, and so on. Energy Logserver supports two types of identifiers: regular identifiers and delimited identifiers.
Regular identifiers
A regular identifier is a string of characters that starts with an ASCII letter (lower or upper case). The next character can either be a letter, digit, or underscore (_). It can’t be a reserved keyword. Whitespace and other special characters are also not allowed.
Energy Logserver supports the following regular identifiers:
- Identifiers prefixed by a dot
.sign. Use to hide an index. For example.opensearch-dashboards. - Identifiers prefixed by an
@sign. Use for meta fields generated by Logstash ingestion. - Identifiers with hyphen
-in the middle. Use for index names with date information. - Identifiers with star
*present. Use for wildcard match of index patterns.
For regular identifiers, you can use the name without any back tick or escape characters.
In this example, source, fields, account_number, firstname, and lastname are all identifiers. Out of these, the source field is a reserved identifier.
SELECT account_number, firstname, lastname FROM accounts;
| account_number | firstname | lastname |
|---|---|---|
| 1 | Amber | Duke |
| 6 | Hattie | Bond |
| 13 | Nanette | Bates |
| 18 | Dale | Adams |
Delimited identifiers
A delimited identifier can contain special characters not allowed by a regular identifier. You must enclose delimited identifiers with back ticks (``). Back ticks differentiate the identifier from special characters.
If the index name includes a dot (.), for example, log-2021.01.11, use delimited identifiers with back ticks to escape it `log-2021.01.11`.
Typical examples of using delimited identifiers:
- Identifiers with reserved keywords.
- Identifiers with a
.present. Similarly,-to include date information. - Identifiers with other special characters. For example, Unicode characters.
To quote an index name with back ticks:
source=`accounts` | fields `account_number`;
| account_number |
|---|
| 1 |
| 6 |
| 13 |
| 18 |
Case sensitivity
Identifiers are case sensitive. They must be exactly the same as what’s stored in Energy Logserver.
For example, if you run source=Accounts, you’ll get an index not found exception because the actual index name is in lower case.
Data types
The following table shows the data types supported by the SQL plugin and how each one maps to SQL and Energy Logserver data types:
| Energy Logserver SQL Type | Energy Logserver Type | SQL Type |
|---|---|---|
| boolean | boolean | BOOLEAN |
| byte | byte | TINYINT |
| short | byte | SMALLINT |
| integer | integer | INTEGER |
| long | long | BIGINT |
| float | float | REAL |
| half_float | float | FLOAT |
| scaled_float | float | DOUBLE |
| double | double | DOUBLE |
| keyword | string | VARCHAR |
| text | text | VARCHAR |
| date | timestamp | TIMESTAMP |
| date_nanos | timestamp | TIMESTAMP |
| ip | ip | VARCHAR |
| date | timestamp | TIMESTAMP |
| binary | binary | VARBINARY |
| object | struct | STRUCT |
| nested | array | STRUCT |
In addition to this list, the SQL plugin also supports the datetime type, though it doesn’t have a corresponding mapping with Energy Logserver or SQL.
To use a function without a corresponding mapping, you must explicitly convert the data type to one that does.
Date and time types
The date and time types represent a time period: DATE, TIME, DATETIME, TIMESTAMP, and INTERVAL. By default, the Energy Logserver DSL uses the date type as the only date-time related type that contains all information of an absolute time point.
To integrate with SQL, each type other than the timestamp type holds part of the time period information. Some functions might have restrictions for the input argument type.
Date
The date type represents the calendar date regardless of the time zone. A given date value is a 24-hour period, but this period varies in different timezones and might have flexible hours during daylight saving programs. The date type doesn’t contain time information and it only supports a range of 1000-01-01 to 9999-12-31.
| Type | Syntax | Range |
|---|---|---|
| date | yyyy-MM-dd | 0001-01-01 to 9999-12-31 |
Time
The time type represents the time of a clock regardless of its timezone. The time type doesn’t contain date information.
| Type | Syntax | Range |
|---|---|---|
| time | hh:mm:ss[.fraction] | 00:00:00.0000000000 to 23:59:59.9999999999 |
Datetime
The datetime type is a combination of date and time. It doesn’t contain timezone information. For an absolute time point that contains date, time, and timezone information, see Timestamp.
| Type | Syntax | Range |
|---|---|---|
| datetime | yyyy-MM-dd hh:mm:ss[.fraction] | 0001-01-01 00:00:00.0000000000 to 9999-12-31 23:59:59.9999999999 |
Timestamp
The timestamp type is an absolute instance independent of timezone or convention. For example, for a given point of time, if you change the timestamp to a different timezone, its value changes accordingly.
The timestamp type is stored differently from the other types. It’s converted from its current timezone to UTC for storage and converted back to its set timezone from UTC when it’s retrieved.
| Type | Syntax | Range |
|---|---|---|
| timestamp | yyyy-MM-dd hh:mm:ss[.fraction] | 0001-01-01 00:00:01.9999999999 UTC to 9999-12-31 23:59:59.9999999999 |
Interval
The interval type represents a temporal duration or a period.
| Type | Syntax |
|---|---|
| interval | INTERVAL expr unit |
The expr unit is any expression that eventually iterates to a quantity value. It represents a unit for interpreting the quantity, including MICROSECOND, SECOND, MINUTE, HOUR, DAY, WEEK, MONTH, QUARTER, and YEAR. The INTERVAL keyword and the unit specifier are not case sensitive.
The interval type has two classes of intervals: year-week intervals and day-time intervals.
- Year-week intervals store years, quarters, months, and weeks.
- Day-time intervals store days, hours, minutes, seconds, and microseconds.
Convert between date and time types
Apart from the interval type, all date and time types can be converted to each other. The conversion might alter the value or cause some information loss. For example, when extracting the time value from a datetime value, or converting a date value to a datetime value, and so on.
The SQL plugin supports the following conversion rules for each of the types:
Convert from date
- Because the
datevalue doesn’t have any time information, conversion to thetimetype isn’t useful and always returns a zero time value of00:00:00. - Converting from
datetodatetimehas a data fill-up due to the lack of time information. It attaches the time00:00:00to the original date by default and forms adatetimeinstance. For example, conversion of2020-08-17to adatetimetype is2020-08-17 00:00:00. - Converting to
timestamptype alternates both thetimevalue and thetimezoneinformation. It attaches the zero time value00:00:00and the session timezone (UTC by default) to the date. For example, conversion of2020-08-17to adatetimetype with a session timezone UTC is2020-08-17 00:00:00 UTC.
Convert from time
- You cannot convert the
timetype to any other date and time types because it doesn’t contain any date information.
Convert from datetime
- Converting
datetimetodateextracts the date value from thedatetimevalue. For example, conversion of2020-08-17 14:09:00to adatetype is2020-08-08. - Converting
datetimetotimeextracts the time value from thedatetimevalue. For example, conversion of2020-08-17 14:09:00to atimetype is14:09:00. - Because the
datetimetype doesn’t contain timezone information, converting totimestamptype fills up the timezone value with the session timezone. For example, conversion of2020-08-17 14:09:00(UTC) to atimestamptype is2020-08-17 14:09:00 UTC.
Convert from timestamp
- Converting from a
timestamptype to adatetype extracts the date value and converting to atimetype extracts the time value. Converting from atimestamptype todatetimetype extracts only thedatetimevalue and leaves out the timezone value. For example, conversion of2020-08-17 14:09:00UTC to adatetype is2020-08-17, to atimetype is14:09:00, and to adatetimetype is2020-08-17 14:09:00.
Functions
You must enable fielddata in the document mapping for most string functions to work properly.
The specification shows the return type of the function with a generic type T as the argument.
For example, abs(number T) -> T means that the function abs accepts a numerical argument of type T, which could be any subtype of the number type, and it returns the actual type of T as the return type.
The SQL plugin supports the following common functions shared across the SQL and PPL languages.
Mathematical
| Function | Specification | Example |
|---|---|---|
| abs | abs(number T) -> T | SELECT abs(0.5) |
| add | add(number T, number T) -> T | SELECT add(1, 5) |
| cbrt | cbrt(number T) -> double | SELECT cbrt(8) |
| ceil | ceil(number T) -> T | SELECT ceil(0.5) |
| conv | conv(string T, integer, integer) -> string | SELECT conv('2C', 16, 10), conv(1111, 2, 10) |
| crc32 | crc32(string) -> string | SELECT crc32('MySQL') |
| divide | divide(number T, number T) -> T | SELECT divide(1, 0.5) |
| e | e() -> double | SELECT e() |
| exp | exp(number T) -> double | SELECT exp(0.5) |
| expm1 | expm1(number T) -> double | SELECT expm1(0.5) |
| floor | floor(number T) -> long | SELECT floor(0.5) |
| ln | ln(number T) -> double | SELECT ln(10) |
| log | log(number T) -> double OR log(number T, number T) -> double | SELECT log(10), SELECT log(2, 16) |
| log2 | log2(number T) -> double | SELECT log2(10) |
| log10 | log10(number T) -> double | SELECT log10(10) |
| mod | mod(number T, number T) -> T | SELECT mod(2, 3) |
| modulus | modulus(number T, number T) -> T | SELECT modulus(2, 3) |
| multiply | multiply(number T, number T) -> T | SELECT multiply(2, 3) |
| pi | pi() -> double | SELECT pi() |
| pow | pow(number T, number T) -> double | SELECT pow(2, 3) |
| power | power(number T, number T) -> double | SELECT power(2, 3) |
| rand | rand() -> float OR rand(number T) -> float | SELECT rand(), SELECT rand(0.5) |
| rint | rint(number T) -> double | SELECT rint(1.5) |
| round | round(number T) -> T OR round(number T, integer) -> T | SELECT round(1.5), SELECT round(1.175, 2) |
| sign | sign(number T) -> integer | SELECT sign(1.5) |
| signum | signum(number T) -> integer | SELECT signum(0.5) |
| sqrt | sqrt(number T) -> double | SELECT sqrt(0.5) |
| strcmp | strcmp(string T, string T) -> integer | SELECT strcmp('hello', 'hello world') |
| subtract | subtract(number T, number T) -> T | SELECT subtract(3, 2) |
| truncate | truncate(number T, number T) -> T | SELECT truncate(56.78, 1) |
| + | number T + number T -> T | SELECT 1 + 5 |
| - | number T - number T -> T | SELECT 3 - 2 |
| * | number T * number T -> T | SELECT 2 * 3 |
| / | number T / number T -> T | SELECT 1 / 0.5 |
| % | number T % number T -> T | SELECT 2 % 3 |
Trigonometric
| Function | Specification | Example |
|---|---|---|
| acos | acos(number T) -> double | SELECT acos(0.5) |
| asin | asin(number T) -> double | SELECT asin(0.5) |
| atan | atan(number T) -> double | SELECT atan(0.5) |
| atan2 | atan2(number T, number T) -> double | SELECT atan2(1, 0.5) |
| cos | cos(number T) -> double | SELECT cos(0.5) |
| cosh | cosh(number T) -> double | SELECT cosh(0.5) |
| cot | cot(number T) -> double | SELECT cot(0.5) |
| degrees | degrees(number T) -> double | SELECT degrees(0.5) |
| radians | radians(number T) -> double | SELECT radians(0.5) |
| sin | sin(number T) -> double | SELECT sin(0.5) |
| sinh | sinh(number T) -> double | SELECT sinh(0.5) |
| tan | tan(number T) -> double | SELECT tan(0.5) |
Date and time
Functions marked with * are only available in SQL.
| Function | Specification | Example |
|---|---|---|
| adddate | adddate(date, INTERVAL expr unit) -> date | SELECT adddate(date('2020-08-26'), INTERVAL 1 hour) |
| addtime | addtime(date, date) -> date | SELECT addtime(date('2008-12-12'), date('2008-12-12')) |
| convert_tz | convert_tz(date, string, string) -> date | SELECT convert_tz('2008-12-25 05:30:00', '+00:00', 'America/Los_Angeles') |
| curtime | curtime() -> time | SELECT curtime() |
| curdate | curdate() -> date | SELECT curdate() |
| current_date | current_date() -> date | SELECT current_date() |
| current_time | current_time() -> time | SELECT current_time() |
| current_timestamp | current_timestamp() -> date | SELECT current_timestamp() |
| date | date(date) -> date | SELECT date('2000-01-02') |
| datediff | datediff(date, date) -> integer | SELECT datediff(date('2000-01-02'), date('2000-01-01')) |
| datetime | datetime(string) -> datetime | SELECT datetime('2008-12-25 00:00:00') |
| date_add | date_add(date, INTERVAL integer UNIT) | SELECT date_add('2020-08-26', INTERVAL 1 HOUR) |
| date_format | date_format(date, string) -> string OR date_format(date, string, string) -> string | SELECT date_format(date('2020-08-26'), 'Y') |
| date_sub | date_sub(date, INTERVAL expr unit) -> date | SELECT date_sub(date('2008-01-02'), INTERVAL 31 day) |
| dayofmonth | dayofmonth(date) -> integer | SELECT dayofmonth(date('2001-05-07')) |
| day | day(date) -> integer | SELECT day(date('2020-08-25')) |
| dayname | dayname(date) -> string | SELECT dayname(date('2020-08-26')) |
| dayofmonth | dayofmonth(date) -> integer | SELECT dayofmonth(date('2020-08-26')) |
| dayofweek | dayofweek(date) -> integer | SELECT dayofweek(date('2020-08-26')) |
| dayofyear | dayofyear(date) -> integer | SELECT dayofyear(date('2020-08-26')) |
| dayofweek | dayofweek(date) -> integer | SELECT dayofweek(date('2020-08-26')) |
| day_of_month\* | day_of_month(date) -> integer | SELECT day_of_month(date('2020-08-26')) |
| day_of_week\* | day_of_week(date) -> integer | SELECT day_of_week(date('2020-08-26')) |
| day_of_year\* | day_of_year(date) -> integer | SELECT day_of_year(date('2020-08-26')) |
| extract\* | extract(part FROM date) -> integer | SELECT extract(MONTH FROM datetime('2020-08-26 10:11:12')) |
| from_days | from_days(N) -> integer | SELECT from_days(733687) |
| from_unixtime | from_unixtime(N) -> date | SELECT from_unixtime(1220249547) |
| get_format | get_format(PART, string) -> string | SELECT get_format(DATE, 'USA') |
| hour | hour(time) -> integer | SELECT hour(time '01:02:03') |
| hour_of_day\* | hour_of_day(time) -> integer | SELECT hour_of_day(time '01:02:03') |
| last_day\* | last_day(date) -> integer | SELECT last_day(date('2020-08-26')) |
| localtime | localtime() -> date | SELECT localtime() |
| localtimestamp | localtimestamp() -> date | SELECT localtimestamp() |
| makedate | makedate(double, double) -> date | SELECT makedate(1945, 5.9) |
| maketime | maketime(integer, integer, integer) -> date | SELECT maketime(1, 2, 3) |
| microsecond | microsecond(expr) -> integer | SELECT microsecond(time '01:02:03.123456') |
| minute | minute(expr) -> integer | SELECT minute(time '01:02:03') |
| minute_of_day\* | minute_of_day(expr) -> integer | SELECT minute_of_day(time '01:02:03') |
| minute_of_hour\* | minute_of_hour(expr) -> integer | SELECT minute_of_hour(time '01:02:03') |
| month | month(date) -> integer | SELECT month(date('2020-08-26')) |
| month_of_year\* | month_of_year(date) -> integer | SELECT month_of_year(date('2020-08-26')) |
| monthname | monthname(date) -> string | SELECT monthname(date('2020-08-26')) |
| now | now() -> date | SELECT now() |
| period_add | period_add(integer, integer) | SELECT period_add(200801, 2) |
| period_diff | period_diff(integer, integer) | SELECT period_diff(200802, 200703) |
| quarter | quarter(date) -> integer | SELECT quarter(date('2020-08-26')) |
| second | second(time) -> integer | SELECT second(time '01:02:03') |
| second_of_minute\* | second_of_minute(time) -> integer | SELECT second_of_minute(time '01:02:03') |
| sec_to_time\* | sec_to_time(integer) -> date | SELECT sec_to_time(10000) |
| subdate | subdate(date, INTERVAL expr unit) -> date, datetime | SELECT subdate(date('2008-01-02'), INTERVAL 31 day) |
| subtime | subtime(date, date) -> date | SELECT subtime(date('2008-12-12'), date('2008-11-15')) |
| str_to_date\* | str_to_date(string, format) -> date | SELECT str_to_date("01,5,2013", "%d,%m,%Y") |
| time | time(expr) -> time | SELECT time('13:49:00') |
| timediff | timediff(time, time) -> time | SELECT timediff(time('23:59:59'), time('13:00:00')) |
| timestamp | timestamp(date) -> date | SELECT timestamp('2001-05-07 00:00:00') |
| timestampadd | timestampadd(interval, integer, (date)) -> date | SELECT timestampadd(DAY, 17, datetime('2000-01-01 00:00:00')) |
| timestampdiff | timestampdiff(interval, date, date) -> integer | SELECT timestampdiff(YEAR, '1997-01-01 00:00:00', '2001-03-06 00:00:00') |
| time_format | time_format(date, string) -> string | SELECT time_format('1998-01-31 13:14:15.012345', '%f %H %h %I %i %p %r %S %s %T') |
| time_to_sec | time_to_sec(time) -> long | SELECT time_to_sec(time '22:23:00') |
| to_days | to_days(date) -> long | SELECT to_days(date '2008-10-07') |
| to_seconds | to_seconds(date) -> integer | SELECT to_seconds(date('2008-10-07')) |
| unix_timestamp | unix_timestamp(date) -> double | SELECT unix_timestamp(timestamp('1996-11-15 17:05:42')) |
| utc_date | utc_date() -> date | SELECT utc_date() |
| utc_time | utc_time() -> date | SELECT utc_time() |
| utc_timestamp | utc_timestamp() -> date | SELECT utc_timestamp() |
| week | week(date[mode]) -> integer | SELECT week(date('2008-02-20')) |
| weekofyear | weekofyear(date[mode]) -> integer | SELECT weekofyear(date('2008-02-20')) |
| week_of_year\* | week_of_year(date[mode]) -> integer | SELECT week_of_year(date('2008-02-20')) |
| year | year(date) -> integer | SELECT year(date('2001-07-05')) |
| yearweek\* | yearweek(date[mode]) -> integer | SELECT yearweek(date('2008-02-20')) |
String
| Function | Specification | Example |
|---|---|---|
| ascii | ascii(string) -> integer | SELECT ascii('h') |
| concat | concat(string, string) -> string | SELECT concat('hello', 'world') |
| concat_ws | concat_ws(separator, string, string…) -> string | SELECT concat_ws(" ", "Hello", "World!") |
| left | left(string, integer) -> string | SELECT left('hello', 2) |
| length | length(string) -> integer | SELECT length('hello') |
| locate | locate(string, string, integer) -> integer OR locate(string, string) -> integer | SELECT locate('o', 'hello'), locate('l', 'hello world', 5) |
| replace | replace(string, string, string) -> string | SELECT replace('hello', 'l', 'x') |
| right | right(string, integer) -> string | SELECT right('hello', 2) |
| rtrim | rtrim(string) -> string | SELECT rtrim('hello') |
| substring | substring(string, integer, integer) -> string | SELECT substring('hello', 2, 4) |
| trim | trim(string) -> string | SELECT trim('hello') |
| upper | upper(string) -> string | SELECT upper('hello world') |
Aggregate
| Function | Specification | Example |
|---|---|---|
| avg | avg(number T) -> T | SELECT avg(column) FROM my-index |
| count | count(number T) -> T | SELECT count(date) FROM my-index |
| min | min(number T) -> T | SELECT min(column) FROM my-index |
| show | show(string) -> string | SHOW TABLES LIKE my-index |
Advanced
| Function | Specification | Example |
|---|---|---|
| if | if(boolean, os_type, os_type) -> os_type | `SELECT if(false, 0, 1),if(true, 0, 1) |
| ifnull | ifnull(os_type, os_type) -> os_type | SELECT ifnull(0, 1), ifnull(null, 1) |
| isnull | isnull(os_type) -> integer | SELECT isnull(null), isnull(1) |
Relevance-based search (full-text search)
These functions are only available in the WHERE clause. For their descriptions and usage examples in SQL and PPL, see Full-text search.
Full-text search
Use SQL commands for full-text search. The SQL plugin supports a subset of full-text queries available in Energy Logserver.
Match
Use the MATCH function to search documents that match a string, number, date, or boolean value for a given field.
Syntax
match(field_expression, query_expression[, option=<option_value>]*)
You can specify the following options in any order:
analyzerauto_generate_synonyms_phrasefuzzinessmax_expansionsprefix_lengthfuzzy_transpositionsfuzzy_rewritelenientoperatorminimum_should_matchzero_terms_queryboost
Refer to the match query for parameter descriptions and supported values.
Example 1: Search the message field for the text “this is a test”:
GET my_index/_search
{
"query": {
"match": {
"message": "this is a test"
}
}
}
SQL query:
SELECT message FROM my_index WHERE match(message, "this is a test")
PPL query:
SOURCE=my_index | WHERE match(message, "this is a test") | FIELDS message
Example 2: Search the message field with the operator parameter:
GET my_index/_search
{
"query": {
"match": {
"message": {
"query": "this is a test",
"operator": "and"
}
}
}
}
SQL query:
SELECT message FROM my_index WHERE match(message, "this is a test", operator='and')
PPL query:
SOURCE=my_index | WHERE match(message, "this is a test", operator='and') | FIELDS message
Example 3: Search the message field with the operator and zero_terms_query parameters:
GET my_index/_search
{
"query": {
"match": {
"message": {
"query": "to be or not to be",
"operator": "and",
"zero_terms_query": "all"
}
}
}
}
SQL query:
SELECT message FROM my_index WHERE match(message, "this is a test", operator='and', zero_terms_query='all')
PPL query:
SOURCE=my_index | WHERE match(message, "this is a test", operator='and', zero_terms_query='all') | FIELDS message
Multi-match
To search for text in multiple fields, use MULTI_MATCH function. This function maps to the multi_match query used in search engine, to returns the documents that match a provided text, number, date or boolean value with a given field or fields.
Syntax
The MULTI_MATCH function lets you boost certain fields using ^ character. Boosts are multipliers that weigh matches in one field more heavily than matches in other fields. The syntax allows to specify the fields in double quotes, single quotes, surrounded by backticks, or unquoted. Use star "*" to search all fields. Star symbol should be quoted.
multi_match([field_expression+], query_expression[, option=<option_value>]*)
The weight is optional and is specified after the field name. It could be delimited by the caret character – ^ or by whitespace. Please, refer to examples below:
multi_match(["Tags" ^ 2, 'Title' 3.4, `Body`, Comments ^ 0.3], ...)
multi_match(["*"], ...)
You can specify the following options for MULTI_MATCH in any order:
analyzerauto_generate_synonyms_phrasecutoff_frequencyfuzzinessfuzzy_transpositionslenientmax_expansionsminimum_should_matchoperatorprefix_lengthtie_breakertypeslopzero_terms_queryboost
Please, refer to multi_match query documentation for parameter description and supported values.
For example, REST API search for Dale in either the firstname or lastname fields:
GET accounts/_search
{
"query": {
"multi_match": {
"query": "Lane Street",
"fields": [ "address" ],
}
}
}
could be called from SQL using multi_match function
SELECT firstname, lastname
FROM accounts
WHERE multi_match(['*name'], 'Dale')
or multi_match PPL function
SOURCE=accounts | WHERE multi_match(['*name'], 'Dale') | fields firstname, lastname
| firstname | lastname |
|---|---|
| Dale | Adams |
Query string
To split text based on operators, use the QUERY_STRING function. The QUERY_STRING function supports logical connectives, wildcard, regex, and proximity search.
This function maps to the to the query_string query used in search engine, to return the documents that match a provided text, number, date or boolean value with a given field or fields.
Syntax
The QUERY_STRING function has syntax similar to MATCH_QUERY and lets you boost certain fields using ^ character. Boosts are multipliers that weigh matches in one field more heavily than matches in other fields. The syntax allows to specify the fields in double quotes, single quotes, surrounded by backticks, or unquoted. Use star "*" to search all fields. Star symbol should be quoted.
query_string([field_expression+], query_expression[, option=<option_value>]*)
The weight is optional and is specified after the field name. It could be delimited by the caret character – ^ or by whitespace. Please, refer to examples below:
query_string(["Tags" ^ 2, 'Title' 3.4, `Body`, Comments ^ 0.3], ...)
query_string(["*"], ...)
You can specify the following options for QUERY_STRING in any order:
analyzerallow_leading_wildcardanalyze_wildcardauto_generate_synonyms_phrase_queryboostdefault_operatorenable_position_incrementsfuzzinessfuzzy_rewriteescapefuzzy_max_expansionsfuzzy_prefix_lengthfuzzy_transpositionslenientmax_determinized_statesminimum_should_matchquote_analyzerphrase_slopquote_field_suffixrewritetypetie_breakertime_zone
Example of using query_string in SQL and PPL queries:
The REST API search request
GET accounts/_search
{
"query": {
"query_string": {
"query": "Lane Street",
"fields": [ "address" ],
}
}
}
could be called from SQL
SELECT account_number, address
FROM accounts
WHERE query_string(['address'], 'Lane Street', default_operator='OR')
or from PPL
SOURCE=accounts | WHERE query_string(['address'], 'Lane Street', default_operator='OR') | fields account_number, address
| account_number | address |
|---|---|
| 1 | 880 Holmes Lane |
| 6 | 671 Bristol Street |
| 13 | 789 Madison Street |
Match phrase
To search for exact phrases, use MATCHPHRASE or MATCH_PHRASE functions.
Syntax
matchphrasequery(field_expression, query_expression)
matchphrase(field_expression, query_expression[, option=<option_value>]*)
match_phrase(field_expression, query_expression[, option=<option_value>]*)
The MATCHPHRASE/MATCH_PHRASE functions let you specify the following options in any order:
analyzerslopzero_terms_queryboost
Example of using match_phrase in SQL and PPL queries:
The REST API search request
GET accounts/_search
{
"query": {
"match_phrase": {
"address": {
"query": "880 Holmes Lane"
}
}
}
}
could be called from SQL
SELECT account_number, address
FROM accounts
WHERE match_phrase(address, '880 Holmes Lane')
or PPL
SOURCE=accounts | WHERE match_phrase(address, '880 Holmes Lane') | FIELDS account_number, address
| account_number | address |
|---|---|
| 1 | 880 Holmes Lane |
Simple query string
The simple_query_string function maps to the simple_query_string query in Energy Logserver. It returns the documents that match a provided text, number, date or boolean value with a given field or fields.
The ^ lets you boost certain fields. Boosts are multipliers that weigh matches in one field more heavily than matches in other fields.
Syntax
The syntax allows to specify the fields in double quotes, single quotes, surrounded by backticks, or unquoted. Use star "*" to search all fields. Star symbol should be quoted.
simple_query_string([field_expression+], query_expression[, option=<option_value>]*)
The weight is optional and is specified after the field name. It could be delimited by the caret character – ^ or by whitespace. Please, refer to examples below:
simple_query_string(["Tags" ^ 2, 'Title' 3.4, `Body`, Comments ^ 0.3], ...)
simple_query_string(["*"], ...)
You can specify the following options for SIMPLE_QUERY_STRING in any order:
analyze_wildcardanalyzerauto_generate_synonyms_phrase_queryboostdefault_operatorflagsfuzzy_max_expansionsfuzzy_prefix_lengthfuzzy_transpositionslenientminimum_should_matchquote_field_suffix
Example of using simple_query_string in SQL and PPL queries:
The REST API search request
GET accounts/_search
{
"query": {
"simple_query_string": {
"query": "Lane Street",
"fields": [ "address" ],
}
}
}
could be called from SQL
SELECT account_number, address
FROM accounts
WHERE simple_query_string(['address'], 'Lane Street', default_operator='OR')
or from PPL
SOURCE=accounts | WHERE simple_query_string(['address'], 'Lane Street', default_operator='OR') | fields account_number, address
| account_number | address |
|---|---|
| 1 | 880 Holmes Lane |
| 6 | 671 Bristol Street |
| 13 | 789 Madison Street |
Match phrase prefix
To search for phrases by given prefix, use MATCH_PHRASE_PREFIX function to make a prefix query out of the last term in the query string.
Syntax
match_phrase_prefix(field_expression, query_expression[, option=<option_value>]*)
The MATCH_PHRASE_PREFIX function lets you specify the following options in any order:
analyzerslopmax_expansionszero_terms_queryboost
Example of using match_phrase_prefix in SQL and PPL queries:
The REST API search request
GET accounts/_search
{
"query": {
"match_phrase_prefix": {
"author": {
"query": "Alexander Mil"
}
}
}
}
could be called from SQL
SELECT author, title
FROM books
WHERE match_phrase_prefix(author, 'Alexander Mil')
or PPL
source=books | where match_phrase_prefix(author, 'Alexander Mil') | fields author, title
| author | title |
|---|---|
| Alan Alexander Milne | The House at Pooh Corner |
| Alan Alexander Milne | Winnie-the-Pooh |
Match boolean prefix
Use the match_bool_prefix function to search documents that match text only for a given field prefix.
Syntax
match_bool_prefix(field_expression, query_expression[, option=<option_value>]*)
The MATCH_BOOL_PREFIX function lets you specify the following options in any order:
minimum_should_matchfuzzinessprefix_lengthmax_expansionsfuzzy_transpositionsfuzzy_rewriteboostanalyzeroperator
Example of using match_bool_prefix in SQL and PPL queries:
The REST API search request
GET accounts/_search
{
"query": {
"match_bool_prefix": {
"address": {
"query": "Bristol Stre"
}
}
}
}
could be called from SQL
SELECT firstname, address
FROM accounts
WHERE match_bool_prefix(address, 'Bristol Stre')
or PPL
source=accounts | where match_bool_prefix(address, 'Bristol Stre') | fields firstname, address
| firstname | address |
|---|---|
| Hattie | 671 Bristol Street |
| Nanette | 789 Madison Street |
Automation
Automations helps you to interconnect different apps with an API with each other to share and manipulate its data without a single line of code. It is an easy to use, user-friendly and highly customizable module, which uses an intuitive user interface for you to design your unique scenarios very fast. A automation is a collection of nodes connected together to automate a process. A automation can be started manually (with the Start node) or by Trigger nodes (e.g. Webhook). When a automation is started, it executes all the active and connected nodes. The automation execution ends when all the nodes have processed their data. You can view your automation executions in the Execution log, which can be helpful for debugging.
Activating a automation Automations that start with a Trigger node or a Webhook node need to be activated in order to be executed. This is done via the Active toggle in the Automation UI. Active automations enable the Trigger and Webhook nodes to receive data whenever a condition is met (e.g., Monday at 10:00, an update in a Trello board) and in turn trigger the automation execution. All the newly created automations are deactivated by default.
Sharing a automation
Automations are saved in JSON format. You can export your automations as JSON files or import JSON files into your system. You can export a automation as a JSON file in two ways:
- Download: Click the Download button under the Automation menu in the sidebar. This will download the automation as a JSON file.
- Copy-Paste: Select all the automation nodes in the Automation UI, copy them (Ctrl + c), then paste them (Ctrl + v) in your desired file. You can import JSON files as automations in two ways:
- Import: Click Import from File or Import from URL under the Automation menu in the sidebar and select the JSON file or paste the link to a automation.
- Copy-Paste: Copy the JSON automation to the clipboard (Ctrl + c) and paste it (Ctrl + v) into the Automation UI.
Automation settings
On each automation, it is possible to set some custom settings and overwrite some of the global default settings from the Automation > Settings menu.
The following settings are available:
- Error Automation: Select an automation to trigger if the current automation fails.
- Timezone: Sets the timezone to be used in the automation. The Timezone setting is particularly important for the Cron Trigger node.
- Save Data Error Execution: If the execution data of the automation should be saved when the automation fails.
- Save Data Success Execution: If the execution data of the automation should be saved when the automation succeeds.
- Save Manual Executions: If executions started from the Automation UI should be saved.
- Save Execution Progress: If the execution data of each node should be saved. If set to “Yes”, the automation resumes from where it stopped in case of an error. However, this might increase latency.
- Timeout Automation: Toggle to enable setting a duration after which the current automation execution should be cancelled.
- Timeout After: Only available when Timeout Automation is enabled. Set the time in hours, minutes, and seconds after which the automation should timeout.
Failed automations
If your automation execution fails, you can retry the execution. To retry a failed automation:
- Open the Executions list from the sidebar.
- For the automation execution you want to retry, click on the refresh icon under the Status column.
- Select either of the following options to retry the execution:
- Retry with currently saved automation: Once you make changes to your automation, you can select this option to execute the automation with the previous execution data.
- Retry with original automation: If you want to retry the execution without making changes to your automation, you can select this option to retry the execution with the previous execution data.
You can also use the Error Trigger node, which triggers a automation when another automation has an error. Once a automation fails, this node gets details about the failed automation and the errors.
Connection
A connection establishes a link between nodes to route data through the automation. A connection between two nodes passes data from one node’s output to another node’s input. Each node can have one or multiple connections.
To create a connection between two nodes, click on the grey dot on the right side of the node and slide the arrow to the grey rectangle on the left side of the following node.
Example
An IF node has two connections to different nodes: one for when the statement is true and one for when the statement is false.
Automations List
This section includes the operations for creating and editing automations.
- New: Create a new automation
- Open: Open the list of saved automations
- Save: Save changes to the current automation
- Save As: Save the current automation under a new name
- Rename: Rename the current automation
- Delete: Delete the current automation
- Download: Download the current automation as a JSON file
- Import from URL: Import a automation from a URL
- Import from File: Import a automation from a local file
- Settings: View and change the settings of the current automation
Credentials
This section includes the operations for creating credentials.
Credentials are private pieces of information issued by apps/services to authenticate you as a user and allow you to connect and share information between the app/service and the n8n node.
- New: Create new credentials
- Open: Open the list of saved credentials
Executions
This section includes information about your automation executions, each completed run of a automation.
You can enabling logging of your failed, successful, and/or manually selected automations using the Automation > Settings page.
Node
A node is an entry point for retrieving data, a function to process data, or an exit for sending data. The data process performed by nodes can include filtering, recomposing, and changing data.
There may be one or several nodes for your API, service, or app. By connecting multiple nodes, you can create simple and complex automations. When you add a node to the Editor UI, the node is automatically activated and requires you to configure it (by adding credentials, selecting operations, writing expressions, etc.).
There are three types of nodes:
- Core Nodes
- Regular Nodes
- Trigger Nodes
Core nodes
Core nodes are functions or services that can be used to control how automations are run or to provide generic API support.
Use the Start node when you want to manually trigger the automation with the Execute Automation button at the bottom of the Editor UI. This way of starting the automation is useful when creating and testing new automations.
If an application you need does not have a dedicated Node yet, you can access the data by using the HTTP Request node or the Webhook node. You can also read about creating nodes and make a node for your desired application.
Regular nodes
Regular nodes perform an action, like fetching data or creating an entry in a calendar. Regular nodes are named for the application they represent and are listed under Regular Nodes in the Editor UI.
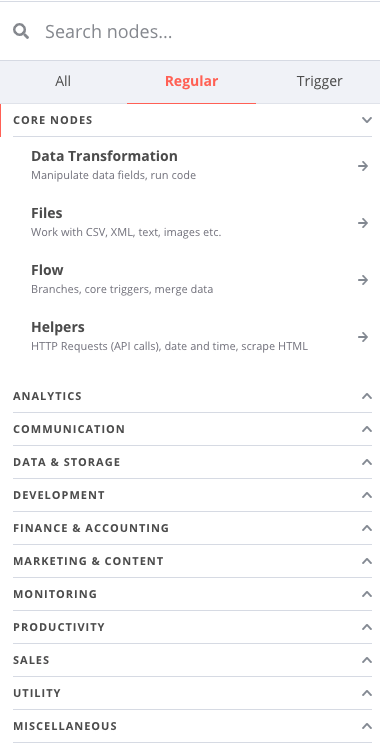
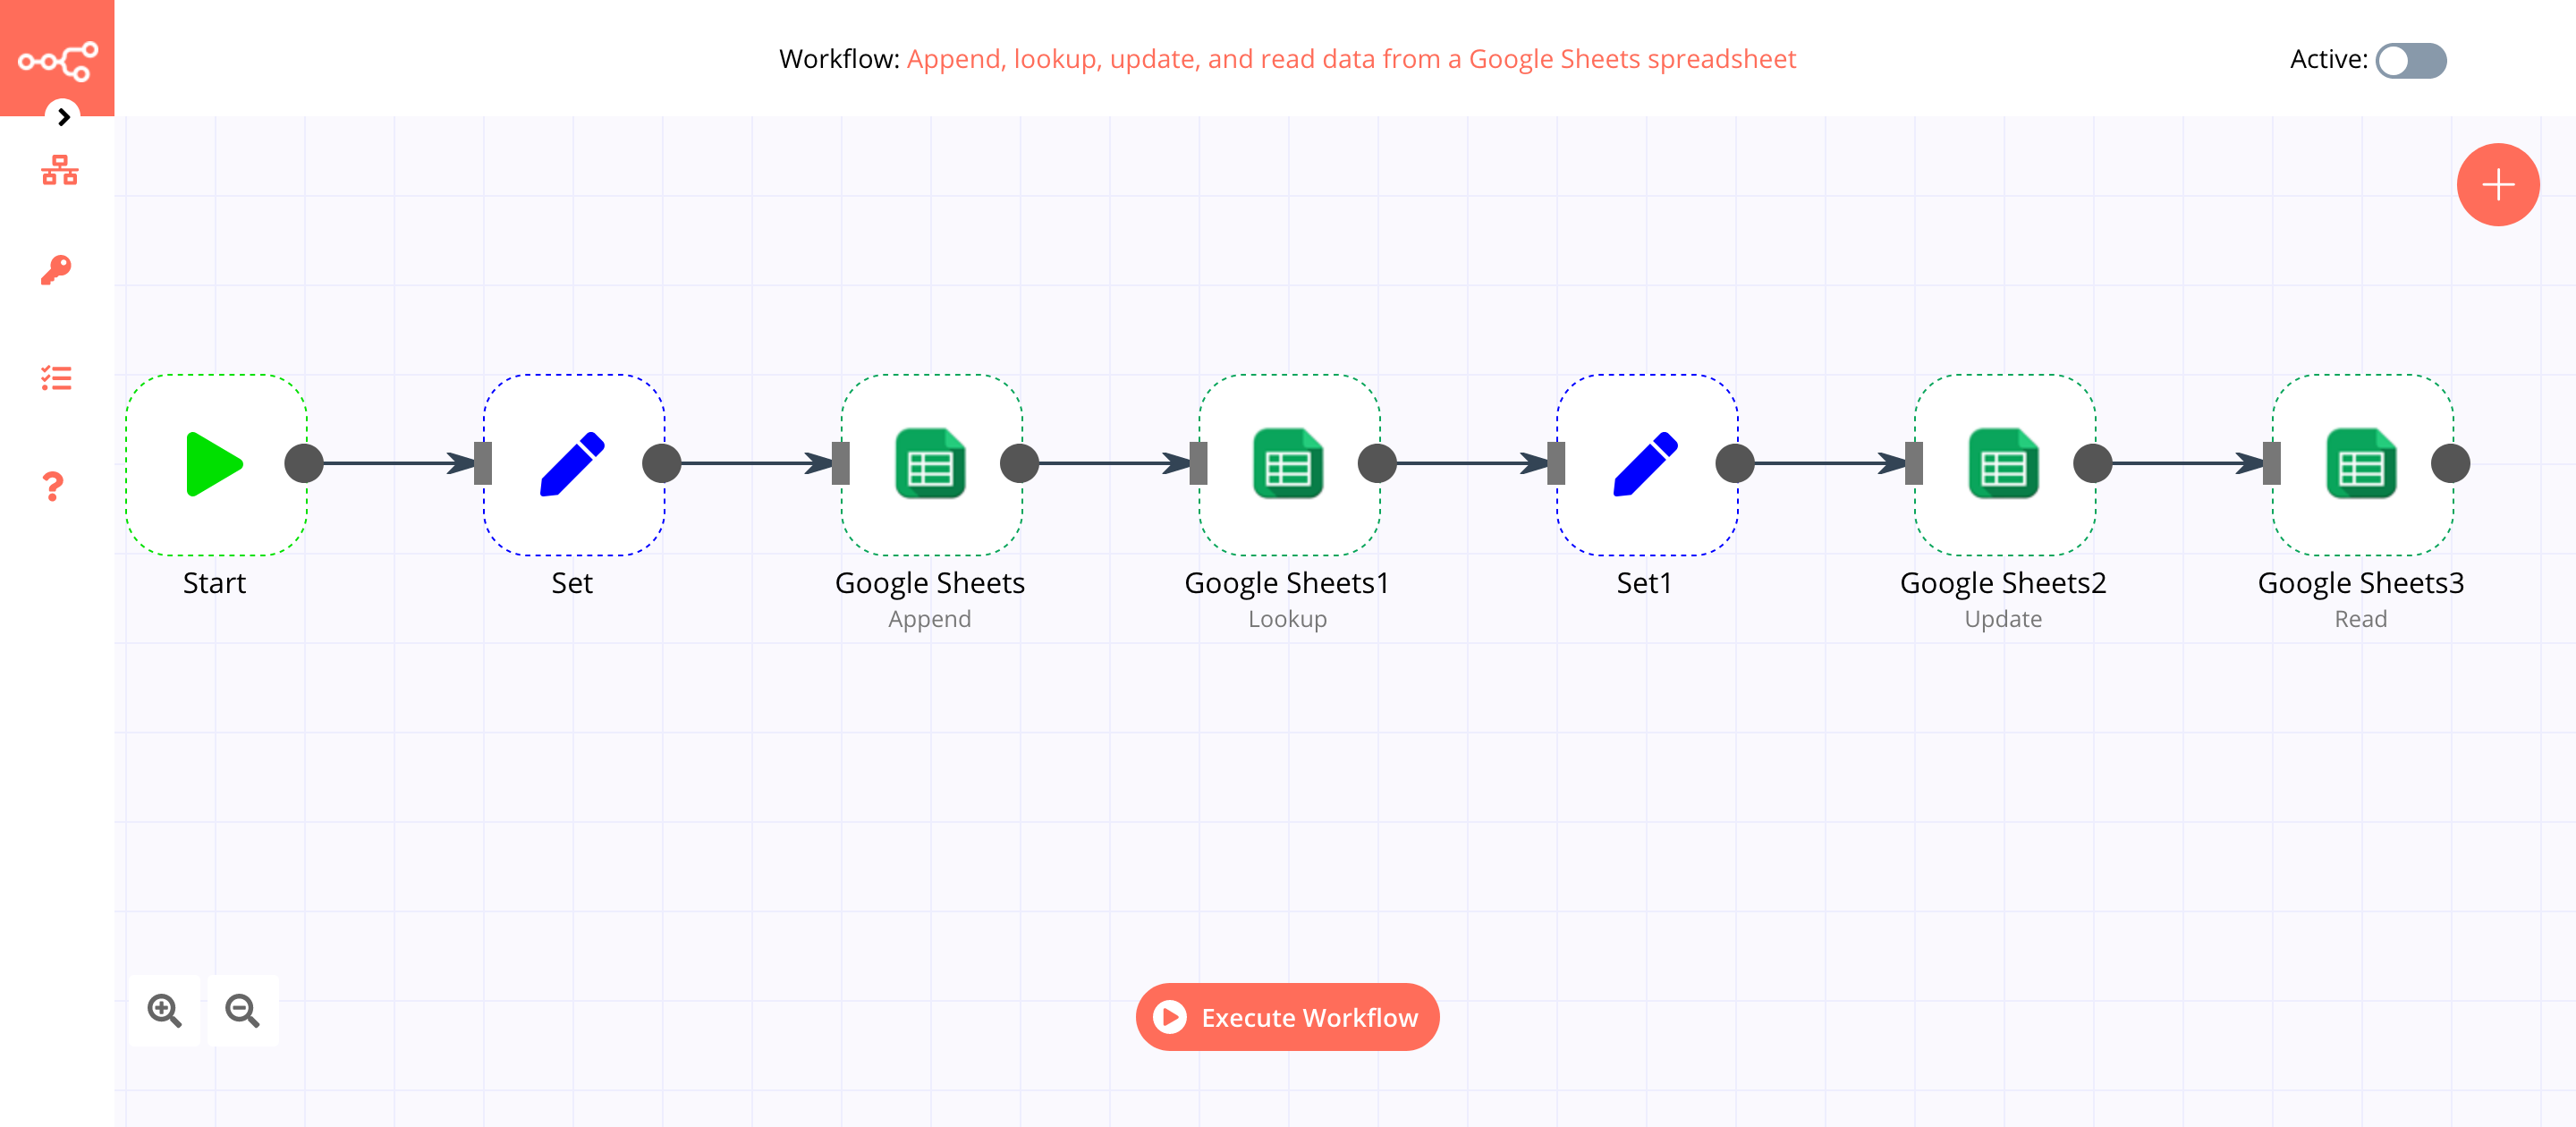
Trigger nodes
Trigger nodes start automations and supply the initial data.
Trigger nodes can be app or core nodes.
- Core Trigger nodes start the automation at a specific time, at a time interval, or on a webhook call. For example, to get all users from a Postgres database every 10 minutes, use the Interval Trigger node with the Postgres node.
- App Trigger nodes start the automation when an event happens in an app. App Trigger nodes are named like the application they represent followed by “Trigger” and are listed under Trigger Nodes in the Editor. For example, a Telegram trigger node can be used to trigger a automation when a message is sent in a Telegram chat.
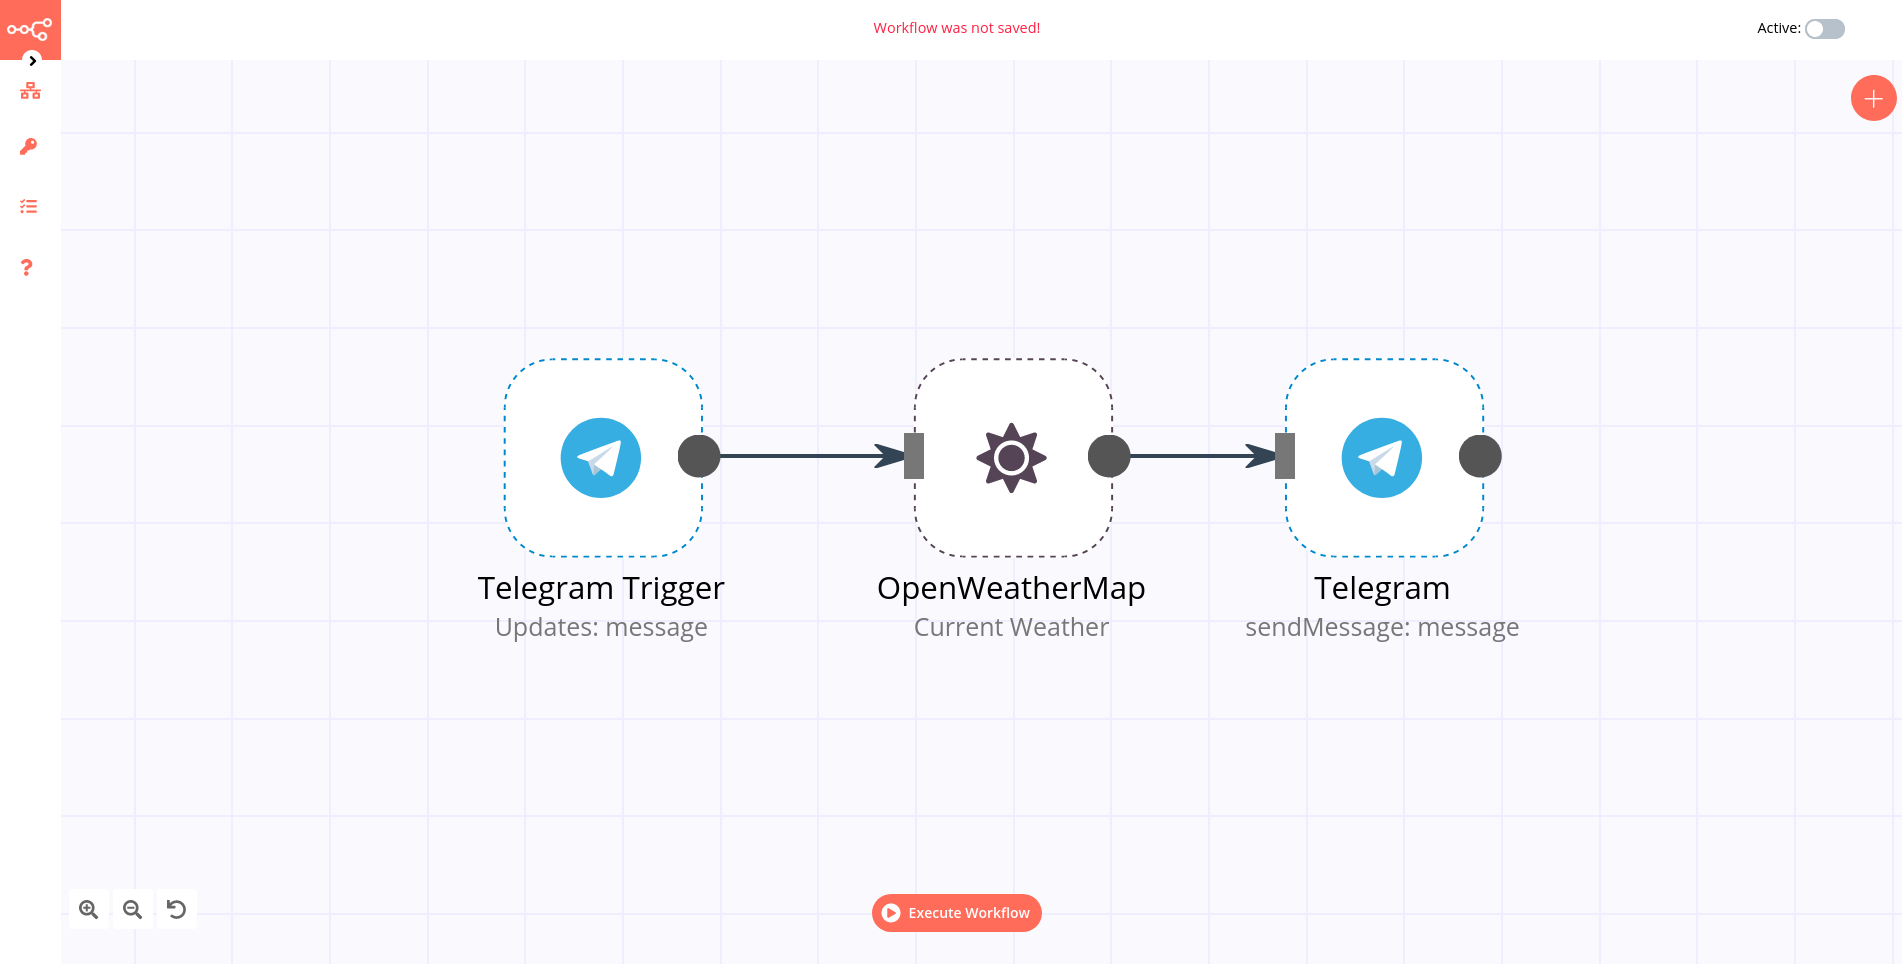
Node settings
Nodes come with global operations and settings, as well as app-specific parameters that can be configured.
Operations
The node operations are illustrated with icons that appear on top of the node when you hover on it:
- Delete: Remove the selected node from the automation
- Pause: Deactivate the selected node
- Copy: Duplicate the selected node
- Play: Run the selected node
To access the node parameters and settings, double-click on the node.
Parameters
The node parameters allow you to define the operations the node should perform. Find the available parameters of each node in the node reference.
Settings
The node settings allow you to configure the look and execution of the node. The following options are available:
- Notes: Optional note to save with the node
- Display note in flow: If active, the note above will be displayed in the automation as a subtitle
- Node Color: The color of the node in the automation
- Always Output Data: If active, the node will return an empty item even if the node returns no data during an initial execution. Be careful setting this on IF nodes, as it could cause an infinite loop.
- Execute Once: If active, the node executes only once, with data from the first item it receives.
- Retry On Fail: If active, the node tries to execute a failed attempt multiple times until it succeeds
- Continue On Fail: If active, the automation continues even if the execution of the node fails. When this happens, the node passes along input data from previous nodes, so the automation should account for unexpected output data.
If a node is not correctly configured or is missing some required information, a warning sign is displayed on the top right corner of the node. To see what parameters are incorrect, double-click on the node and have a look at fields marked with red and the error message displayed in the respective warning symbol.
How to filter events
You can do it in multiple ways. You can use those nodes:
- IF
- Switch
- Spreadsheet File (a lot of conditions - advanced)
Example If usage
If you receive messages from Logstash then you have fields like host.name. You can use if condition to filter known host.
- Create If node
- Click Add condition
- From dropdown menu select String
- As Value 1 type or select a field which you want use. In this example we use expression
{{ $json["host"]["name"] }} - As Value 2 type host name which you want to process. In this example we use paloalto.paseries.test
- Next you can select any other node for further process filtered message.
Example Case usage
- Create Case node
- Select Rules on Mode
- Select String on Data Type
- As Value 1 type or select a field which you want use. In this example we use expression
{{ $json["host"]["name"] }} - Click Add Routing Rule
- As Value 2 type host name which you want to process. In this example, we use paloalto.paseries.test
- As Output type 0.
You can add multiple conditions. On one node you can add 3 conditions if you need more then add to latest output next node and select this node as Fallback Output.
IF
The IF node is used to split a workflow conditionally based on comparison operations.
Node Reference
You can add comparison conditions using the Add Condition dropdown. Conditions can be created based on the data type, the available comparison operations vary for each data type.
Boolean
- Equal
- Not Equal
- Number
Smaller
- Smaller Equal
- Equal
- Not Equal
- Larger
- Larger Equal
- Is Empty
String
- Contains
- Equal
- Not Contains
- Not Equal
- Regex
- Is Empty
You can choose to split a workflow when any of the specified conditions are met, or only when all the specified conditions are met using the options in the Combine dropdown list.
Switch
The Switch node is used to route a workflow conditionally based on comparison operations. It is similar to the IF node, but supports up to four conditional routes.
Node Reference
Mode: This dropdown is used to select whether the conditions will be defined as rules in the node, or as an expression, programmatically.
You can add comparison conditions using the Add Routing Rule dropdown. Conditions can be created based on the data type. The available comparison operations vary for each data type.
Boolean
- Equal
- Not Equal
Number
- Smaller
- Smaller Equal
- Equal
- Not Equal
- Larger
- Larger Equal
String
- Contains
- Equal
- Not Contains
- Not Equal
- Regex
You can route a workflow when none of the specified conditions are met using Fallback Output dropdown list.
Spreadsheet File
The Spreadsheet File node is used to access data from spreadsheet files.
Basic Operations
- Read from file
- Write to file
Node Reference
When writing to a spreadsheet file, the File Format field can be used to specify the format of the file to save the data as.
File Format
- CSV (Comma-separated values)
- HTML (HTML Table)
- ODS (OpenDocument Spreadsheet)
- RTF (Rich Text Format)
- XLS (Excel)
- XLSX (Excel)
Binary Property field: Name of the binary property in which to save the binary data of the spreadsheet file.
Options
- Sheet Name field: This field specifies the name of the sheet from which the data should be read or written to.
- Read As String field: This toggle enables you to parse all input data as strings.
- RAW Data field: This toggle enables you to skip the parsing of data.
- File Name field: This field can be used to specify a custom file name when writing a spreadsheet file to disk.
Automation integration nodes
To boost your automation you can connect with widely external nodes.
List of automation nodes:
- Action Network
- Activation Trigger
- ActiveCampaign
- ActiveCampaign Trigger
- Acuity Scheduling Trigger
- Affinity
- Affinity Trigger
- Agile CRM
- Airtable
- Airtable Trigger
- AMQP Sender
- AMQP Trigger
- APITemplate.io
- Asana
- Asana Trigger
- Automizy
- Autopilot
- Autopilot Trigger
- AWS Comprehend
- AWS DynamoDB
- AWS Lambda
- AWS Rekognition
- AWS S3
- AWS SES
- AWS SNS
- AWS SNS Trigger
- AWS SQS
- AWS Textract
- AWS Transcribe
- Bannerbear
- Baserow
- Beeminder
- Bitbucket Trigger
- Bitly
- Bitwarden
- Box
- Box Trigger
- Brandfetch
- Bubble
- Calendly Trigger
- Chargebee
- Chargebee Trigger
- CircleCI
- Clearbit
- ClickUp
- ClickUp Trigger
- Clockify
- Clockify Trigger
- Cockpit
- Coda
- CoinGecko
- Compression
- Contentful
- ConvertKit
- ConvertKit Trigger
- Copper
- Copper Trigger
- Cortex
- CrateDB
- Cron
- Crypto
- Customer Datastore (n8n training)
- Customer Messenger (n8n training)
- Customer Messenger (n8n training)
- Customer.io
- Customer.io Trigger
- Date & Time
- DeepL
- Demio
- DHL
- Discord
- Discourse
- Disqus
- Drift
- Dropbox
- Dropcontact
- E-goi
- Edit Image
- Elastic Security
- Elasticsearch
- EmailReadImap
- Emelia
- Emelia Trigger
- ERPNext
- Error Trigger
- Eventbrite Trigger
- Execute Command
- Execute Automation
- Facebook Graph API
- Facebook Trigger
- Figma Trigger (Beta)
- FileMaker
- Flow
- Flow Trigger
- Form.io Trigger
- Formstack Trigger
- Freshdesk
- Freshservice
- Freshworks CRM
- FTP
- Function
- Function Item
- G Suite Admin
- GetResponse
- GetResponse Trigger
- Ghost
- Git
- GitHub
- Github Trigger
- GitLab
- GitLab Trigger
- Gmail
- Google Analytics
- Google BigQuery
- Google Books
- Google Calendar
- Google Calendar Trigger
- Google Cloud Firestore
- Google Cloud Natural Language
- Google Cloud Realtime Database
- Google Contacts
- Google Docs
- Google Drive
- Google Drive Trigger
- Google Perspective
- Google Sheets
- Google Slides
- Google Tasks
- Google Translate
- Gotify
- GoToWebinar
- Grafana
- GraphQL
- Grist
- Gumroad Trigger
- Hacker News
- Harvest
- HelpScout
- HelpScout Trigger
- Home Assistant
- HTML Extract
- HTTP Request
- HubSpot
- HubSpot Trigger
- Humantic AI
- Hunter
- iCalendar
- IF
- Intercom
- Interval
- Invoice Ninja
- Invoice Ninja Trigger
- Item Lists
- Iterable
- Jira Software
- Jira Trigger
- JotForm Trigger
- Kafka
- Kafka Trigger
- Keap
- Keap Trigger
- Kitemaker
- Lemlist
- Lemlist Trigger
- Line
- LingvaNex
- Local File Trigger
- Magento 2
- Mailcheck
- Mailchimp
- Mailchimp Trigger
- MailerLite
- MailerLite Trigger
- Mailgun
- Mailjet
- Mailjet Trigger
- Mandrill
- Marketstack
- Matrix
- Mattermost
- Mautic
- Mautic Trigger
- Medium
- Merge
- MessageBird
- Microsoft Dynamics CRM
- Microsoft Excel
- Microsoft OneDrive
- Microsoft Outlook
- Microsoft SQL
- Microsoft Teams
- Microsoft To Do
- Mindee
- MISP
- Mocean
- Monday.com
- MongoDB
- Monica CRM
- Move Binary Data
- MQTT
- MQTT Trigger
- MSG91
- MySQL
- n8n Trigger
- NASA
- Netlify
- Netlify Trigger
- Nextcloud
- No Operation, do nothing
- NocoDB
- Notion (Beta)
- Notion Trigger (Beta)
- One Simple API
- OpenThesaurus
- OpenWeatherMap
- Orbit
- Oura
- Paddle
- PagerDuty
- PayPal
- PayPal Trigger
- Peekalink
- Phantombuster
- Philips Hue
- Pipedrive
- Pipedrive Trigger
- Plivo
- Postgres
- PostHog
- Postmark Trigger
- ProfitWell
- Pushbullet
- Pushcut
- Pushcut Trigger
- Pushover
- QuestDB
- Quick Base
- QuickBooks Online
- RabbitMQ
- RabbitMQ Trigger
- Raindrop
- Read Binary File
- Read Binary Files
- Read PDF
- Redis
- Rename Keys
- Respond to Webhook
- RocketChat
- RSS Read
- Rundeck
- S3
- Salesforce
- Salesmate
- SeaTable
- SeaTable Trigger
- SecurityScorecard
- Segment
- Send Email
- SendGrid
- Sendy
- Sentry.io
- ServiceNow
- Set
- Shopify
- Shopify Trigger
- SIGNL4
- Slack
- sms77
- Snowflake
- Split In Batches
- Splunk
- Spontit
- Spotify
- Spreadsheet File
- SSE Trigger
- SSH
- Stackby
- Start
- Stop and Error
- Storyblok
- Strapi
- Strava
- Strava Trigger
- Stripe
- Stripe Trigger
- SurveyMonkey Trigger
- Switch
- Taiga
- Taiga Trigger
- Tapfiliate
- Telegram
- Telegram Trigger
- TheHive
- TheHive Trigger
- TimescaleDB
- Todoist
- Toggl Trigger
- TravisCI
- Trello
- Trello Trigger
- Twake
- Twilio
- Twist
- Typeform Trigger
- Unleashed Software
- Uplead
- uProc
- UptimeRobot
- urlscan.io
- Vero
- Vonage
- Wait
- Webex by Cisco
- Webex by Cisco Trigger
- Webflow
- Webflow Trigger
- Webhook
- Wekan
- Wise
- Wise Trigger
- WooCommerce
- WooCommerce Trigger
- Wordpress
- Workable Trigger
- Automation Trigger
- Write Binary File
- Wufoo Trigger
- Xero
- XML
- Yourls
- YouTube
- Zendesk
- Zendesk Trigger
- Zoho CRM
- Zoom
- Zulip
Cooperation of logserver and antivirus program
Energy Logserver utilizes a high disk I/O throughput for its typical indexing tasks. Specifically, disk write operations are highly intensive. These I/O writes can conflict with any product that installs a driver intermediary between our software and the operating system, such as antivirus software that scans when the application accesses mass storage.
When running Energy Logserver or its component on a computer with antivirus software installed, it is necessary to exclude all Energy software processes, including directories such as the installation directory, from any kind of scanning when accessing application resources.
Directories to exclude:
/usr/share/elasticsearch
/usr/share/kibana
/usr/share/logstash
/var/lib/kibana
Data directory (default /var/lib/elasticsearch )
/etc/elasticsearch
/etc/kibana
/etc/logstash
/var/log/elasticsearch
/var/log/kibana
/var/log/logstash
Kibana archive directory (default /usr/share/kibana/plugins/archive/archives/ )
/opt/ai
/opt/alert
/opt/cerebro
/opt/e-doc
/opt/intelligence
/opt/license-service
/opt/plugins
/opt/skimmer
/opt/wiki
Elasticsearch temp directory
/var/ossec
Exclude processes related to :
ElasticsearchjavaLogstashnodekibanaalertLicense-service
Wazuh-manager
CerebroE-doc
Intelligence