Creating Integrations with the AI Assistant
The AI Assistant tile in the Integrations catalog opens a creator that builds an integration for a log source the catalog does not cover. You give it sample logs, and it generates a Network Probe pipeline, a dashboard and a set of alerts, then installs them like any other integration.
Before You Start
The license must include the AI Assistant add-on.
You need the
adminrole. Other users can open the creator, but Start stops with Not Authorized under Index name.At least one Network Probe must be registered. The creator deploys the pipeline to every registered probe.
The assistant uses the default connection from AI Assistant > Providers, see AI Assistant.
Prepare a sample file with real logs from the source:
.json,.ndjson,.jsonl,.logor.txt. In a text file each line is one sample.
The assistant sends the selected samples to the AI provider, at most 10 samples and at most 16,000 characters of each. See Data Processing and Privacy.
Creating an Integration
Open Tools > Integrations and click the AI Assistant tile. The creator has five steps. The example below uses a firewall that sends key=value syslog, the same source as in Custom Integration.
Step 1: Configuration
Enter a Name. It can contain letters, digits and spaces.
Optionally upload an Icon file (PNG, JPEG, SVG or WebP, up to 1 MB).
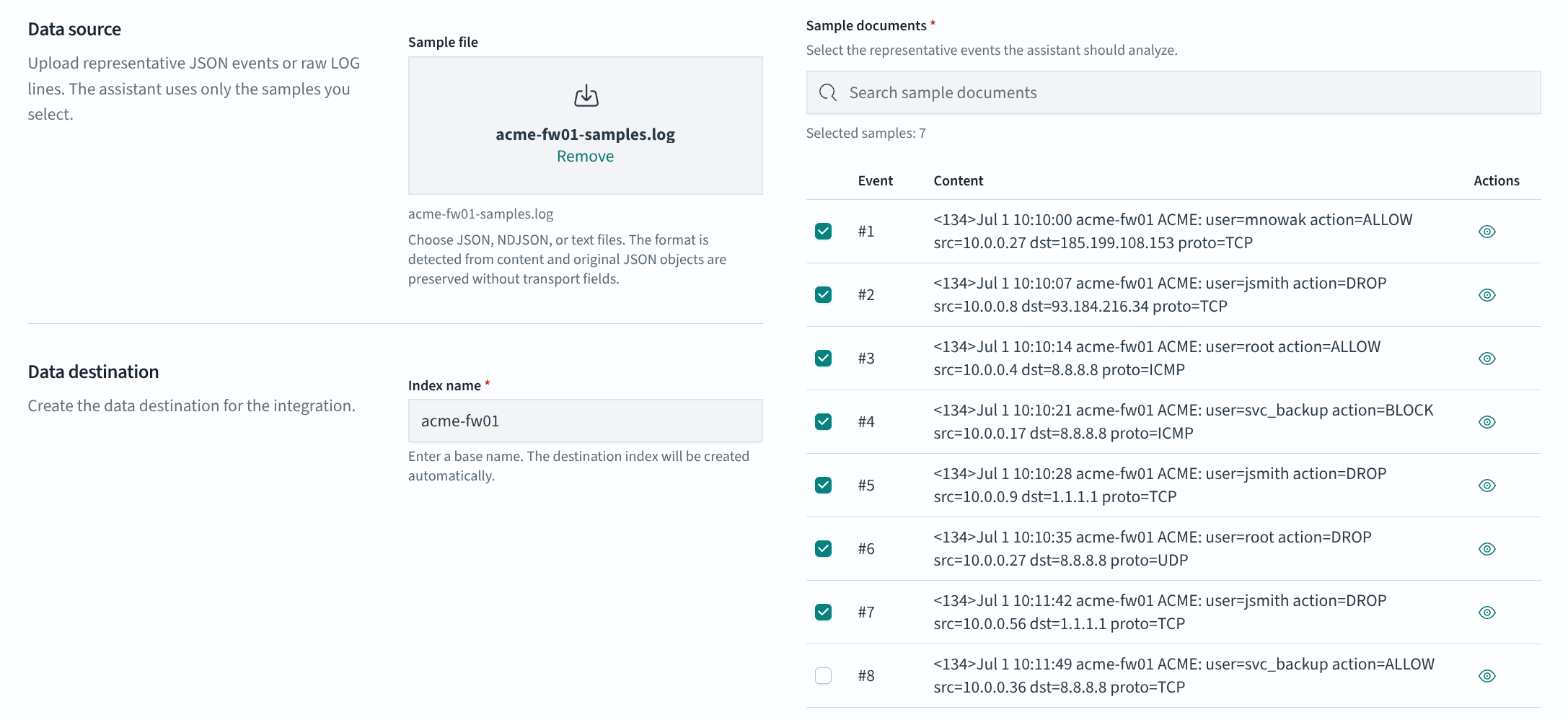
Upload the Sample file and select the samples in Sample documents. The assistant analyzes only the selected samples.
Enter the Index name, for example
acme-fw01.Click Start.
Start creates the index behind an alias with the index name (acme-fw01 points to acme-fw01-2026.09.29-000001), a Data View for the alias, and a draft of the integration.
Step 2: Pipeline
Choose the input, UDP (default) or TCP, and a Port between 1024 and 65535 that is free on every Network Probe.
Click Generate filter. The assistant shows its progress. With 7 samples and the Energy Logserver provider it takes up to a minute; a slower provider takes longer.
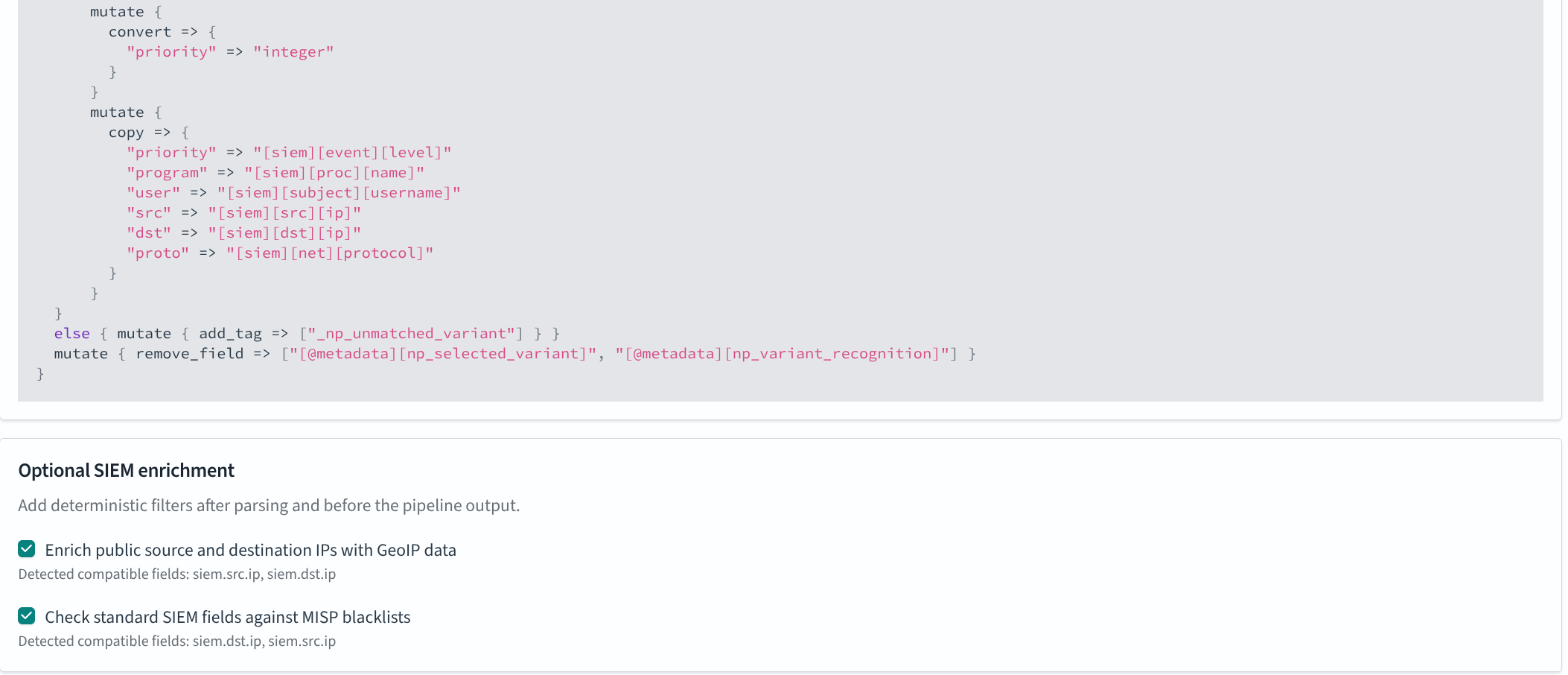
Review the filter. Click Edit to change it, or Add manually to write your own.
Optionally enable GeoIP and MISP blacklists. The creator offers them when the filter produces compatible fields, such as
siem.src.ipandsiem.dst.ip.Click Next.
The assistant maps the fields it recognizes to siem.* (in the example src to siem.src.ip and user to siem.subject.username) and keeps the other fields under their own names. The pipeline always moves message to siem.message at the end.
Check the filter before you continue, because the assistant can return a different filter for the same samples. In the example the date pattern did not match the log, so every event got the _np_parse_failure tag and @timestamp holds the time the probe received the event.
Next opens the port in the firewall of each probe and deploys the pipeline to /etc/logserver-probe/conf.d/<Name>_integration/. If any probe cannot open the port, the creator shows Input port is unavailable, removes the pipeline and closes the port on every probe. Choose another port and click Next again.
The pipeline output writes to the alias with the probe user and the data node address from the Network Probe keystore, which the license service fills in. The generated output contains ssl_certificate_verification => false.
Step 3: Activation
Send an event from the source to the port you chose. The creator checks for new data every 5 seconds and moves on when the first event arrives; Refresh checks immediately. Click Next.
From this step on, Configuration and Pipeline are read-only.
Step 4: Dashboards
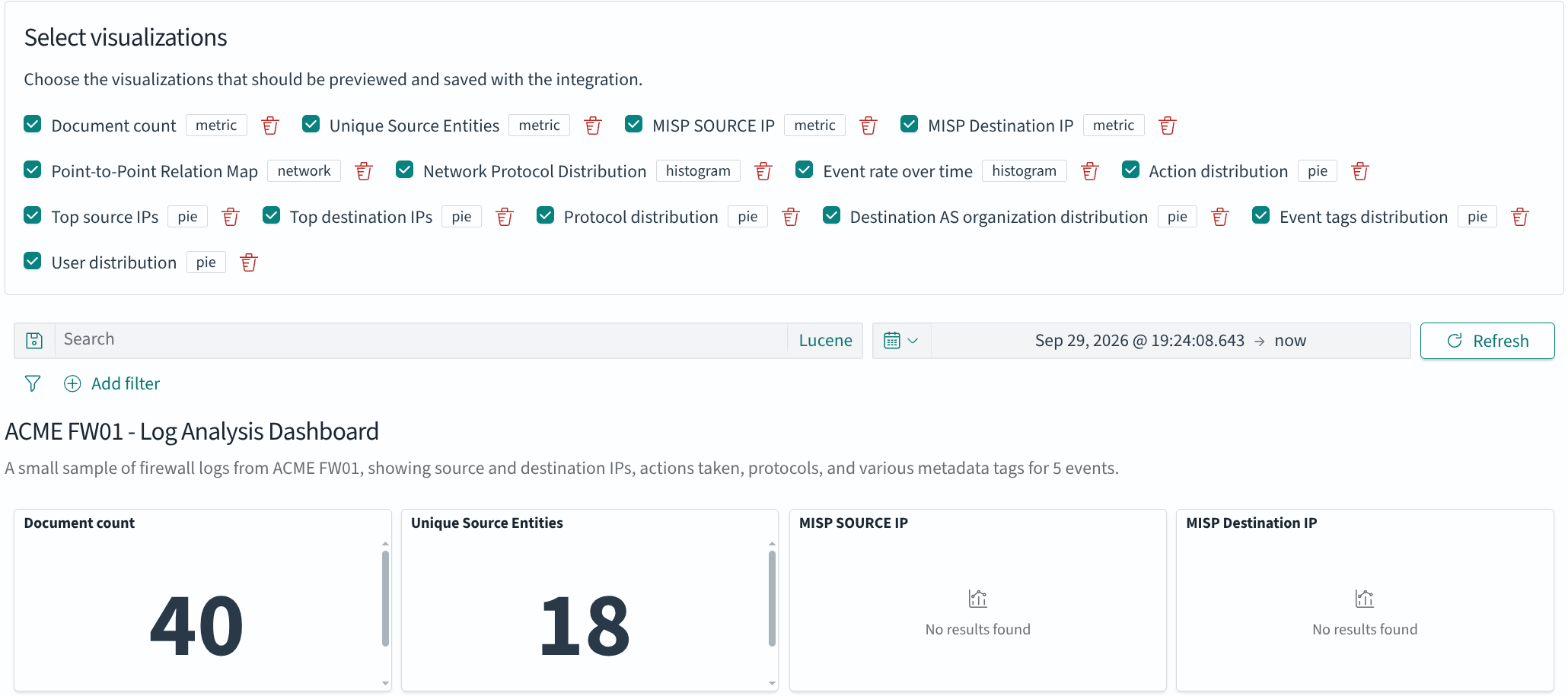
Click Generate dashboard. The assistant proposes panels with a live preview, up to 20. In the example it took about 20 seconds and proposed between 9 and 14 panels in four runs. Choose the panels under Select visualizations and click Next, or click Skip dashboard.
Step 5: Alerts
Select the alerts to install from the list of proposals, for example No logs received, Failed logins or MISP blacklist match. An alert marked AI Alert installs together with its AI use case (Anomaly Detection - Text). Save integration stays disabled until you select at least one alert; Skip alerts saves the integration without alerts.
Click Save integration. The creator saves the integration, removes the draft and runs the One Click installation: Pipelines, Dashboards, Alerts and AI Use Cases. The package is stored in /usr/share/logserver-gui/data/integrations/creator_repository/<Name>/1.0.0/.
Drafts
The creator saves your progress as a draft. The draft tile in the catalog has the Draft badge and the date of the last change; click it to continue from the saved step. Two users can open the same draft, and the one who saves second gets Dashboard progress could not be saved.
Deleting a draft removes the progress, the deployed pipeline and the Data View, and closes the port. The index and its data stay.
Deleting an Integration
Delete the integration from the catalog as described in Deleting Integrations. The pipeline, the package, the dashboard, the alert rules and the AI use case are removed. The open firewall port, the index with its data, the Data View and the dashboard visualizations stay; remove them by hand if you no longer need them.
Known Issues in 8.1.0
Add a visualization in the Dashboards step always fails with This visualization was not added. To add a panel, save the integration, open its dashboard, click Edit > Create new, save the visualization with Save and return, and save the dashboard. Installing the dashboards again from Advanced with Overwrite restores the original panels.
The assistant does not generate new alerts. The Alerts step offers only the listed proposals.