Integrations
The Integrations plugin provides a unified catalog of vendor and protocol integrations that can be deployed into Energy Logserver from the GUI. Each integration bundles the components required to ingest, visualize, and alert on data from a specific source: pipelines for the Network Probe, Discover dashboards, alert rules, and (for some integrations) downloadable collector binaries.
The plugin requires a license with the siem-plan add-on enabled.
Note
Some catalog entries are detection engines or flow collectors that ship bundled with the Network Probe rather than external data sources. Their One Click deployment installs the Energy Logserver side of the pipeline (and, where the integration ships them, dashboards and alerts), but the engine itself still needs host-side setup on the probe. These have dedicated guides: Suricata IDS and Zeek. To account for a host’s own traffic and export it as NetFlow, see pmacct Local Traffic Monitoring.
Catalog Layout
Open the plugin from the sidebar under Tools → Integrations. The catalog page shows:
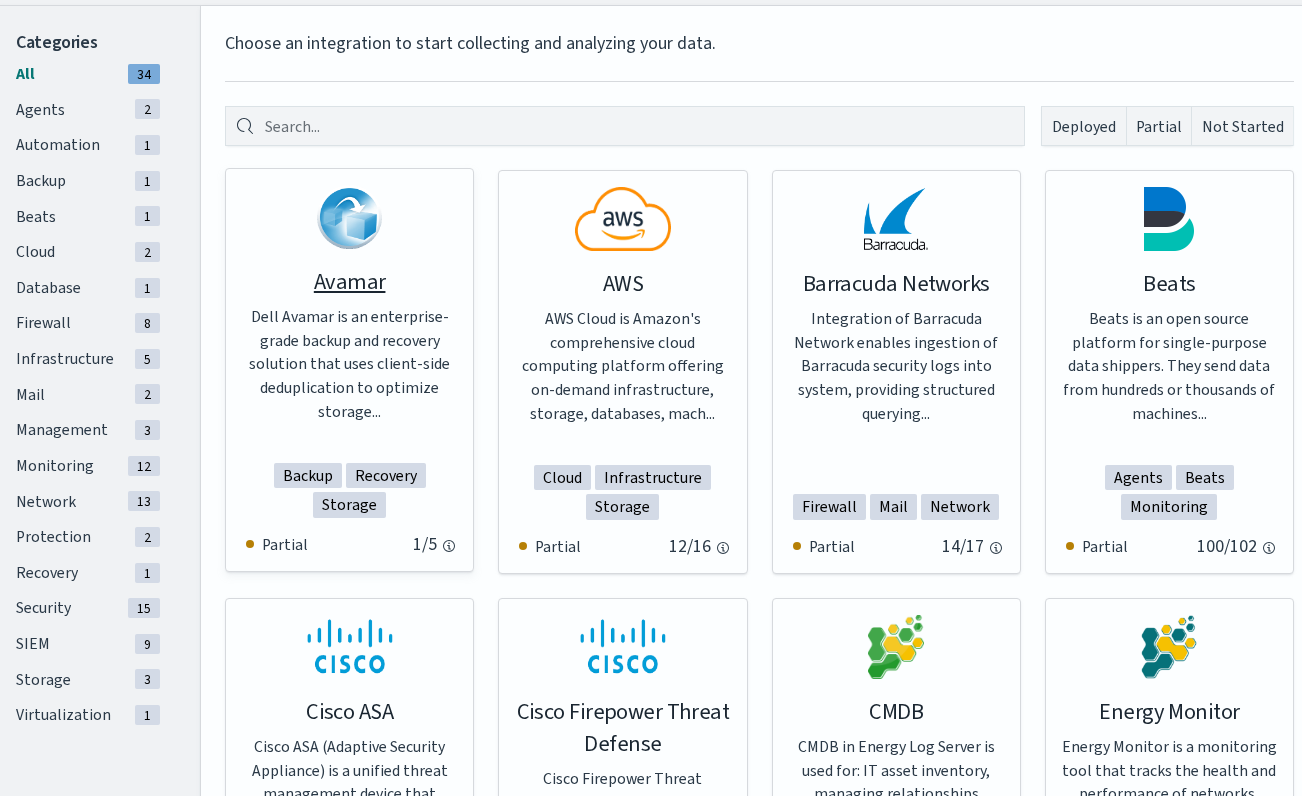
Area |
Purpose |
|---|---|
Categories (left panel) |
Filter the catalog by integration type: |
Search |
Filter the catalog by integration name. |
Status filters |
Restrict the visible cards to those that are Deployed (all components installed), Partial (some components installed or active), or Not Started (nothing installed). |
Integration cards |
One card per integration. Each card shows the icon, name, short description, the categories it belongs to, and the current deployment status. The status counter (for example, Partial 14/17) indicates how many of the integration’s components are currently installed. |
The available integrations are read directly from the product and refresh with each release. Treat the catalog itself as the authoritative list. This chapter does not duplicate the integration names.
For a log source the catalog does not cover, the AI Assistant tile builds a new integration from sample logs. See Creating Integrations with the AI Assistant.
Installation
Each integration can be installed in one of two modes, exposed as buttons on the integration’s wizard page:
One Click installs every component of the integration in a single action. Use this mode for the default deployment.
Advanced opens a step-by-step wizard that lets you select pipelines, dashboards, alert rules, and (when applicable) agents to install or skip individually.
Note
The Agents step in the Integrations wizard refers to collector binaries shipped with the selected integration, such as Beats agents delivered with a pre-generated configuration. It is not related to the Agents module (MasterAgent) described in Agents.
Choosing an Integration
Open Tools → Integrations in the sidebar.
Use the search box, the category filters, or the status filters (
Deployed,Partial,Not Started) to locate the integration.Click the integration card. The wizard page opens with two buttons in the top-right corner: Advanced and One Click.
One Click Installation
The One Click button installs every component of the integration in a single action: Network Probe pipelines, Discover dashboards, alert rules, and (for integrations that ship them) collector binaries.
The wizard page shows the current state of each component group as a checklist. After clicking One Click, every item that is not already installed is deployed, and the indicators update to show the new component counts. Each step title is a link that opens the same step in the Advanced wizard.
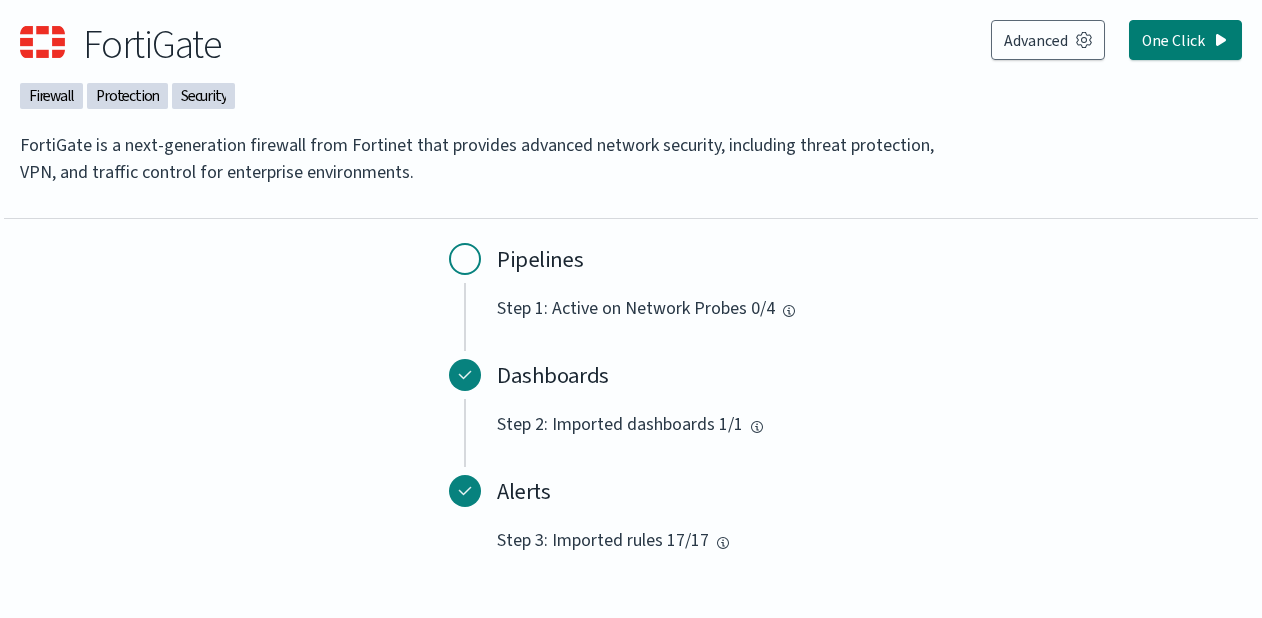
In the example above, the Dashboards (1/1) and Alerts (17/17) are already deployed, and only the Pipelines step (0/4) remains. Clicking One Click would activate the integration’s pipeline on all four Network Probes registered in the cluster.
If One Click stops at the pipeline step with certificate signature failure, the cause is inconsistent license-service certificates rather than the integration itself, and it affects every integration installed this way. See Network Probe Troubleshooting.
Advanced Installation
The Advanced button opens a numbered wizard. Each step lets you select the components to install for that group, then choose Install to apply or Skip to move on without installing. Steps that have nothing to install are marked complete automatically.
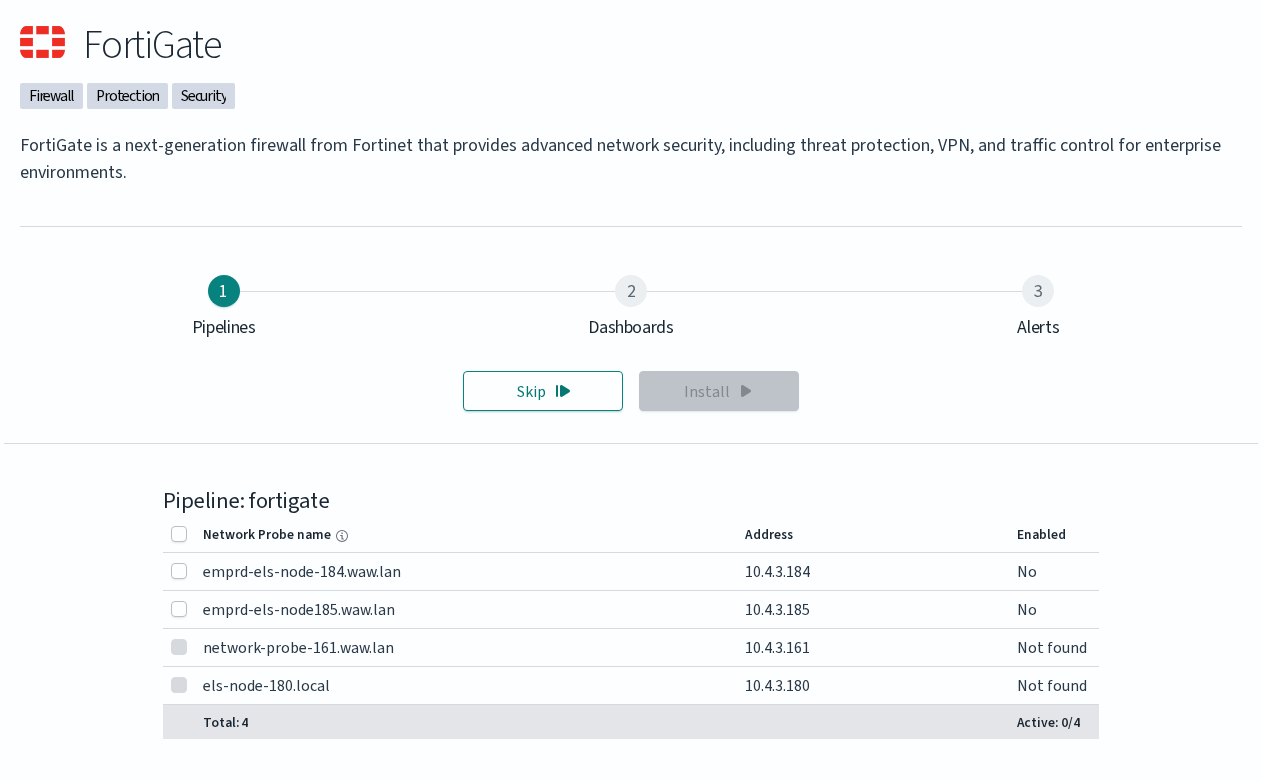
The wizard exposes three steps for most integrations:
Step |
What it installs |
|---|---|
1. Pipelines |
Activates the integration’s Network Probe pipeline on the probes you select. The table lists every Network Probe in the cluster with its address and current activation status ( |
2. Dashboards |
Imports the integration’s Discover dashboards. |
3. Alerts |
Imports the integration’s alert rules. |
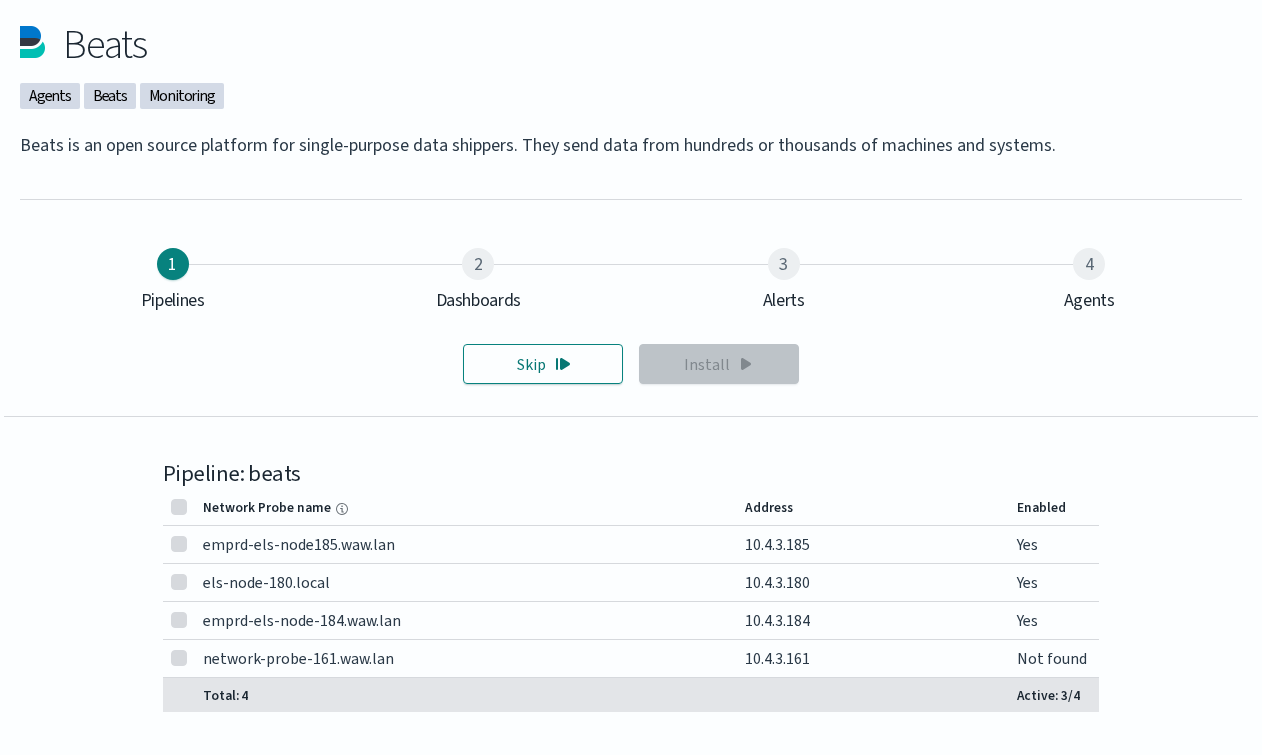
Some integrations expose additional steps:
Step |
What it installs |
|---|---|
Agents |
Lets you download the collector binaries shipped with the integration (for example, Beats agents) together with a configuration file generated for your cluster. The download is delivered to your local machine; the actual installation on the source host is performed manually by the administrator. |
Index Management |
Imports the integration’s index management policies, such as a data retention action, which then run from the Scheduler. |
The Agents step is shown only for integrations that bundle a collector, and the Index Management step only for integrations that ship policies. FortiGate and Tenable Security Center, for example, have only the three standard steps.
Deleting Integrations
Click Delete above the catalog, click Select on each integration to remove, click Confirm, and confirm in the dialog. Deleting an integration removes its Network Probe pipeline, dashboards and alert rules. A system integration can be re-enabled later from the Integrations page. An integration created with the AI Assistant is deleted permanently, with its configuration files.
Manual Configuration
A small set of integrations can be deployed without the GUI wizard by editing the Network Probe pipeline files directly. This route fits environments without GUI access and scripted deployments. Tenable.sc and QualysGuard are documented here because they require manual credentials and endpoint configuration that the wizard does not collect.
The procedure for both integrations follows the same shape:
Enable the pipeline in the Network Probe configuration. Edit
/etc/logserver-probe/pipelines.ymland uncomment the relevant block:For Tenable.sc:
- pipeline.id: tenable.sc
  path.config: "/etc/logserver-probe/conf.d/tenable.sc/*.conf"
For QualysGuard:
- pipeline.id: qualys
  path.config: "/etc/logserver-probe/conf.d/qualys/*.conf"
Configure the connection to the scanner manager by editing the integration’s
main.pyfile.For Tenable.sc, edit
/etc/logserver-probe/conf.d/tenable.sc/venv/main.py:TENABLE_ADDR: IP address and port of the Tenable.sc managerTENABLE_CRED: username and passwordNETWORK_PROBE_ADDR: IP address and port of the Network Probe
Example:
TENABLE_ADDR = ('10.4.3.204', 443)
TENABLE_CRED = ('admin', 'password')
NETWORK_PROBE_ADDR = ('127.0.0.1', 10000)
For QualysGuard, edit
/etc/logserver-probe/conf.d/qualys/venv/main.py:NETWORK_PROBE_ADDR: IP address and port of the Network Probehostname: address of the QualysGuard managerusernameandpassword: credentials for the QualysGuard manager
Example:
NETWORK_PROBE_ADDR = ('127.0.0.1', 10001)

conn = qualysapi.connect(
    username="admin",
    password="password",
    hostname="qualysguard.qg2.apps.qualys.eu"
)
Restart the Network Probe service to apply the changes:
systemctl restart logserver-probe
The collected data appears in the integration’s dashboards ([Vulnerability] Overview Tenable for Tenable.sc, [Vulnerability] Overview Qualys for QualysGuard) once the pipeline runs and indexes its first results.