Discover
Index Pattern Configuration
Before you can explore data in Discover, you must configure an index pattern.
First Time Setup
If you log in to Energy Logserver for the first time, you must specify the Index to be searched. You can enter the name of your index, indicate a specific index from a given day, or use the asterisk (*) to match all indexes matching a specific index pattern.
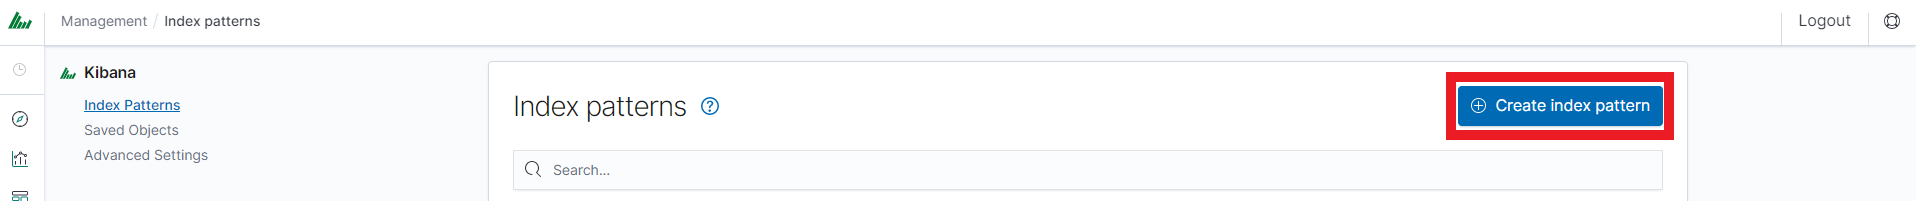
After logging in to the application click the button “Set up index pattern” to add a new index pattern:
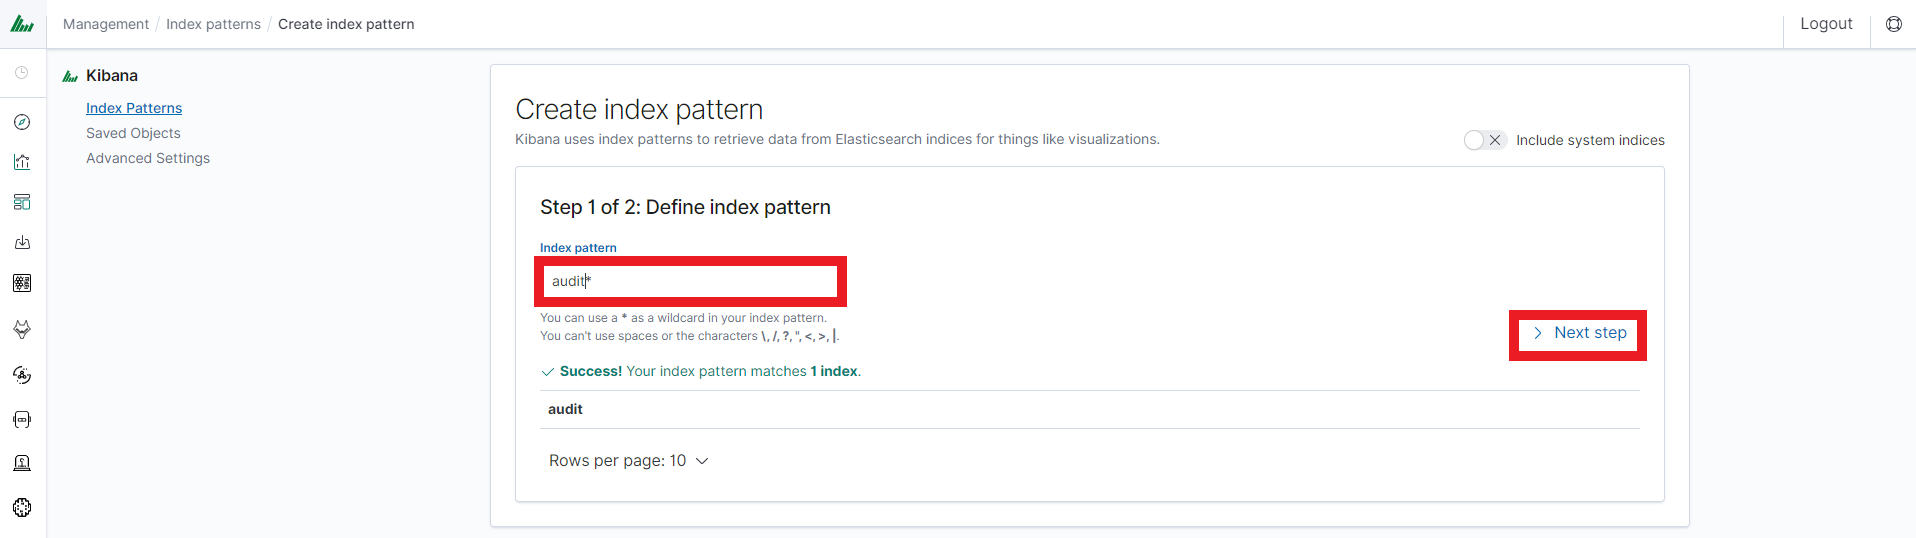
In the “Index pattern” field enter the name of the index or index pattern (after confirming that the index or sets of indexes exist) and click the “Next step” button.
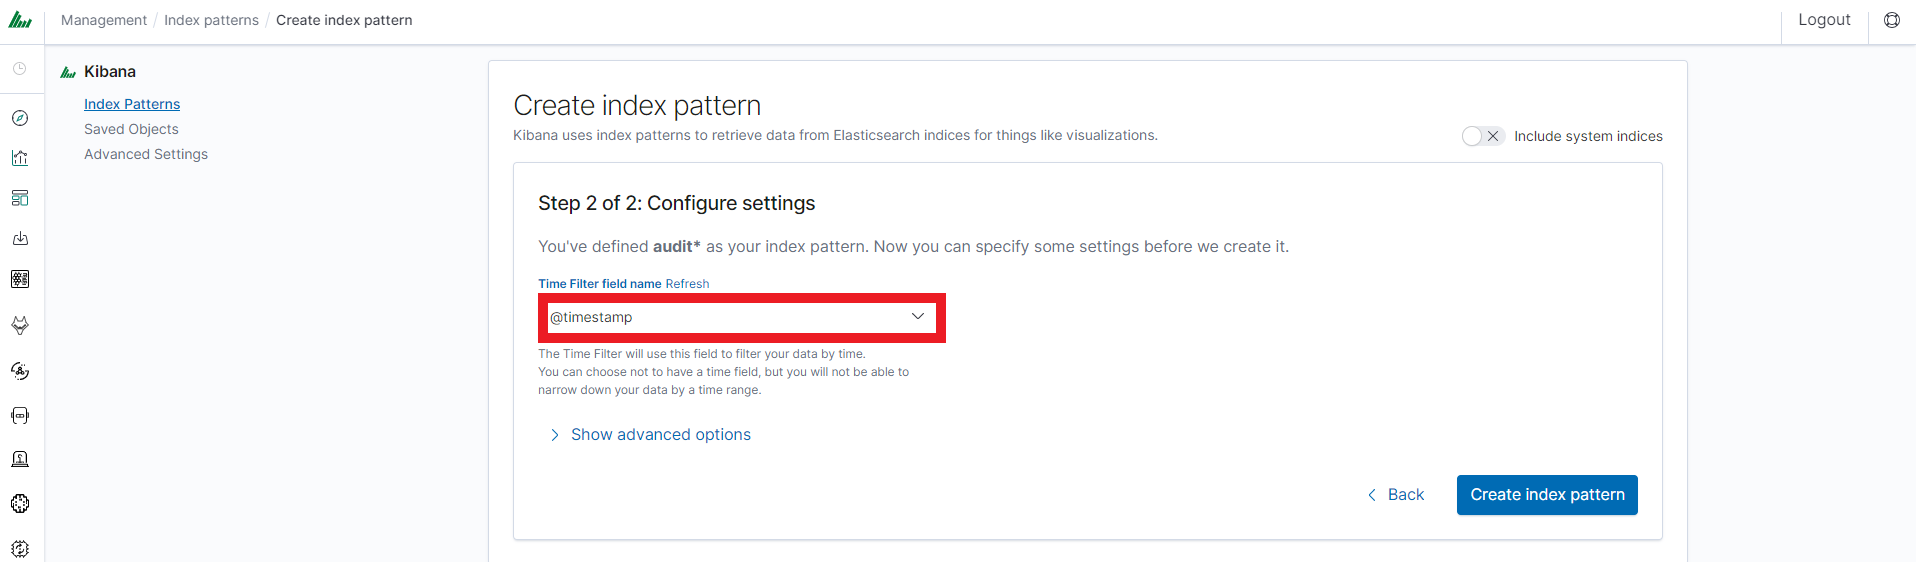
In the next step, from a drop-down menu select the “Time filter field name”, after which individual events should be sorted. By default the timestamp is set, which is the time of occurrence of the event. Depending on your preferences, it may also be the time of indexing or another field available in the event.
At any time, you can add more indexes or index patterns by going to the main tab selecting “Management” and next selecting “Index Patterns”.
Index Selection
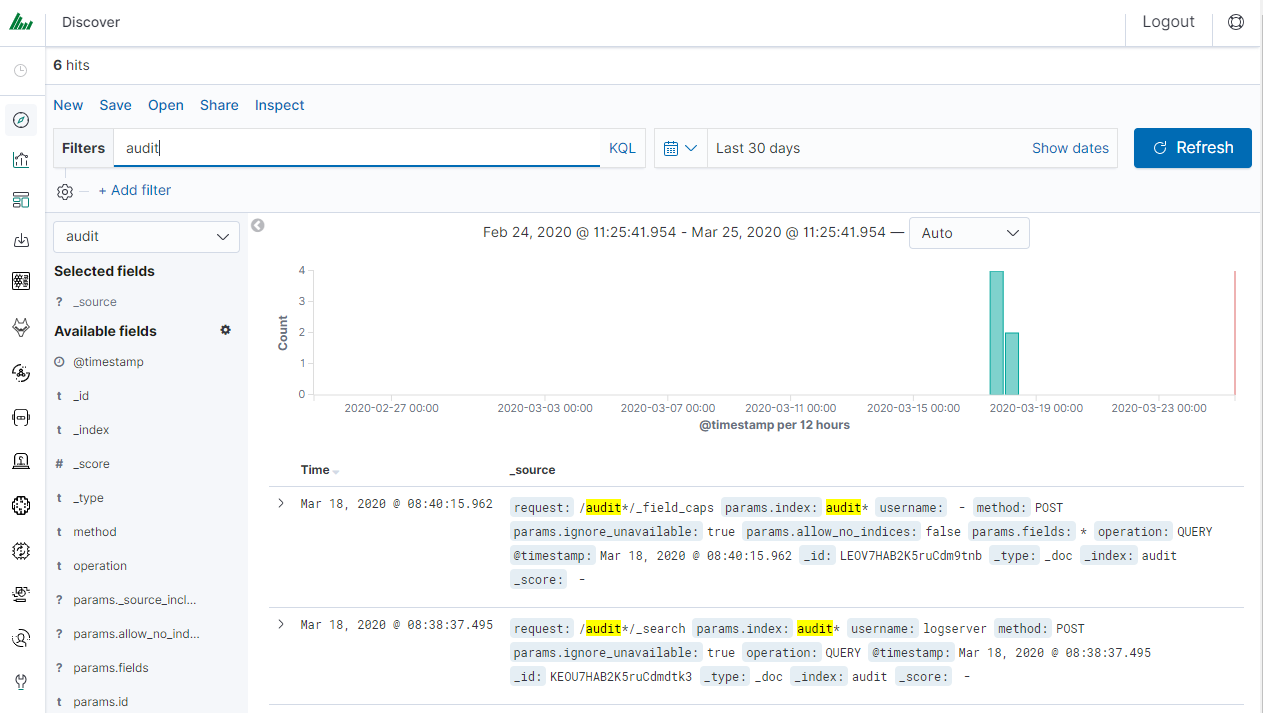
After logging into Energy Logserver, you will be taken to the “Discover” tab, where you can interactively explore your data. You have access to every document in every index that matches the selected index patterns.
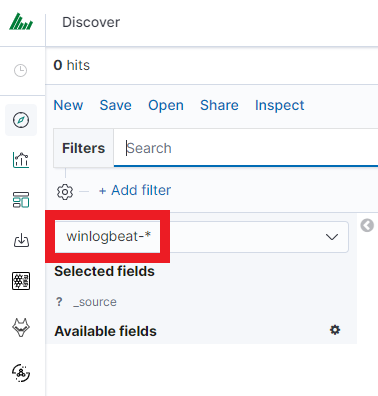
If you want to change the selected index, click the drop-down menu with the name of the current index pattern in the left panel. Clicking on an entry from the expanded list will change the searched index.
Time settings and refresh
In the upper right corner, there is a section that defines the range of time that Energy Logserver will search in terms of conditions contained in the search bar. The default value is the last 15 minutes.
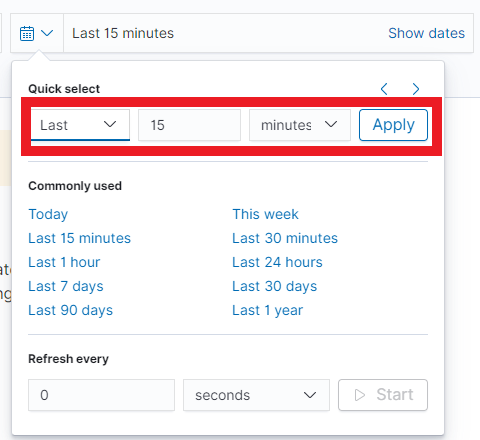
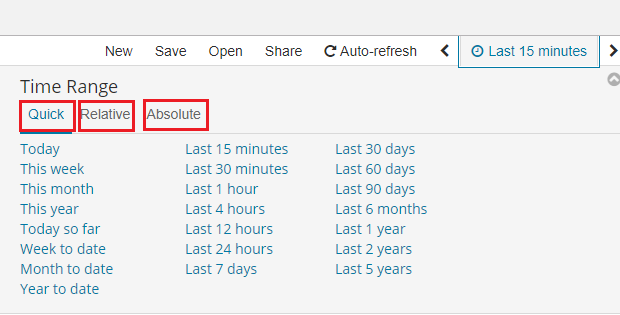
After clicking this selection, you can adjust the scope of the search by selecting one of the three tabs in the drop-down window:
Absolute: using two calendars you define the exact start and end time for which the search results are to be returned.
Relative: in this window specify a relative time offset (e.g., 4 hours ago) from which Energy Logserver should search for data. You can also enable the “Round to the hour” option for approximate time ranges.
Now: sets the time boundary to the current moment.
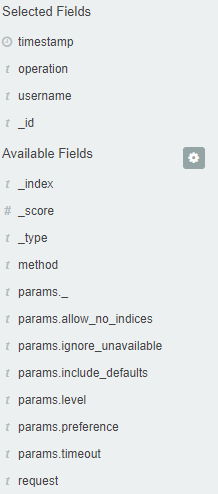
Fields
Energy Logserver recognizes fields in the body of searched events
that can be used to create more precise queries. The extracted
fields are visible in the left panel. They are divided into three types:
timestamp, marked on the clock icon; text, marked with the letter “t” , and digital, marked with a hashtag
 .
.
Point to a field and click the icon  to transfer it to the “Selected Fields” column. In the place of events, a table with the selected columns is created. In the “Selected Fields” selection you can also delete specific fields from the table by clicking
  on the selected element.
Filtering and syntax building
Use the query bar to search for interesting events. For example, after entering the word “error”, all events that contain the word will be displayed, additionally highlighting them with a yellow background.
Syntax
Fields can be used similarly by defining conditions that interest you. The syntax of such queries is:
fields_name:<fields_value>
Example:
status:500
This query will display all events that contain the “status” fields with a value of 500.
Filters
The field value does not have to be a single, specific value. For digital fields you can specify a range in the following scheme:
fields_name:[<range_from> TO <range_to>]
Example:
status:[500 TO 599]
This query will return events with status fields that are in the range 500 to 599.
Operators
The search language used in Energy Logserver allows you to use logical operators “AND”, “OR” and “NOT”, which are key and necessary to build more complex queries.
AND is used to combine expressions, e.g.
error AND "access denied". If an event contains only one expression or the worderroranddeniedbut not the word access, then it will not be displayed.OR is used to search for the events that contain one OR other expression, e.g.
status:500 OR denied. This query will display events that contain the word “denied” or a status field value of 500. Energy Logserver uses this operator by default, so query"status:500" "denied"would return the same results.NOT is used to exclude the following expression e.g. “status:[500 TO 599] NOT status:505” will display all events that have a status field, and the value of the field is between 500 and 599 but will eliminate from the result events whose status field value is exactly 505.
The above methods can be combined by building even more complex queries. Understanding how they work and combining them is the basis for effective searching and full use of Energy Logserver.
Example of query built from connected logical operations:
status:[500 TO 599] AND ("access denied" OR error) NOT status:505
Returns in the results all events for which the value of status fields are in the range of 500 to 599, simultaneously contain the word “access denied” or “error”, omitting those events for which the status field value is 505.
Wildcards
Wildcard searches can be run on individual terms, using ? to replace a single character, and * to replace zero or more characters:
qu?ck bro*
Be aware that wildcard queries can use an enormous amount of memory and perform very badly — just think how many terms need to be queried to match the query string “a* b* c*”.
Regular expressions
Regular expression patterns can be embedded in the query string by wrapping them in forward-slashes (“/”):
name:/joh?n(ath[oa]n)/
Fuzziness
You can run fuzzy queries using the ~ operator:
quikc~ brwn~ fox~
For these queries, the query string is normalized. If present, only certain filters from the analyzer are applied.
The query uses the Damerau-Levenshtein distance to find all terms with a maximum of two changes, where a change is the insertion, deletion, or substitution of a single character or transposition of two adjacent characters.
The default edit distance is 2, but an edit distance of 1 should be sufficient to catch 80% of all human misspellings. It can be specified as:
quikc~1
Proximity searches
While a phrase query (e.g. “john smith”) expects all of the terms in the same order, a proximity query allows the specified words to be further apart or in a different order. In the same way that fuzzy queries can specify a maximum edit distance for characters in a word, a proximity search allows us to specify a maximum edit distance of words in a phrase:
"fox quick"~5
The closer the text in a field is to the original order specified in the query string, the more relevant that document is considered to be. When compared to the above example query, the phrase “quick fox” would be considered more relevant than “quick brown fox”.
Ranges
Ranges can be specified for date, numeric, or string fields. Inclusive ranges are specified with square brackets [min TO max] and exclusive ranges with curly brackets {min TO max}.
All days in 2012:
date:[2012-01-01 TO 2012-12-31]Numbers 1…5
count:[1 TO 5]Tags between alpha and omega, excluding alpha and omega:
tag:{alpha TO omega}Numbers from 10 upwards
count:[10 TO *]Dates before 2012
date:{* TO 2012-01-01}
Curly and square brackets can be combined:
Numbers from 1 up to but not including 5
count:[1 TO 5}Ranges with one side unbounded can use the following syntax:
    age:>10
    age:>=10
    age:<10
    age:<=10
Saving and deleting queries
Saving queries enables you to reload and use them in the future.
Save query
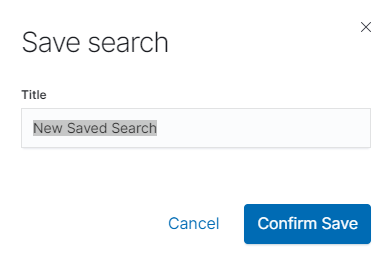
To save the query, click on the “Save” button under the query bar:

This will bring up a window in which you give the query a name and then
click the button  .
.
Saved queries can be managed by clicking the “Manage searches” button, which redirects to the Saved Objects section in Stack Management where you can view, edit, export, and delete all saved searches.
Delete query
To delete a saved query, open it from the search list, and
then click on the button  .
.
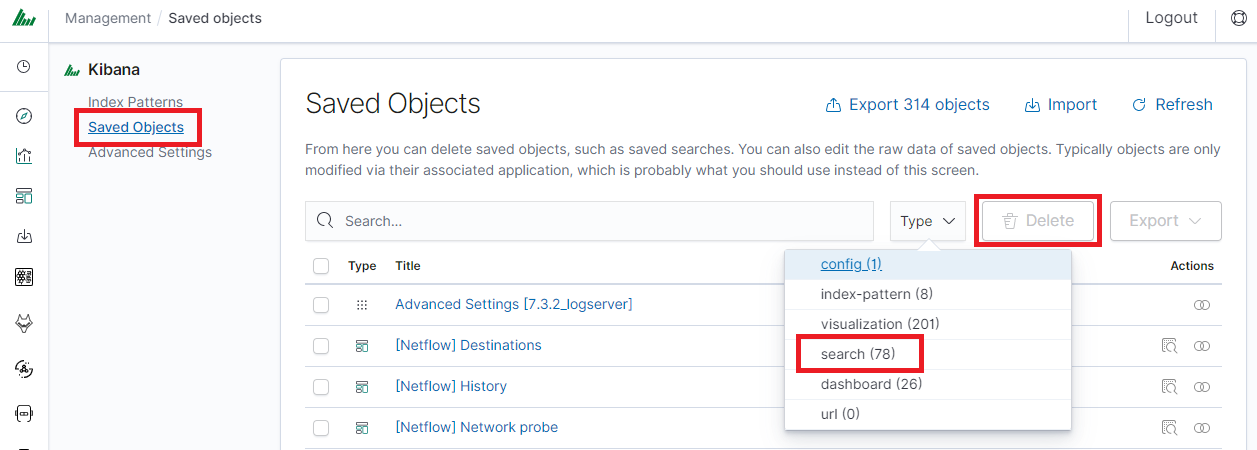
If you want to delete many saved queries simultaneously, go to Stack Management → Saved Objects and filter by type “Searches”. Select the queries in the list (the checkbox to the left of the query name), and then click the “Delete” button.
From this level, you can also export saved queries in the same way. To
do this, you need to click on and choose the save location. The file will be saved in .json format. If you then want to import such a file to Energy Logserver, click on a button
  , at the top of the page and select the desired file.
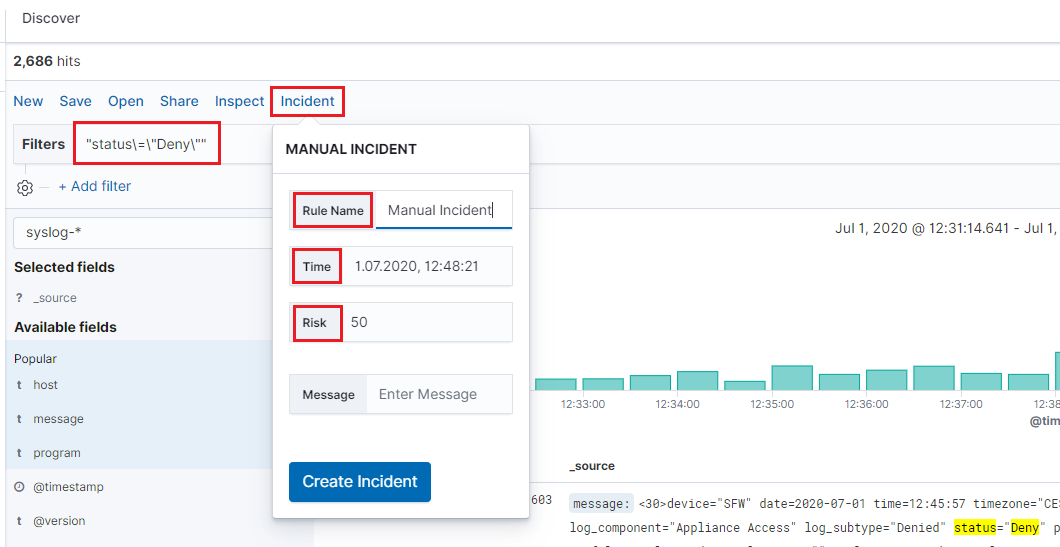
Manual incident
The Discover module allows you to manually create incidents that are saved in the Incidents tab of the Alerts module. Manual incidents are based on search results or filtering.
For a manual incident, you can save the following parameters:
Rule name
Time
Risk
Message
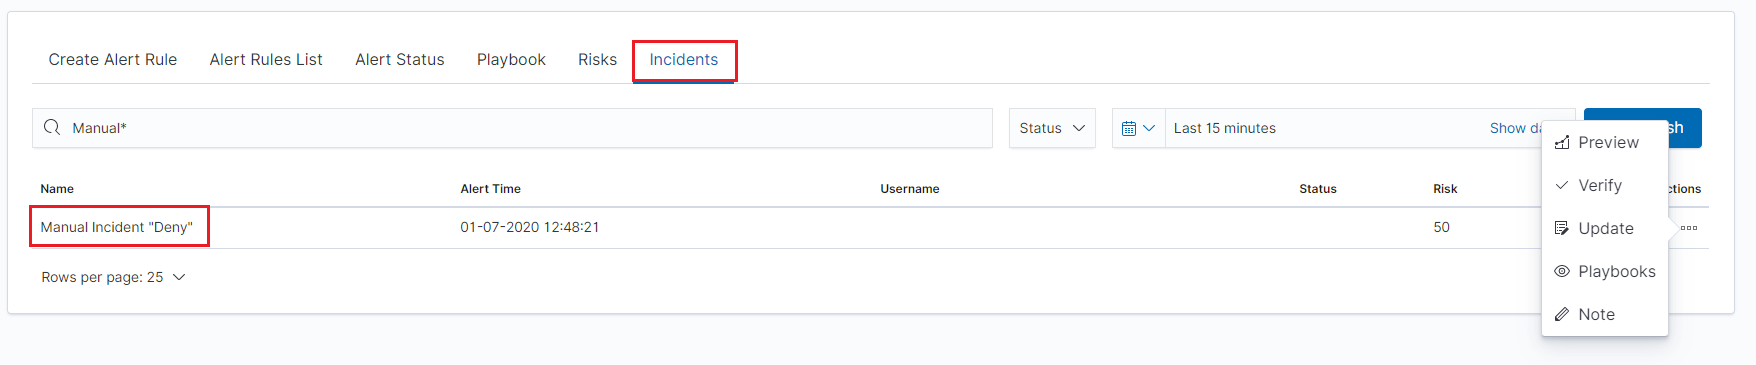
After saving the manual incident, you can go to the Incident tab in the Alert module to perform the incident handling procedure.
Quick Data Export Wizard
The Quick Export wizard allows you to download the currently viewed data frame to your local machine. The data is processed into a CSV or HTML file.
To use the Quick Export Wizard:
Select the
Reporttab from the top bar and go toQuicktab.Type the name of the task in the special field, which will also serve as the file name.
Select the file extension that you are interested in (
HTMLorCSV).Press the
Exportbutton and wait for the file to be ready to download.When the
Downloadbutton appears, click on it to download the file to your local machine.
AI Assistant
The AI Assistant provides LLM-based analysis capabilities in two modes: Document Analysis for contextual log inspection and Knowledge Chat for general queries.
Note
Access to AI Assistant requires the ai_assistant capability assigned to the user role.
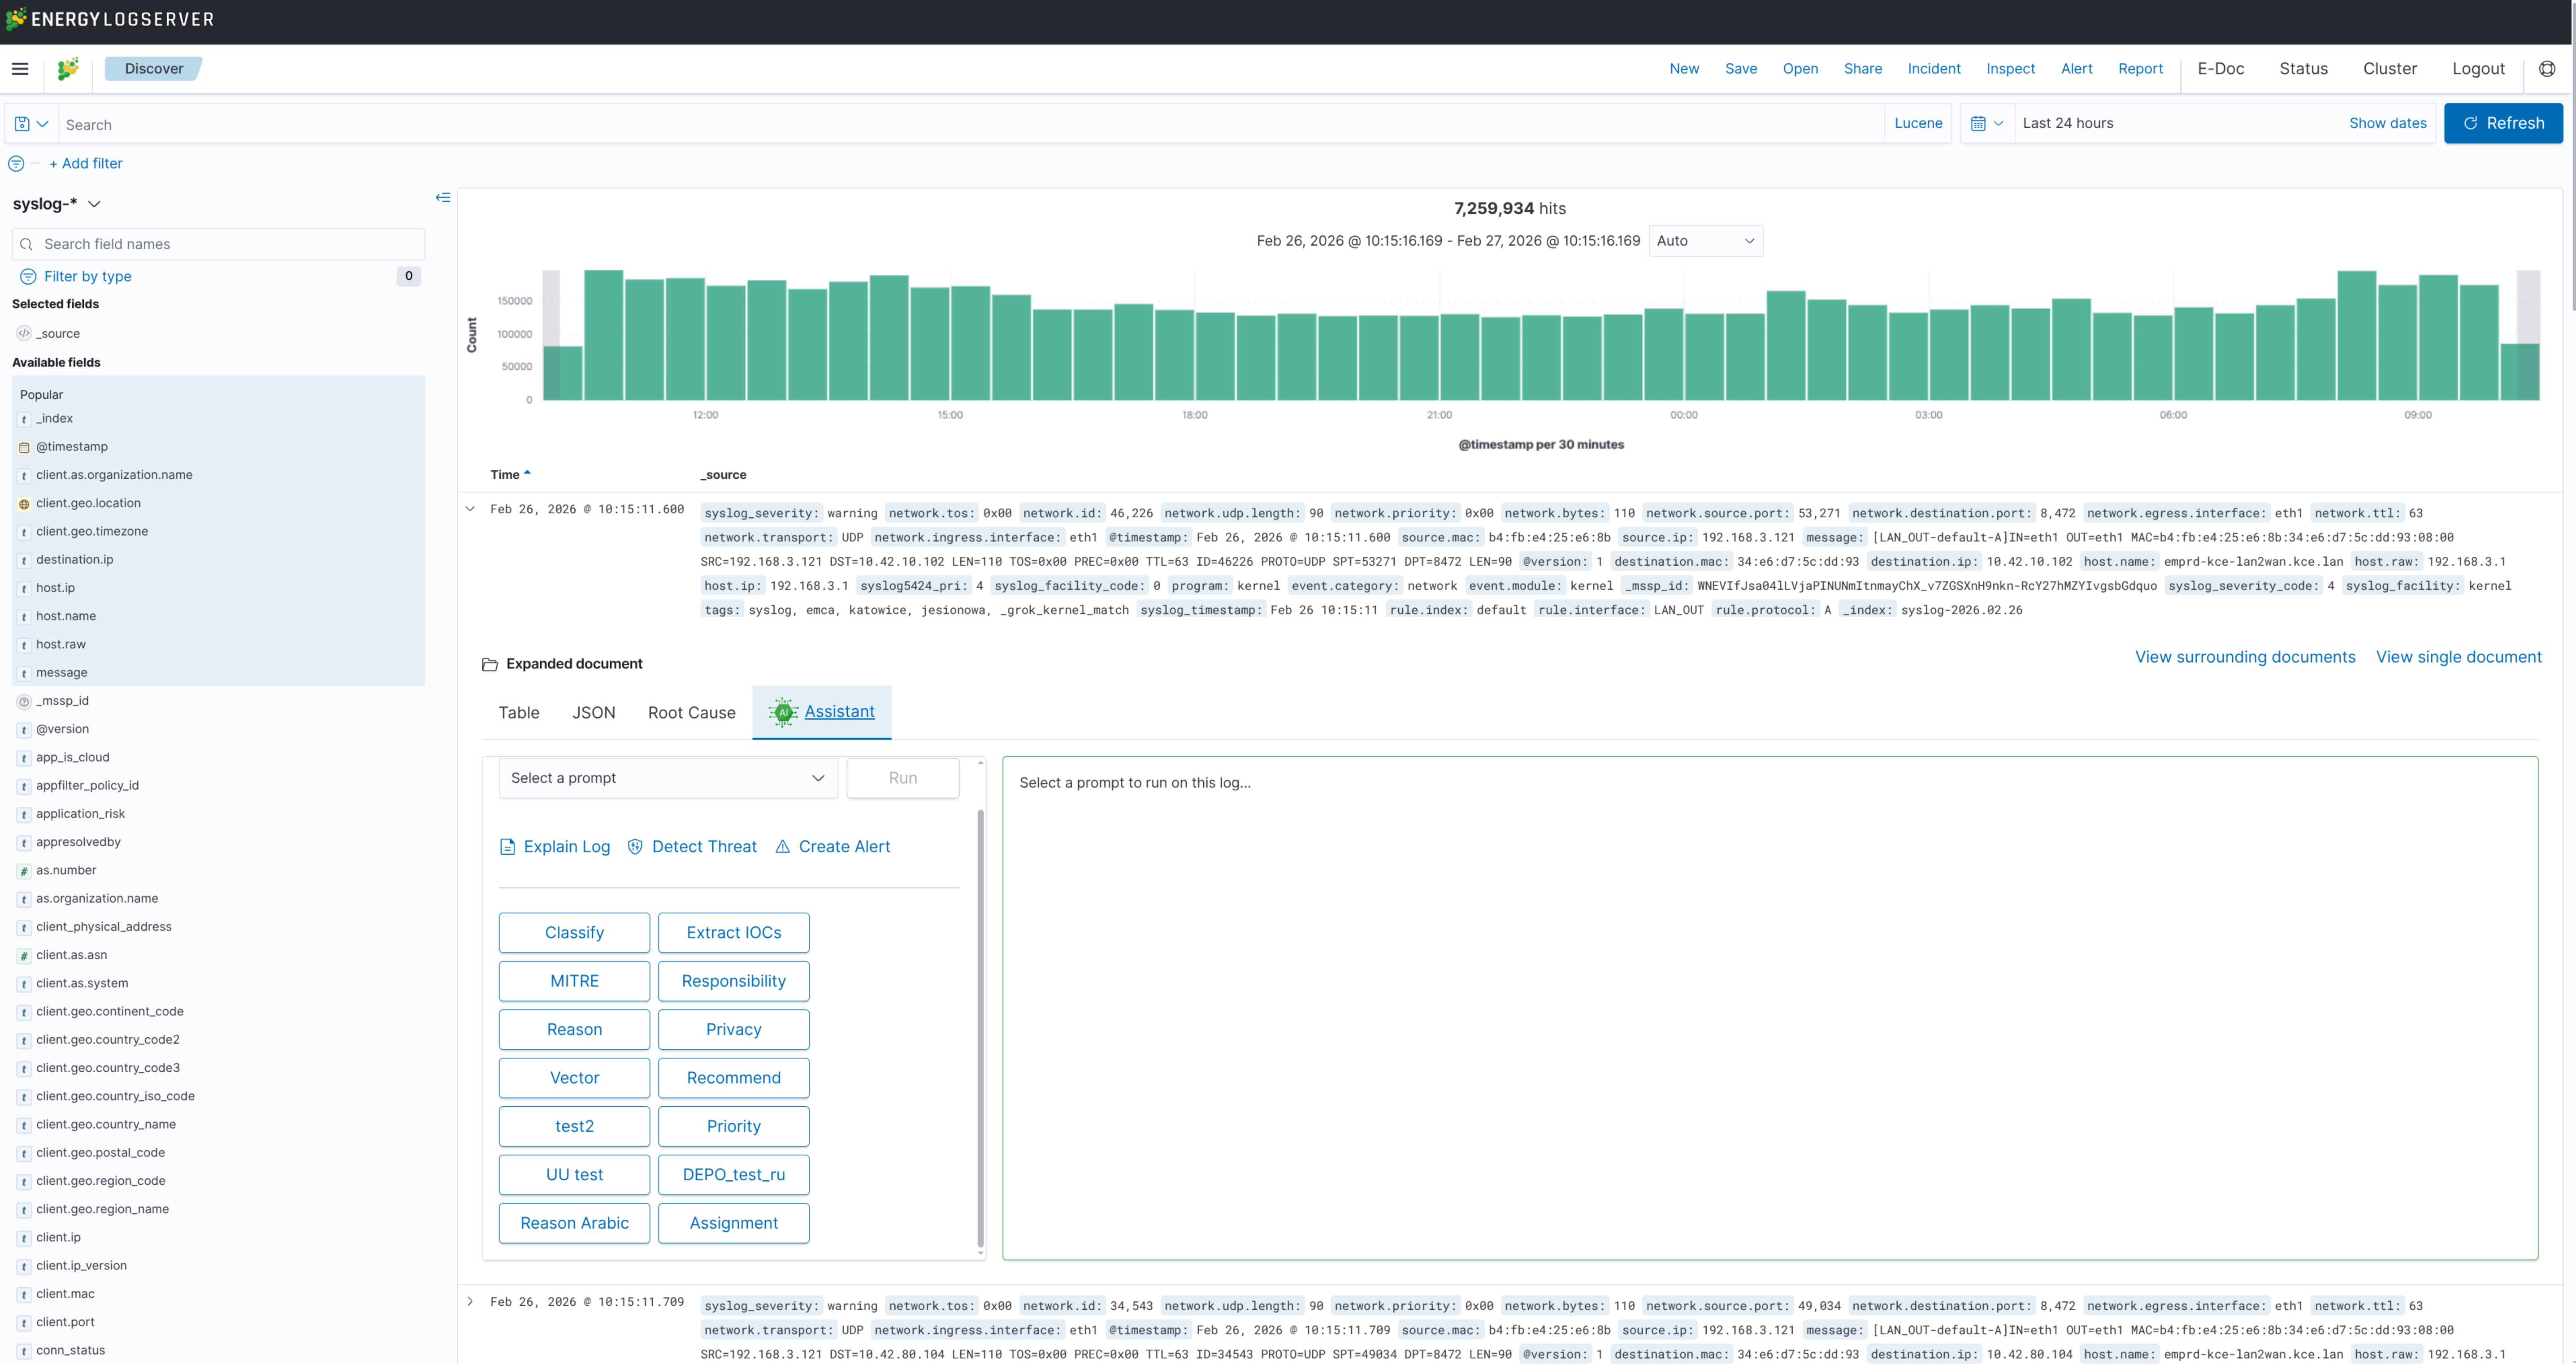
Document Analysis
When viewing an expanded document in Discover, the Assistant tab in the document viewer toolbar provides contextual analysis of the selected log entry. The expanded document view contains three tabs:
Table — standard field-value display
JSON — raw document in JSON format
Assistant — AI-powered log analysis
In the Assistant tab, select a provider from the drop-down menu and use the available prompt buttons to analyze the current log entry. Prompts are displayed as buttons (e.g., Classify, Extract IOCs, MITRE, Priority, Responsibility) or as select fields, depending on their configuration. The response from the LLM is displayed in the panel on the right.
Additional actions are available via the links above the prompt area:
Cluster Log — group similar log entries
Select Preset — apply a predefined prompt set
Create Alert — create an alert rule based on the current event
Knowledge Chat
The Knowledge Chat is a floating chat panel available globally across the application. It is not tied to a specific document — use it for general queries, troubleshooting guidance, or knowledge base lookups. Open it by clicking the AI Assistant floating button visible in the bottom corner of the interface.
Note
For AI Assistant configuration (providers, prompts, AI on Prem connection), see AI Assistant.