Management Interface
The Network Probe plugin has two tabs, Pipelines Management and Network Probes, described below. The banner at the top shows how many probes are in use out of the number allowed by the license.
Note
The Management Interface communicates with each probe via the license-service API using TLS. The SSL certificates are located at /opt/license-service/ssl/ and are configured automatically during license-service installation.
Pipelines Management
This tab lets you manage pipelines on all probes at once. Each row describes one pipeline available on the probes:
Name: name of the pipelineUsed by: number of probes that run the pipelineAssigned probes: probes on which the pipeline is enabled
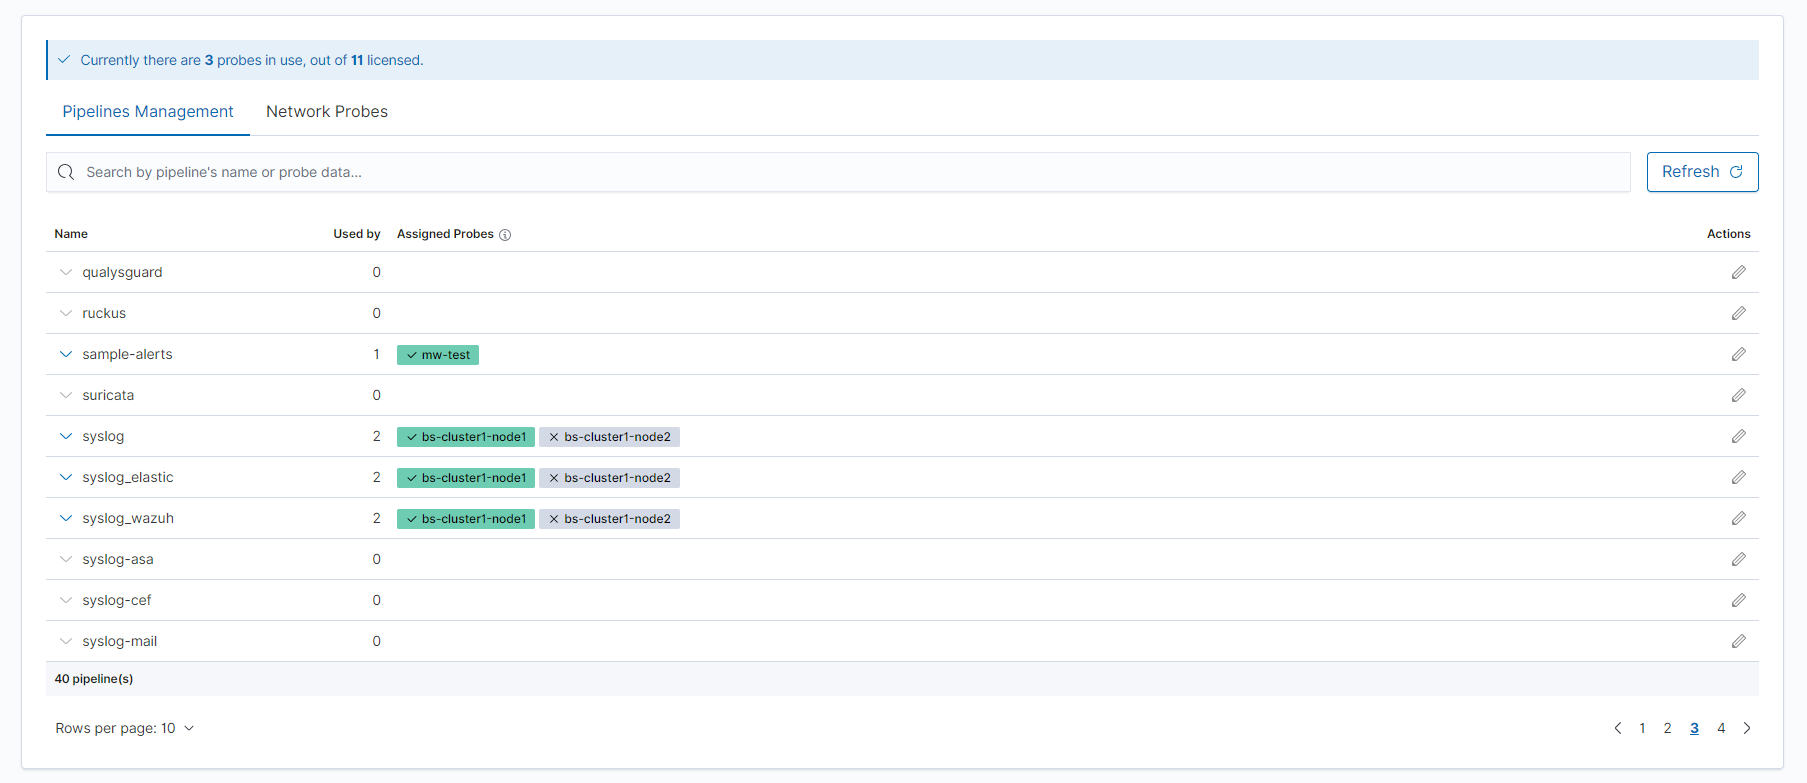
You can search the list by pipeline name or by probe data, for example the probe hostname. Use Refresh to reload the list and New pipeline to open the Pipeline Creator.
New Pipeline Creator
The Pipeline Creator lets you create a pipeline from the GUI.
In the
Pipelines Managementtab, clickNew pipeline.Enter a unique name for the pipeline. The name cannot contain spaces or special characters other than
-and_.Select or drag and drop the configuration files. Each file must have the
.confextension and be no larger than 1 MB. You can add more than one file.Select the probes on which the pipeline will be enabled. Only active probes can be selected. The pipeline is installed on every Network Probe, but it collects data only on the selected ones.
Click
Submit.
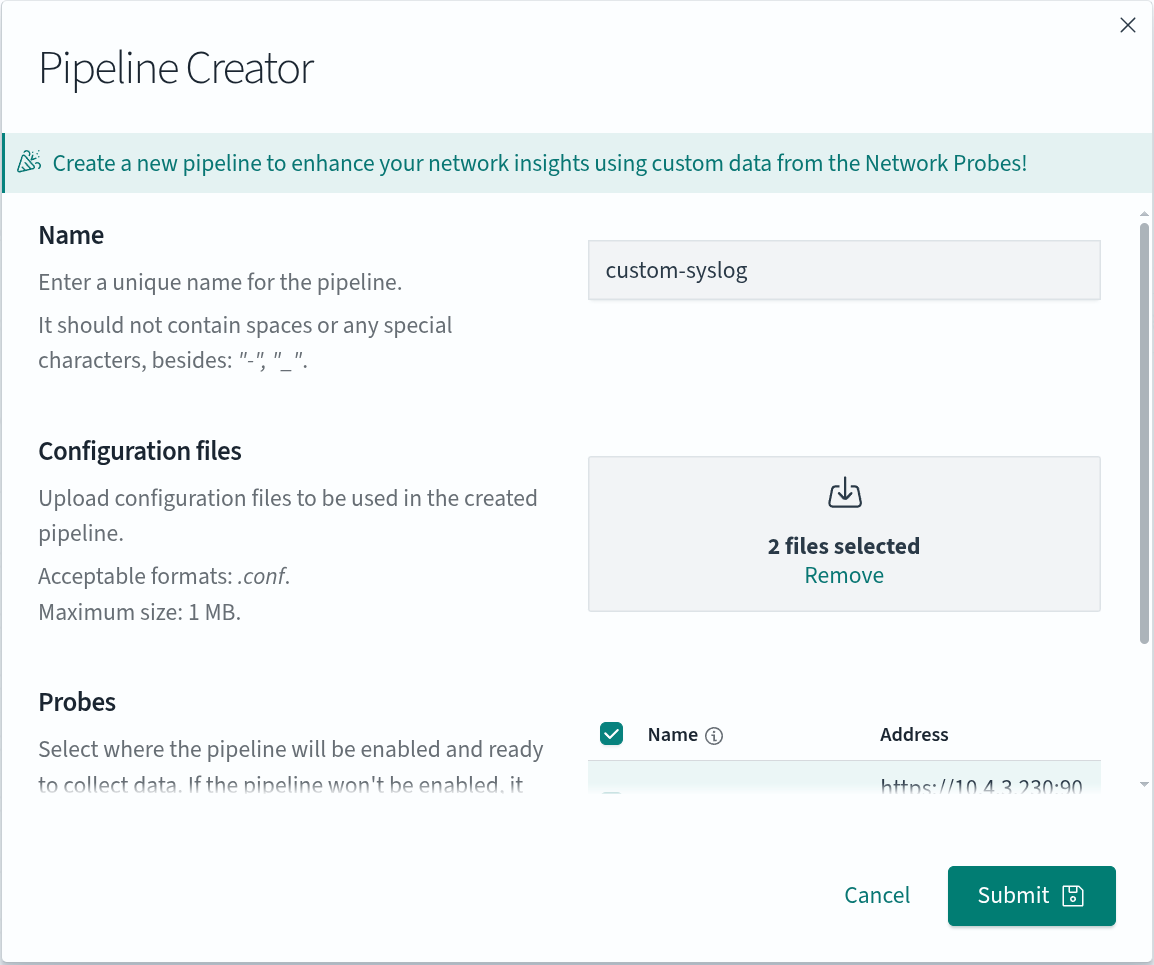
The creator validates the configuration files before it saves anything. If a file cannot be parsed, a notification Unable to create pipeline "<name>" appears and nothing is written to the probes. Click See the full error to read the parser message with the file path, line, and column.
On a probe where the pipeline is not enabled, the creator saves the configuration files in /etc/logserver-probe/conf.d/<name>/ and the definition file as /etc/logserver-probe/pipelines.d/<name>.yml.off.
Pipeline Details
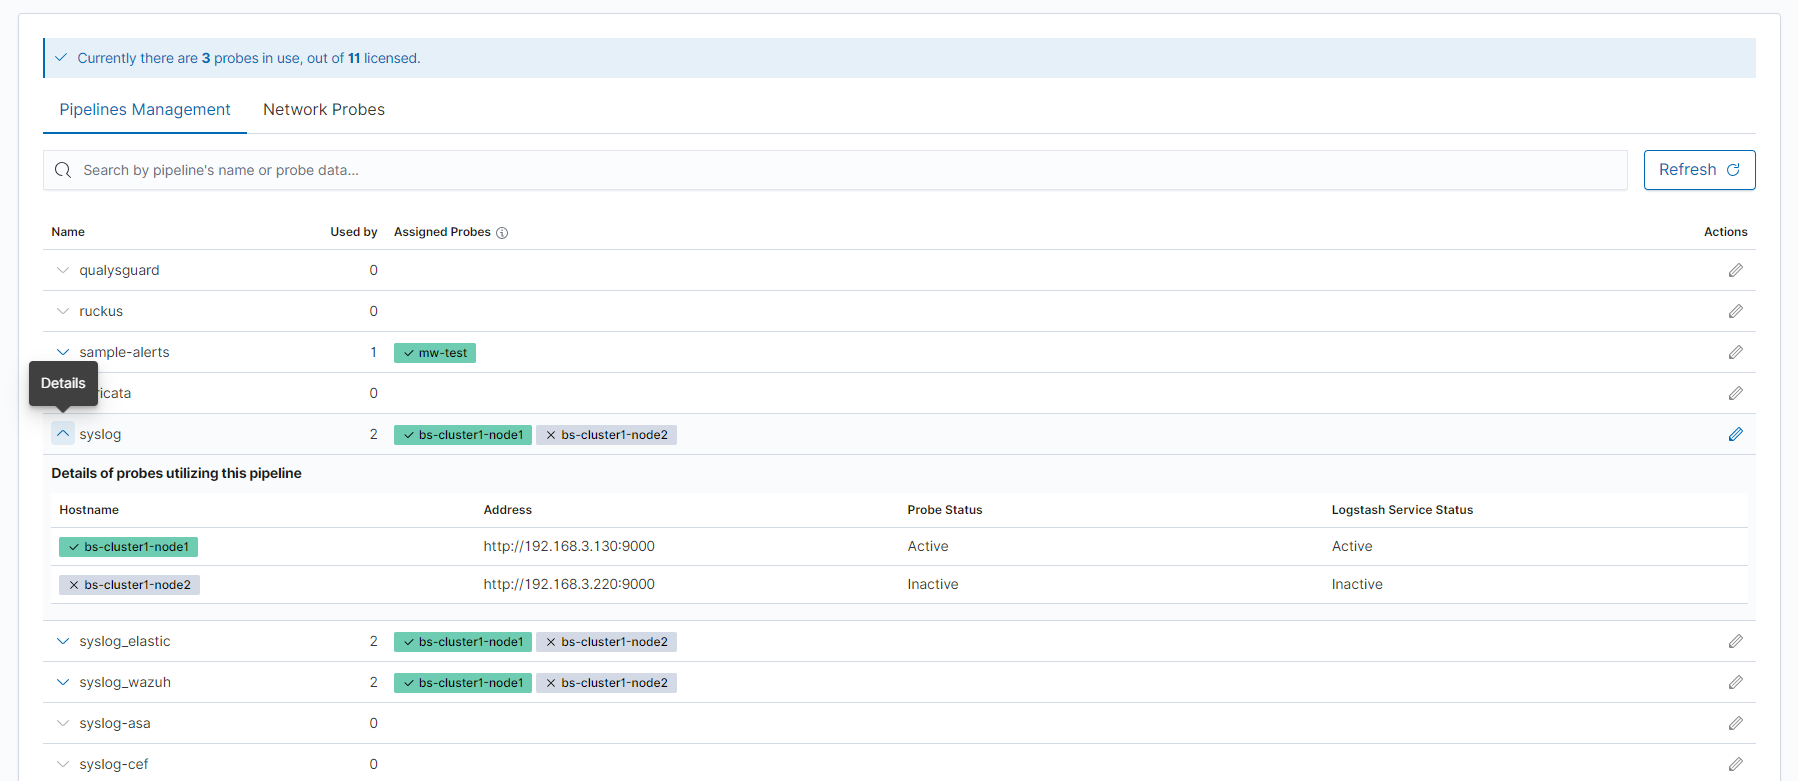
A green label with a check icon means that the probe is working and the pipeline is enabled on it. A gray label with a cross means that the pipeline should be working, but the probe does not respond.
Click a probe label in the Assigned probes column to open the pipeline statuses on that probe.
Click the arrow on the left to expand the details of a pipeline. The details list the name, address, probe status, and service status of each probe that uses the pipeline.
Manage pipeline
Click the pencil icon on the right to open the Manage pipeline window.
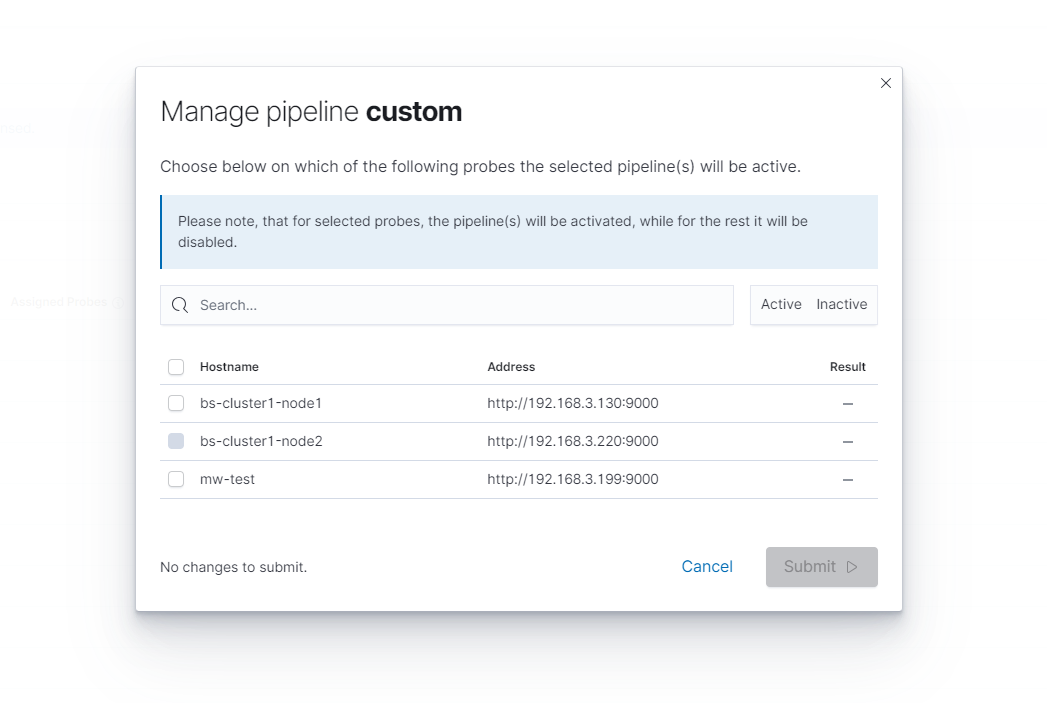
The list shows all probes. A selected row means that the pipeline is enabled on that probe. After you submit, the pipeline is enabled on the selected probes and disabled on the rest. A probe that is not running cannot be selected. Use the search field and the Active/Inactive filters to find a probe in a long list.
When you change the selection, the line in the lower-left corner summarizes the operations, for example Pipeline(s) will be: activated on 1 probe(s). Without changes it reads No changes to submit.
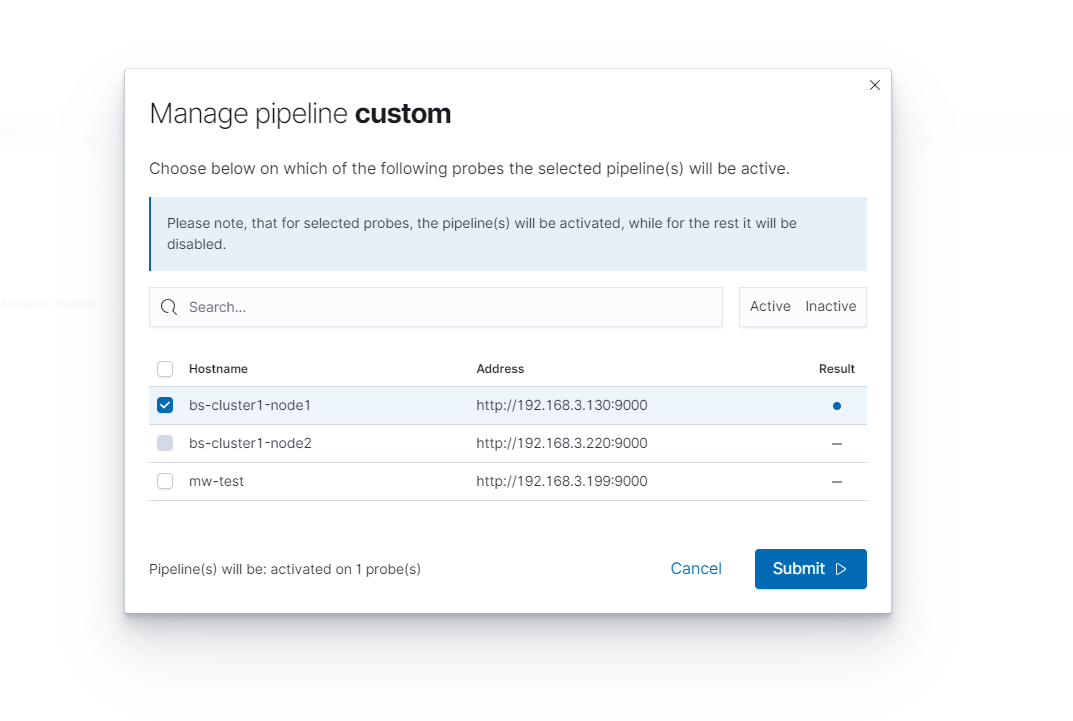
Click Submit. The Result column shows the progress for each probe and then a green icon when the operation succeeded or a red icon when it failed. Hover over a red icon to read the error message.
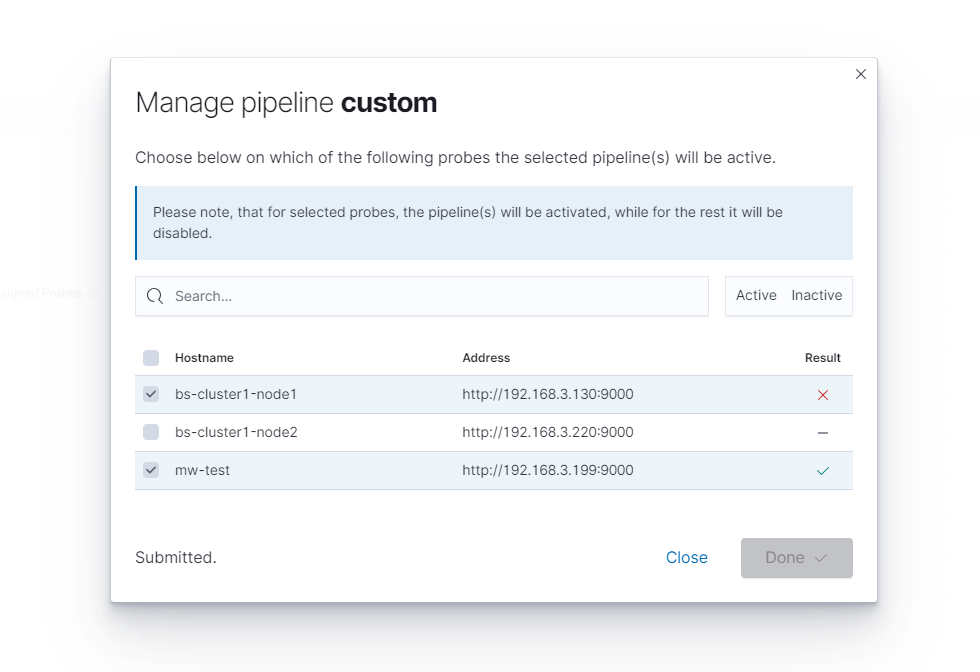
Click Close and refresh the list to see the change.
Network Probes
This tab lists all registered probes with the following columns:
Name: probe hostname or a custom name. Click the pencil icon to set a custom name.Status: probe status during the last 60 secondsVersion: Network Probe version installed on the probe. A warning icon means that it does not match the Energy Logserver version.Address: license-service address of the probeLast revision: last time the probe reported its status. A warning icon means that the probe clock is ahead, so its status may be wrong.Services statusandPipelines status: number of services and pipelines in each stateActions:Show details(eye icon) andDelete(trash icon)
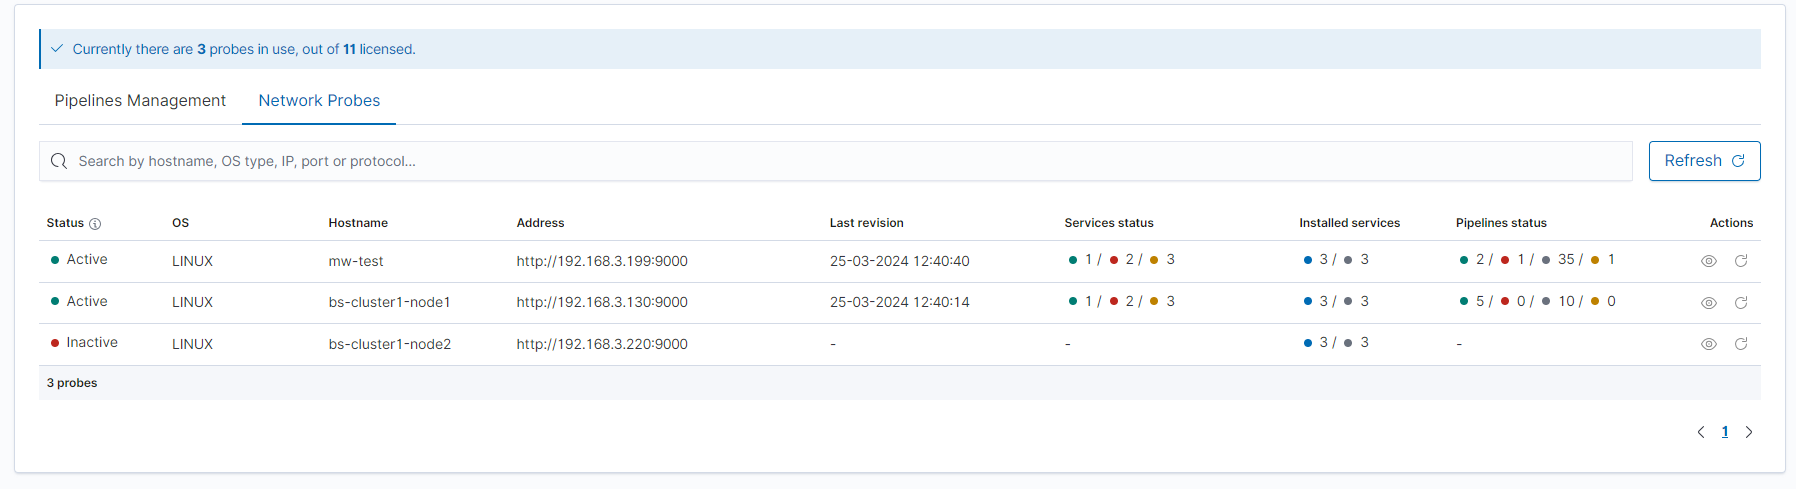
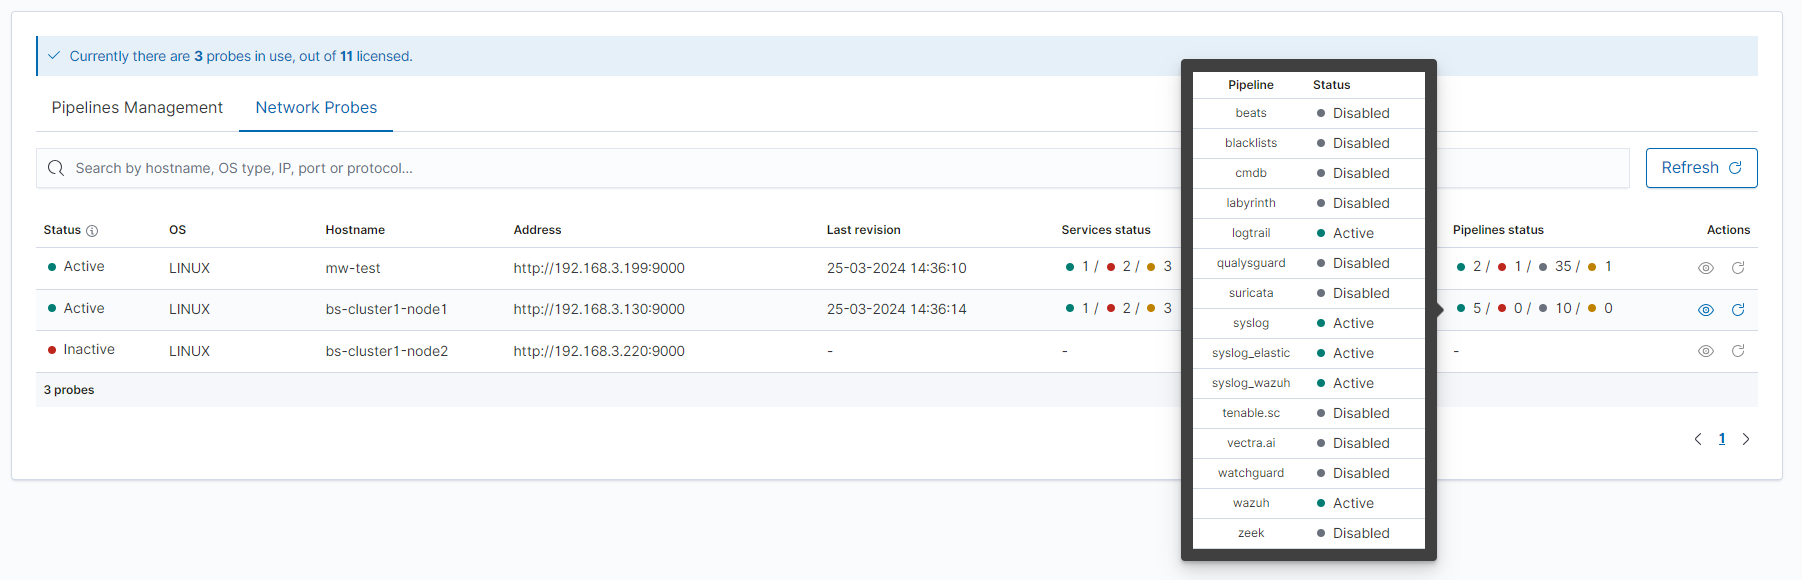
You can search the list by name, OS type, IP, port, or protocol. Hover over the Services status or Pipelines status column to see a table with the status of each service or pipeline.
Click the eye icon to open the probe details with the Services, Pipelines, and Files sections. Delete removes the probe from the GUI. If the registration of a probe failed, delete it so that the probe can register again.
Services Section
This section lists the services managed on the probe: logserver-probe, kafka, suricata, zeek, nfacctd@instance1, and sfacctd@instance1. You can see their status and start, stop, or restart them. A service that is not installed on the probe shows the status N/A.
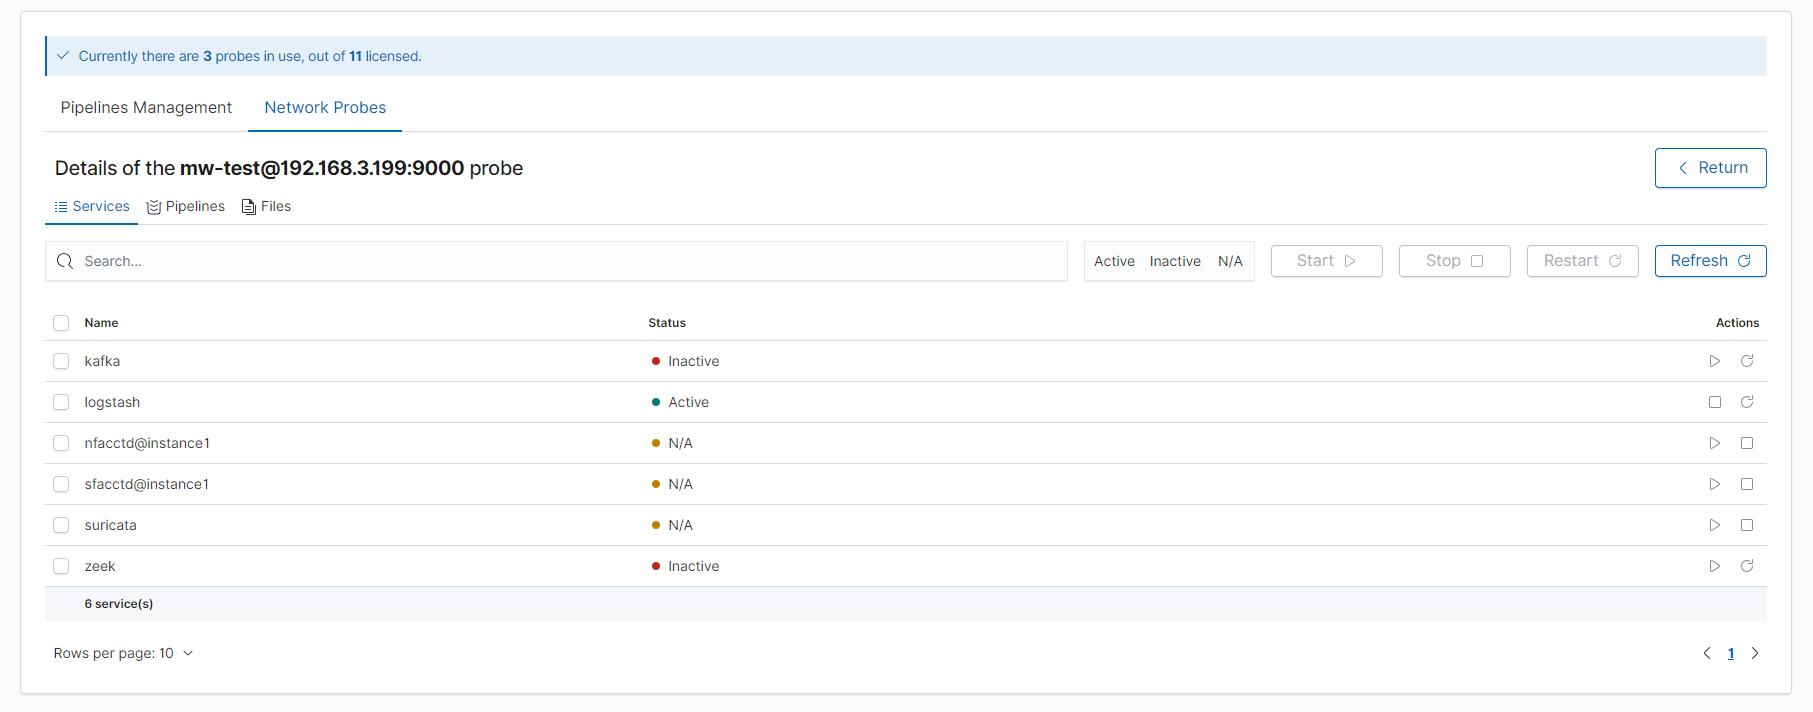
Use the buttons in the Actions column to manage one service, or select several rows and use the Start, Stop, or Restart buttons above the list. The Active, Inactive, and N/A filters limit the list to services in that state.
Pipelines Section
This section lets you manage the pipelines on the probe. You can check their status and statistics, enable or disable them, delete them, and reload the pipeline configuration.
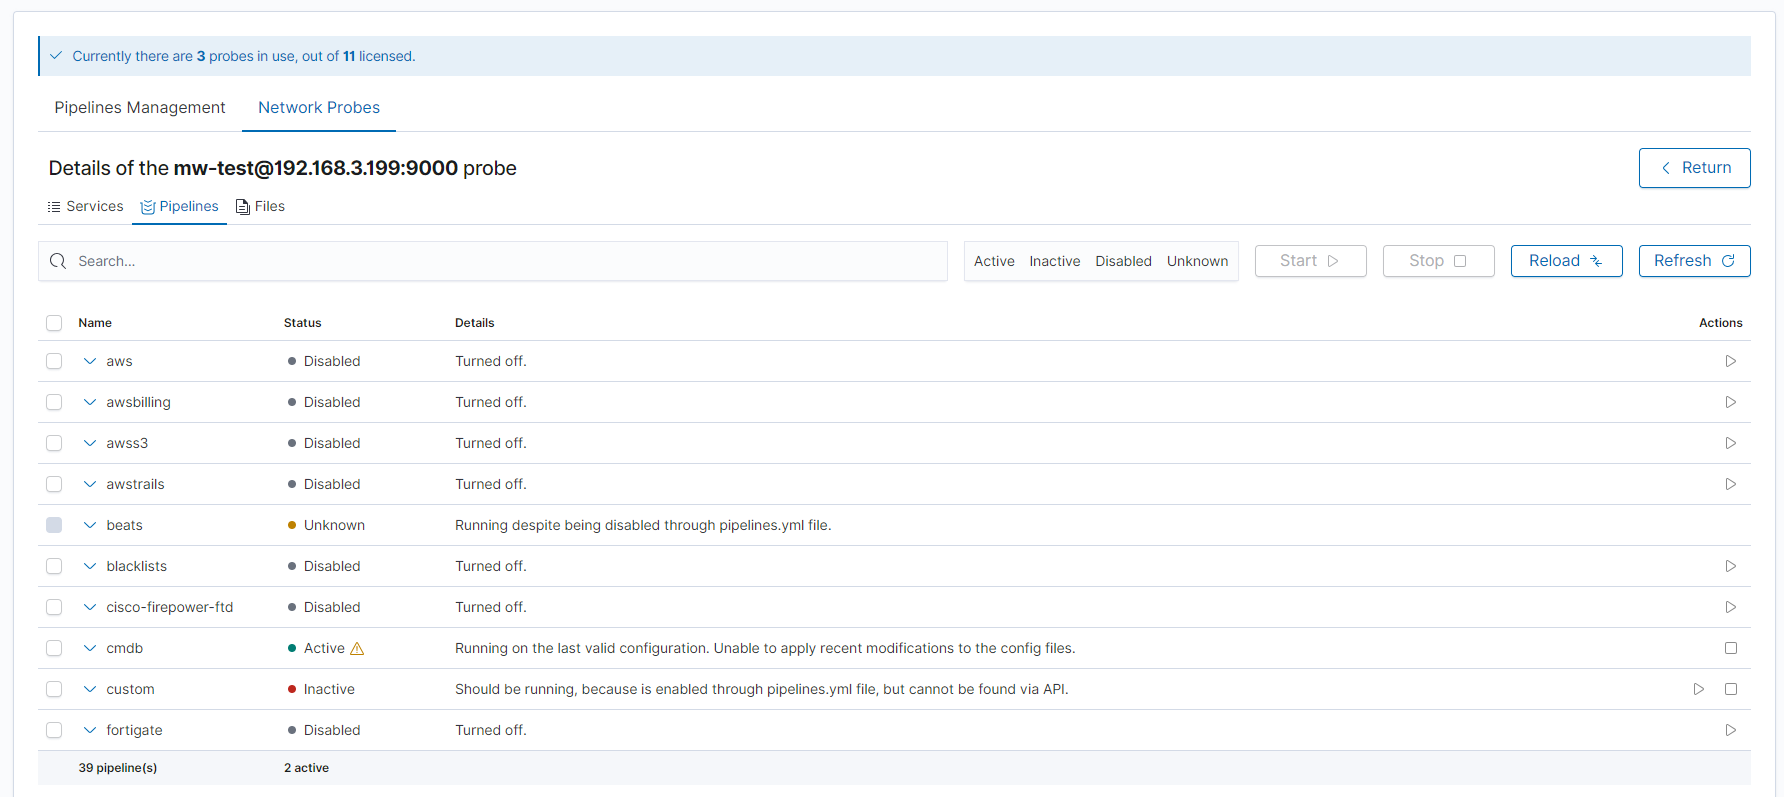
Pipeline configuration
A pipeline consists of:
definition file: pipeline name, path to the configuration files, and optional pipeline settings. One file can define several pipelines. The default path is/etc/logserver-probe/pipelines.d/<pipeline_name>.yml.configuration files: input, filter, and output plugin configuration. The default path is/etc/logserver-probe/conf.d/<pipeline_name>/*.conf, and the definition file can point to another one.
Click the arrow on the left to see both paths in the pipeline details.

Pipeline status
A pipeline can have one of the following statuses:
Active: the pipeline is enabled and running, and its runtime statistics are available.
Active with warning: the pipeline is enabled and running, but a reload error has occurred.
Inactive: the pipeline is enabled, but it does not run and its statistics cannot be found.
Disabled: the pipeline is disabled and does not run.
Unknown: the pipeline has failed, for example because of a wrong configuration, corrupted files, or a stopped service.
The Details column describes the current status and can point to the cause of an error.
Click the arrow on the left to view more details. Every pipeline shows its configuration details. An active pipeline also shows runtime statistics:
input, filter, and output events
queue details
plugins in use (input, filter, output, and codecs)
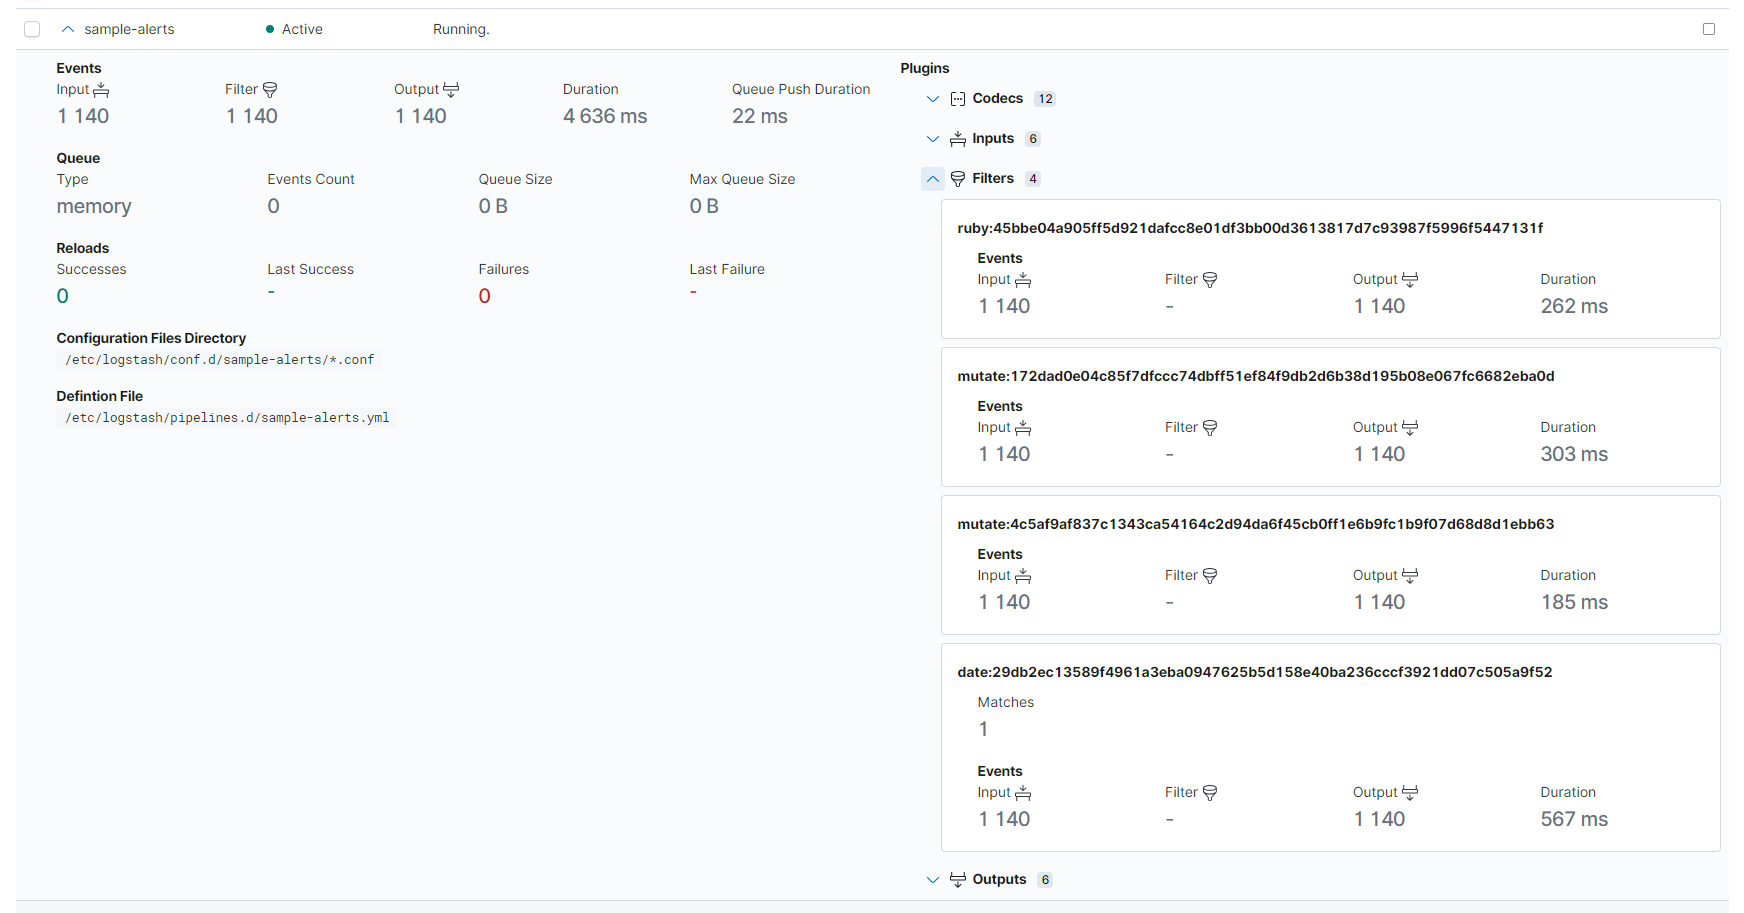
If a reload error has occurred, the details show it as well.
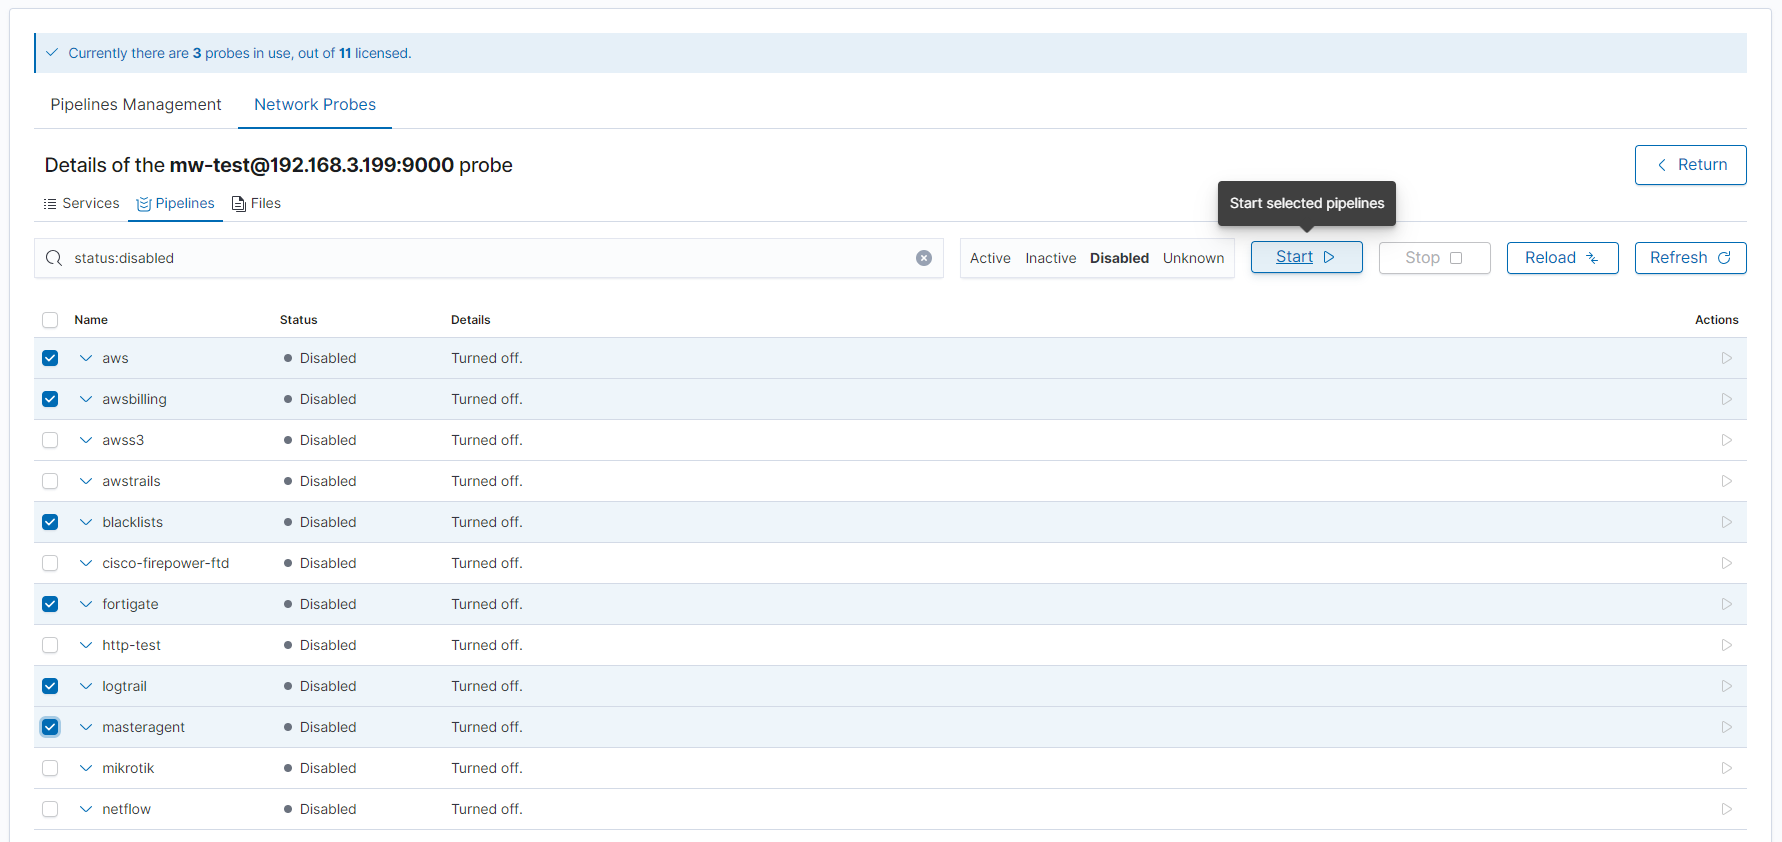
Filtering by status
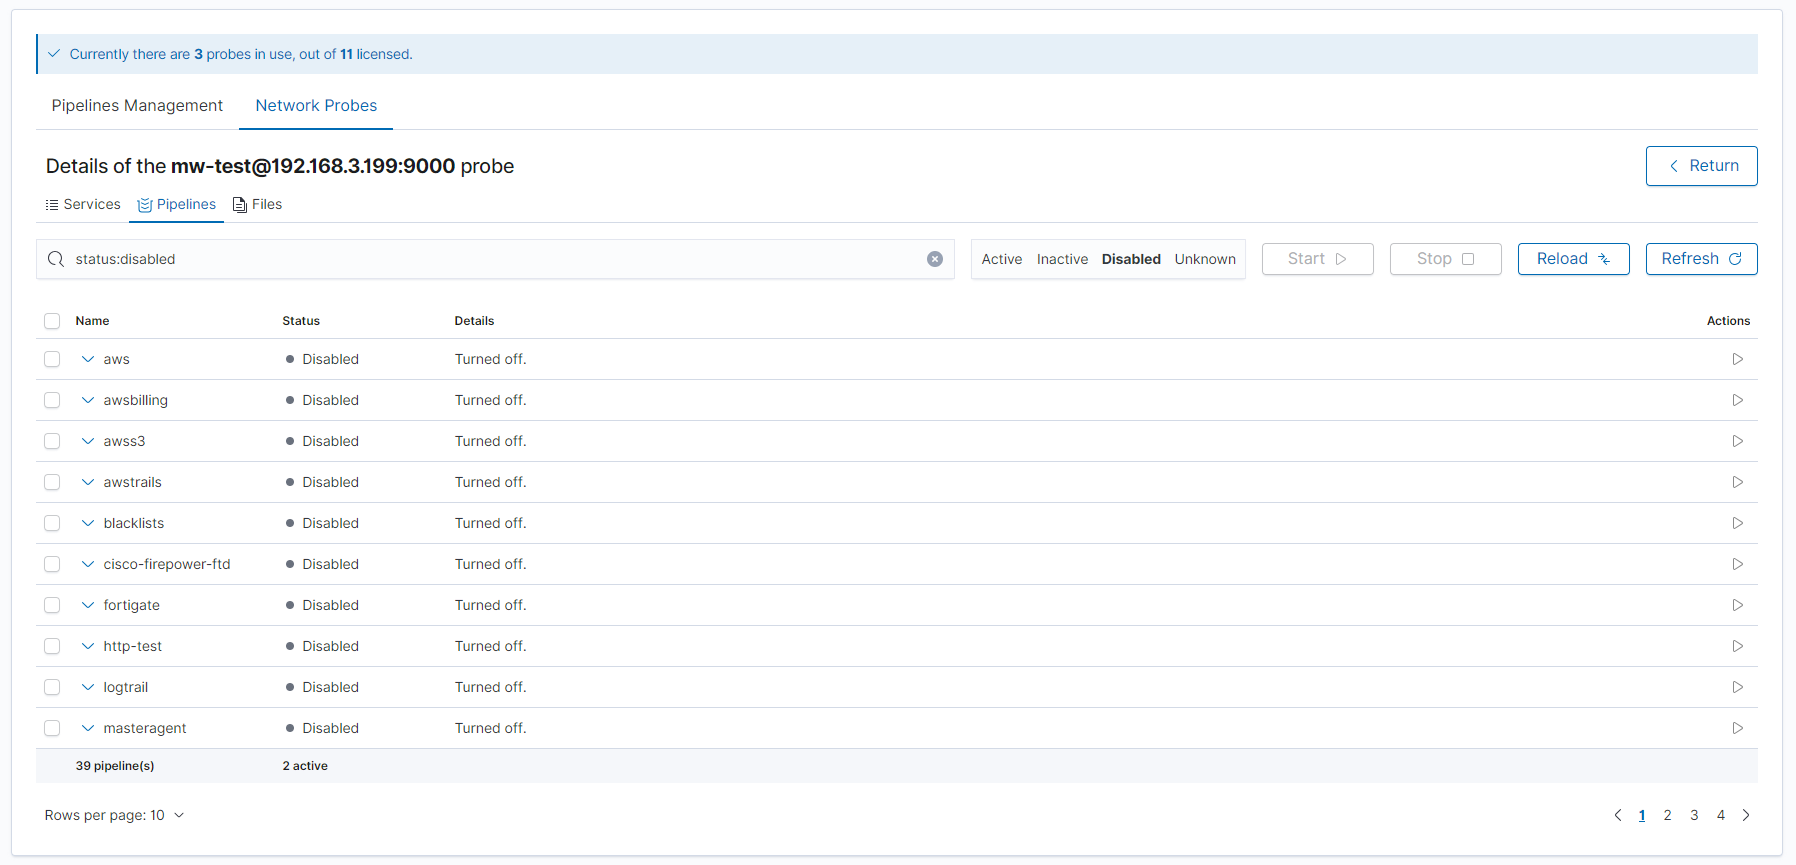
Use the Active, Inactive, Disabled, and Unknown buttons next to the search field to show only pipelines with that status. The example below shows only disabled pipelines:
Reload pipelines configuration
Click Reload to apply changes in the Network Probe configuration files without restarting the logserver-probe service. Confirm the operation in the window that opens.
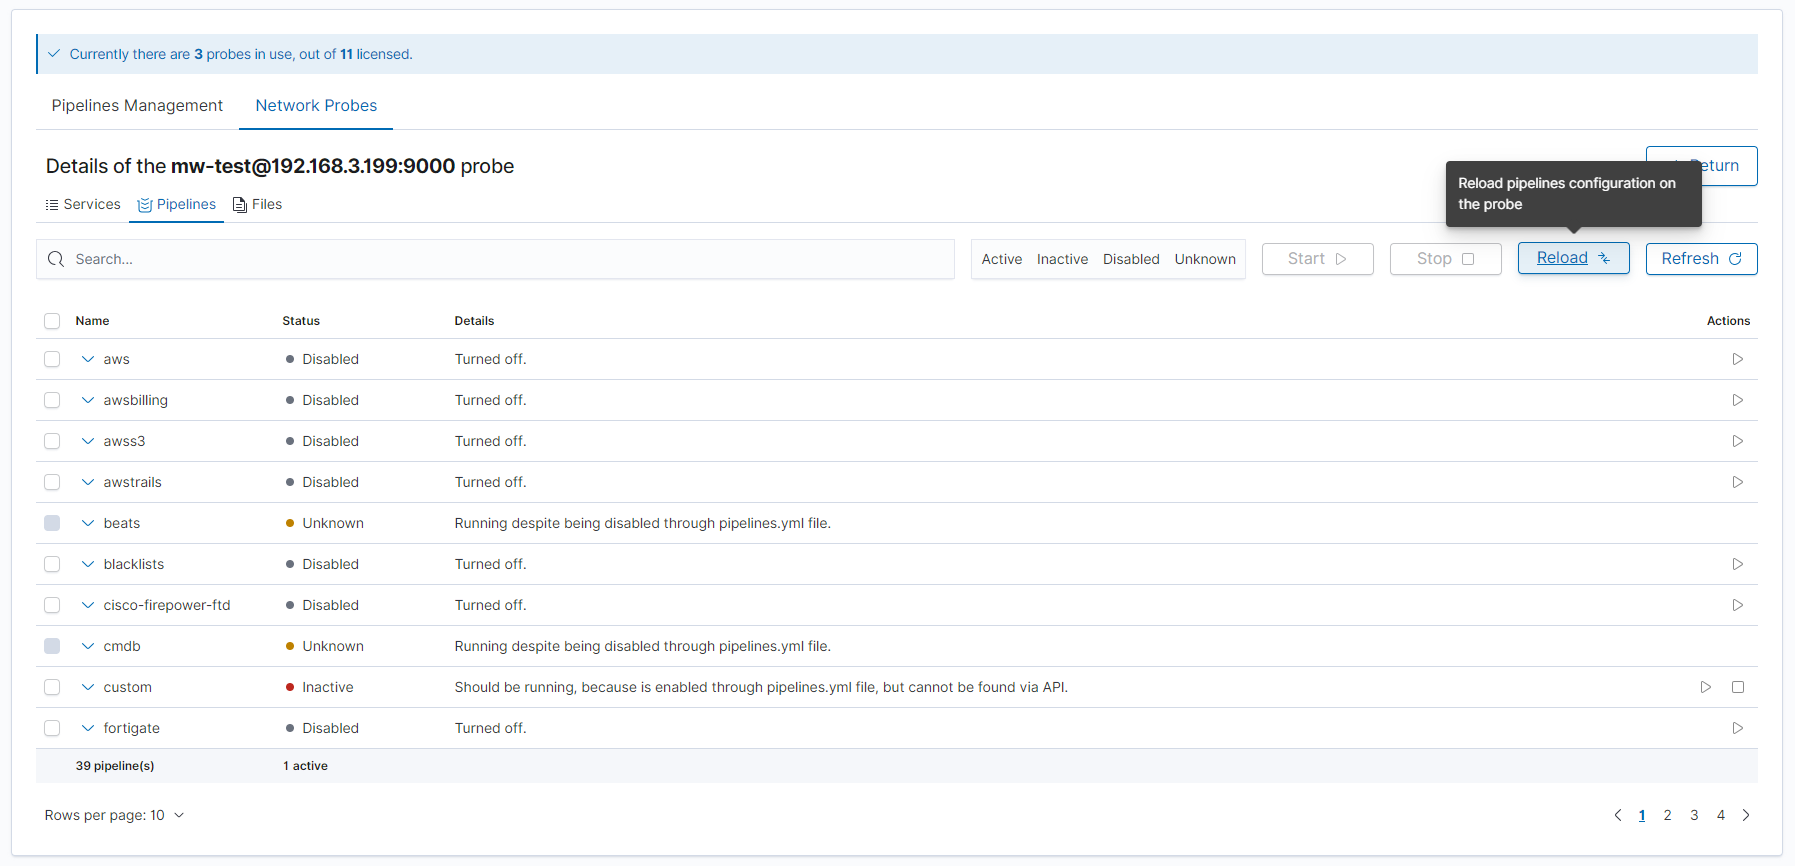
Enabling or disabling a pipeline reloads the configuration automatically.
Enable/disable pipeline
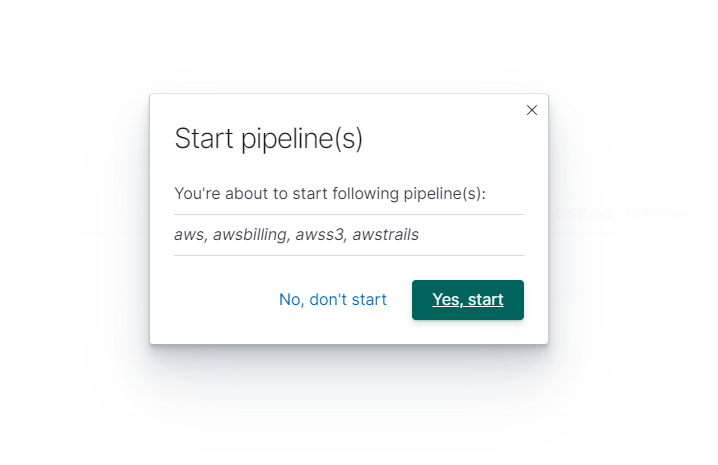
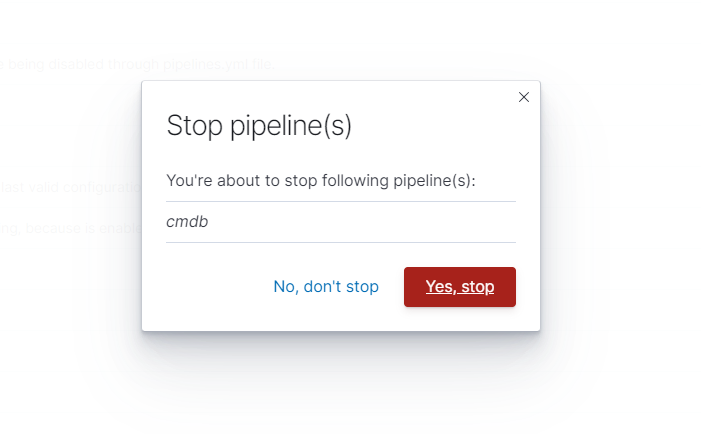
Open the Actions menu of a pipeline and choose Start or Stop. To change several pipelines at once, select their rows and use the Start or Stop button above the list. All selected pipelines must have the same state.
If one definition file defines several pipelines, the action applies to all of them, and the confirmation window lists them. Below is the message for one of the 4 pipelines defined in aws.yml:
For a pipeline with its own definition file, the message looks like this:
Delete pipeline
Choose Delete in the Actions menu to remove a pipeline and all its files from the probe. The operation deletes the configuration files, the definition file, and the pipeline entry in pipelines.yml, and stops the pipeline. It cannot be undone.
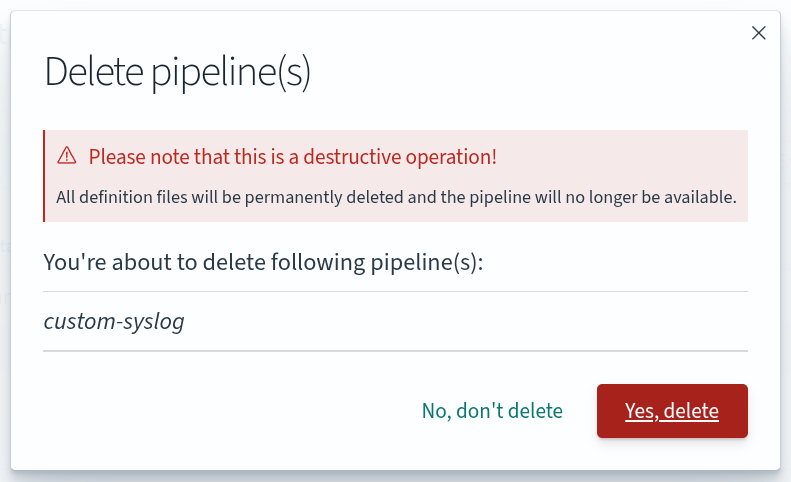
The empty directory /etc/logserver-probe/conf.d/<pipeline_name>/ stays on the probe. The logserver-probe service keeps reporting the deleted pipeline, so the list can still show it with the status Unknown, also after Reload.
The Files action opens the Files section with the files of the pipeline.
Files Section
This section lists the files managed by the probe. You can create, edit, enable, disable, and delete them, and check their validation results.
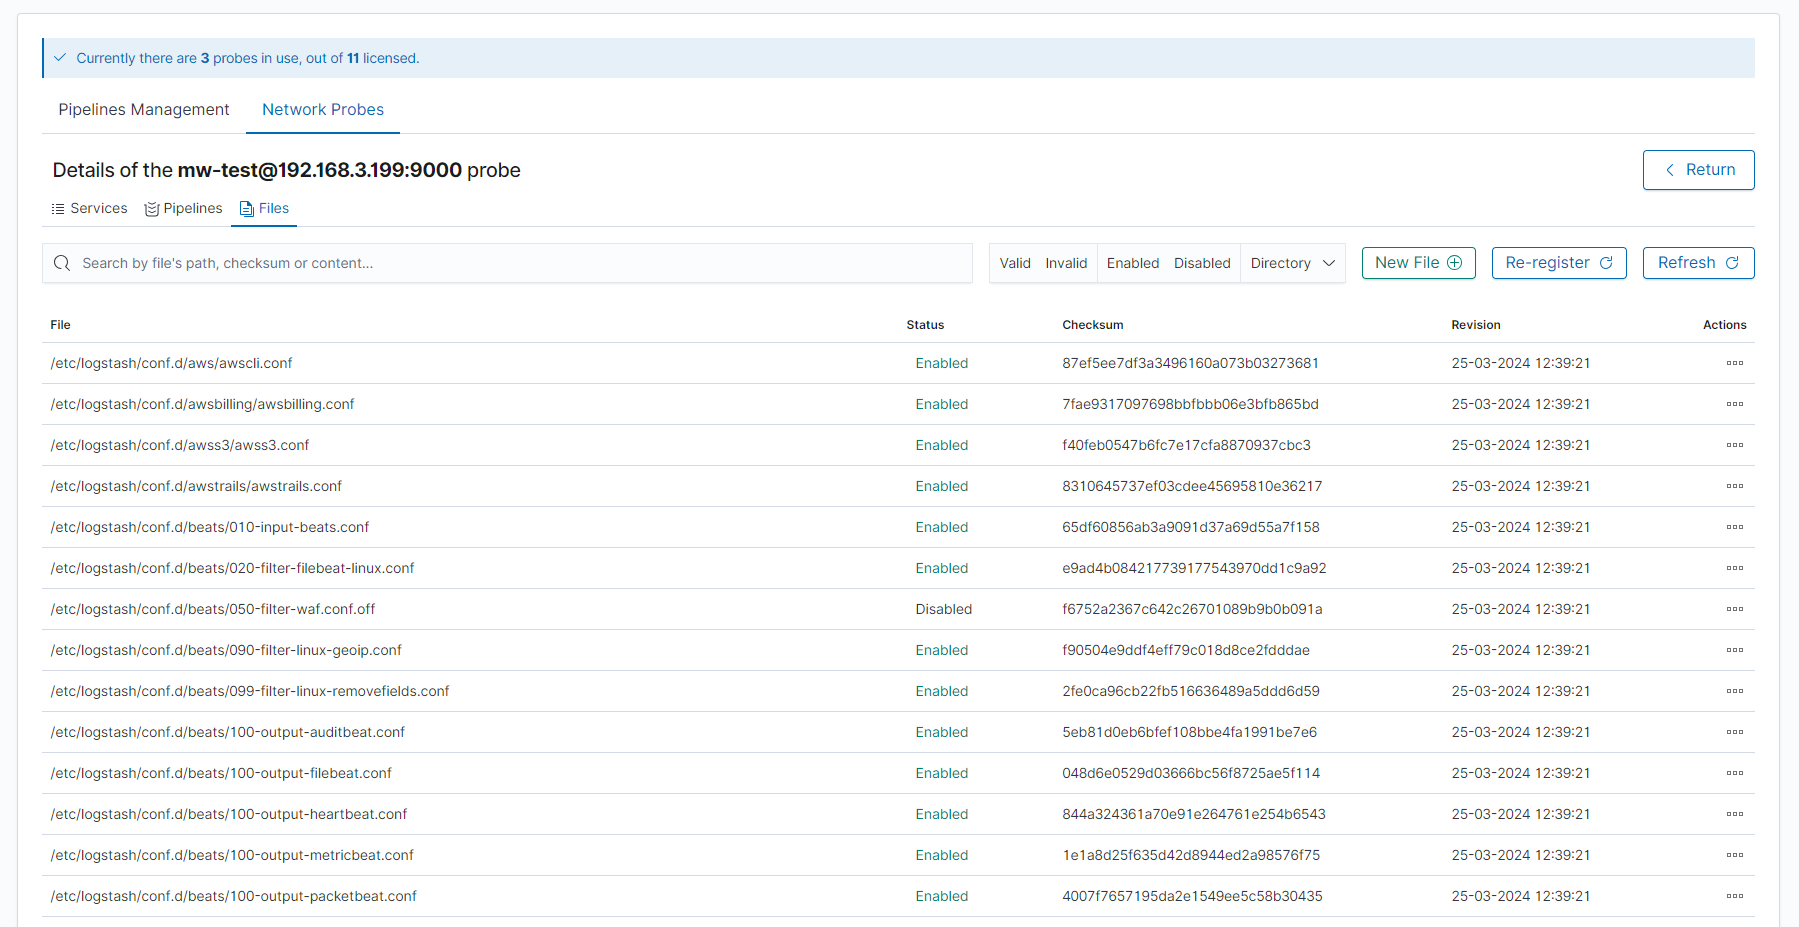
The table shows:
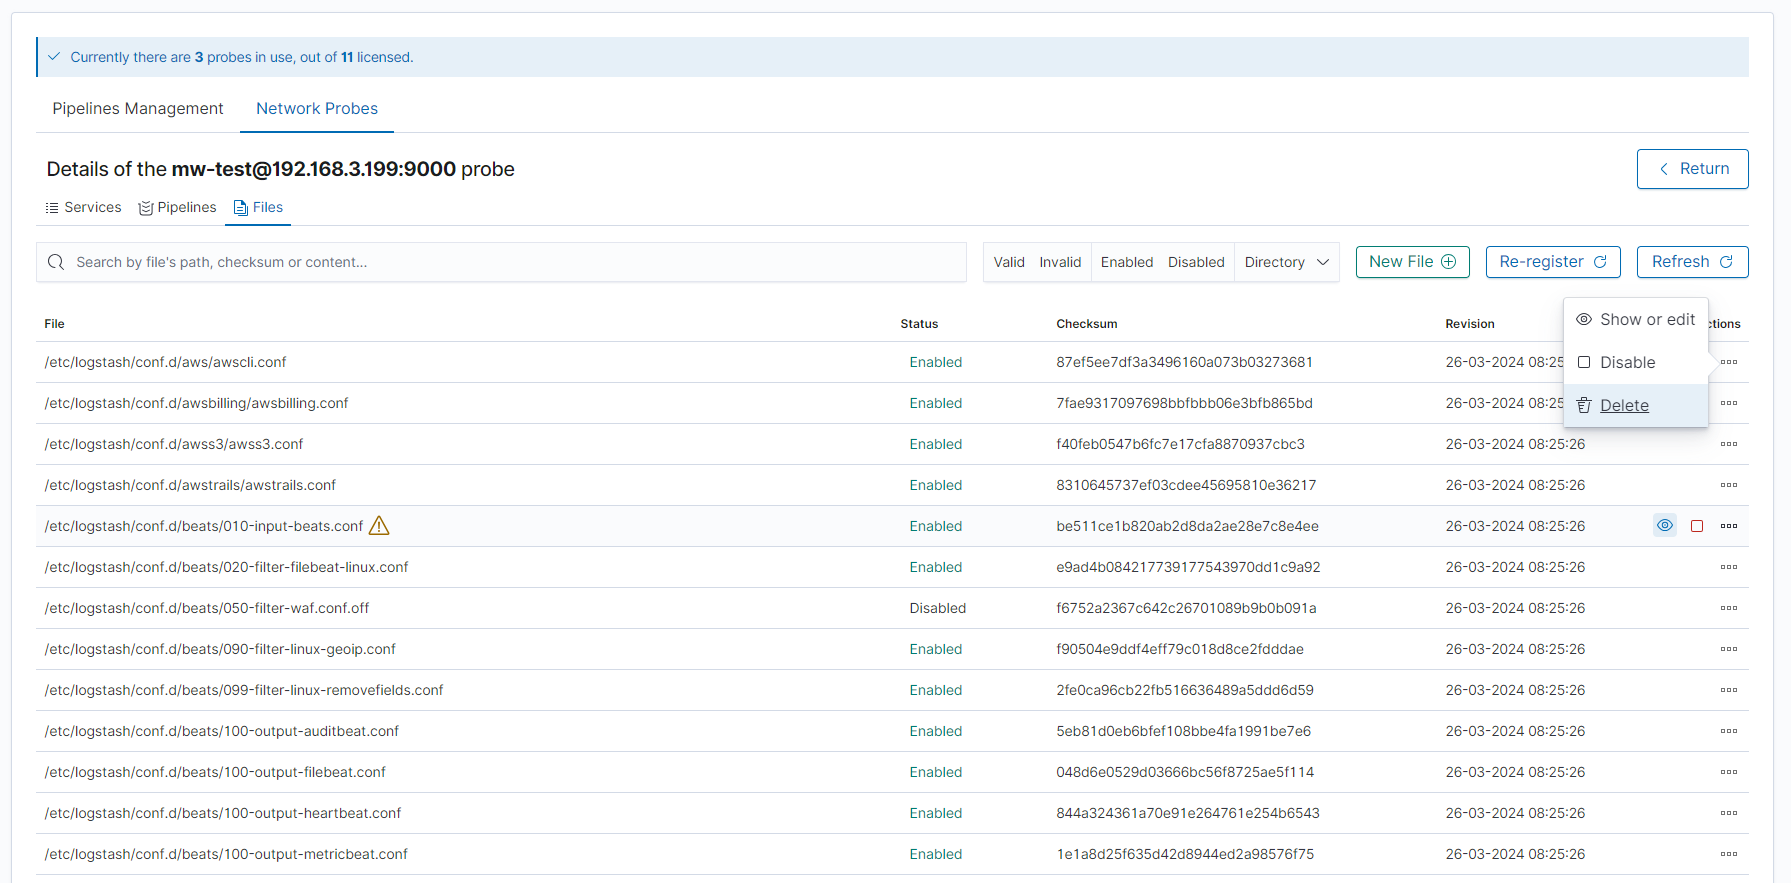
File: full path of the fileStatus: whether the pipeline uses the file. Configuration files in/etc/logserver-probe/conf.d/are eitherEnabled(.conf) orDisabled(.conf.off). Click the status to change it.Checksum: checksum of the file contentRevision: date of the latest registration of the file
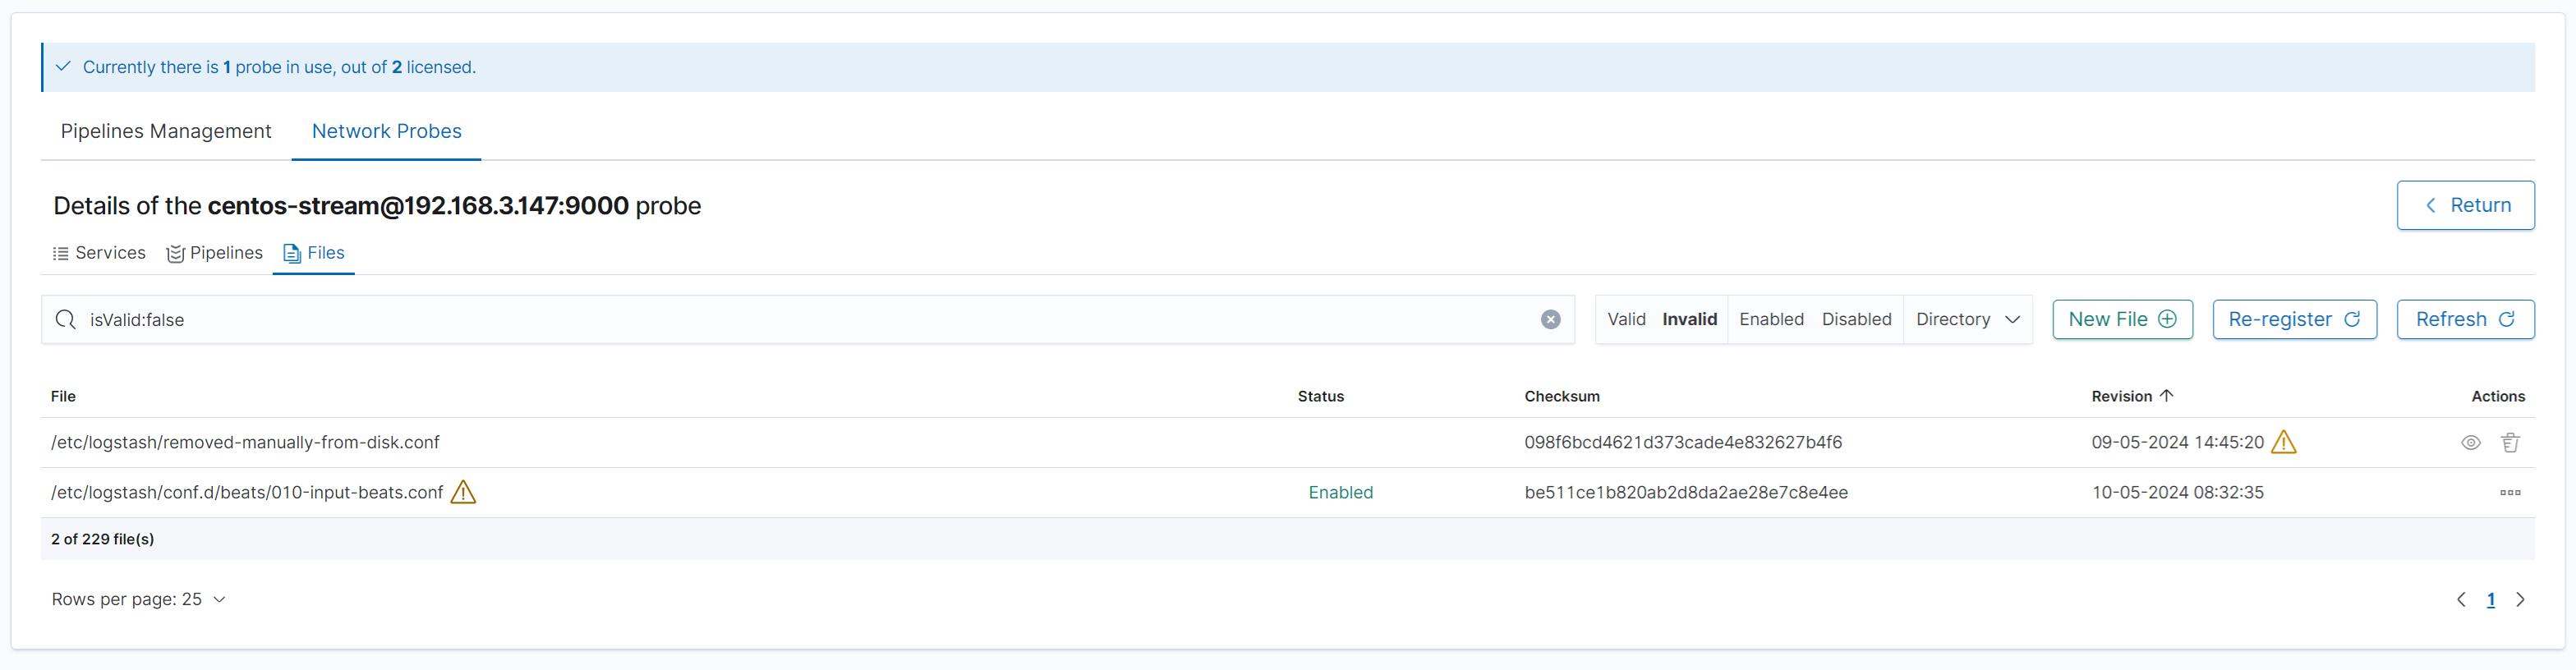
A yellow warning icon next to a file marks a parsing error or an outdated revision, described below.
The probe manages the directories and file extensions set in the files_management section of /opt/license-service/license-service.conf on the probe. By default these are /etc/logserver-probe/, /etc/logserver-probe/conf.d/, /etc/logserver-probe/pipelines.d/, /opt/zeek/etc/, and /etc/suricata/, with the extensions yml, yaml, conf, cfg, config, and off.
Filtering and searching
You can filter files by:
Valid/Invalid: parsing result and whether the revision is currentEnabled/Disabled: whether the pipeline uses the fileDirectory: the directory of the file
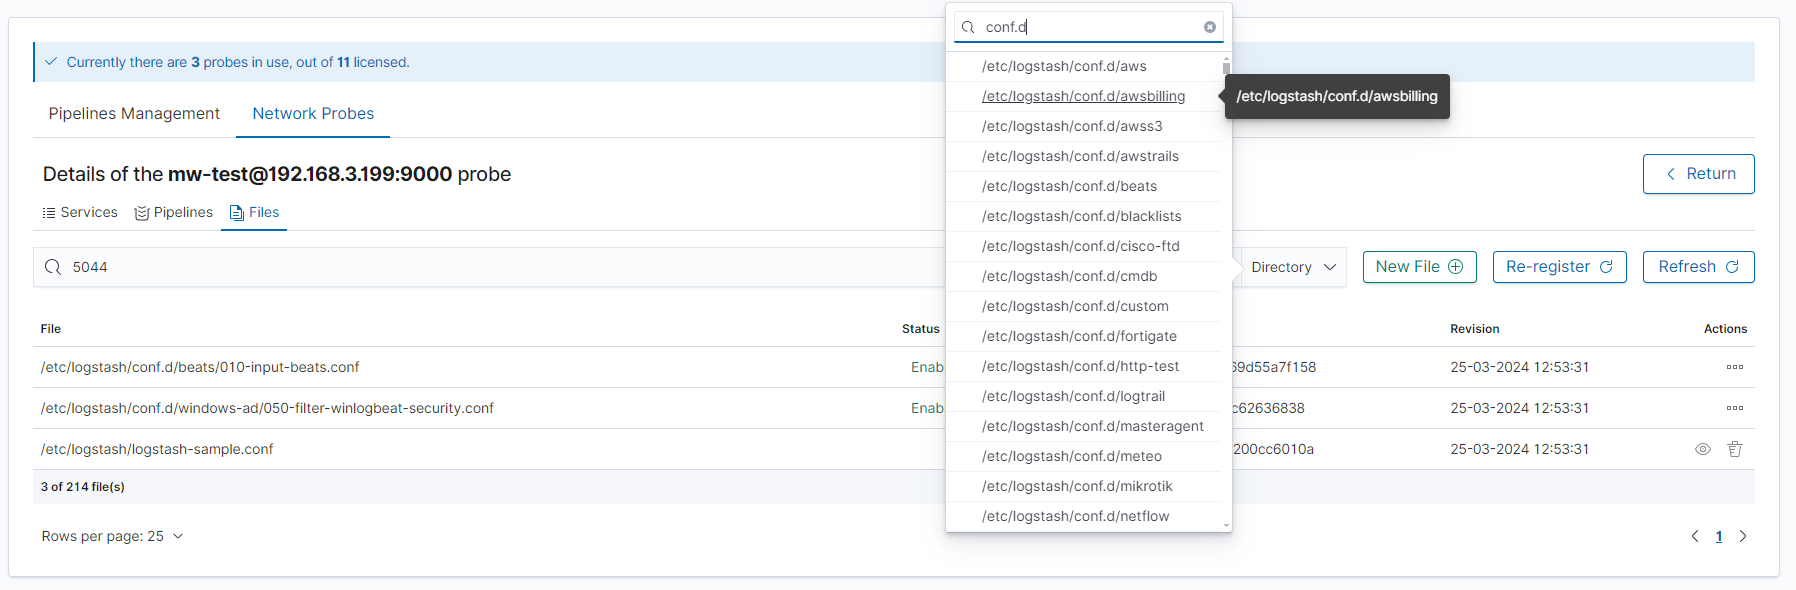
You can also search by a fragment of the path, the checksum, or the file content. The example below uses the directory filter and finds the files in conf.d/beats that contain 5044:
The next example uses the Invalid filter. The table shows only files with a parsing error or an outdated revision.
Create file
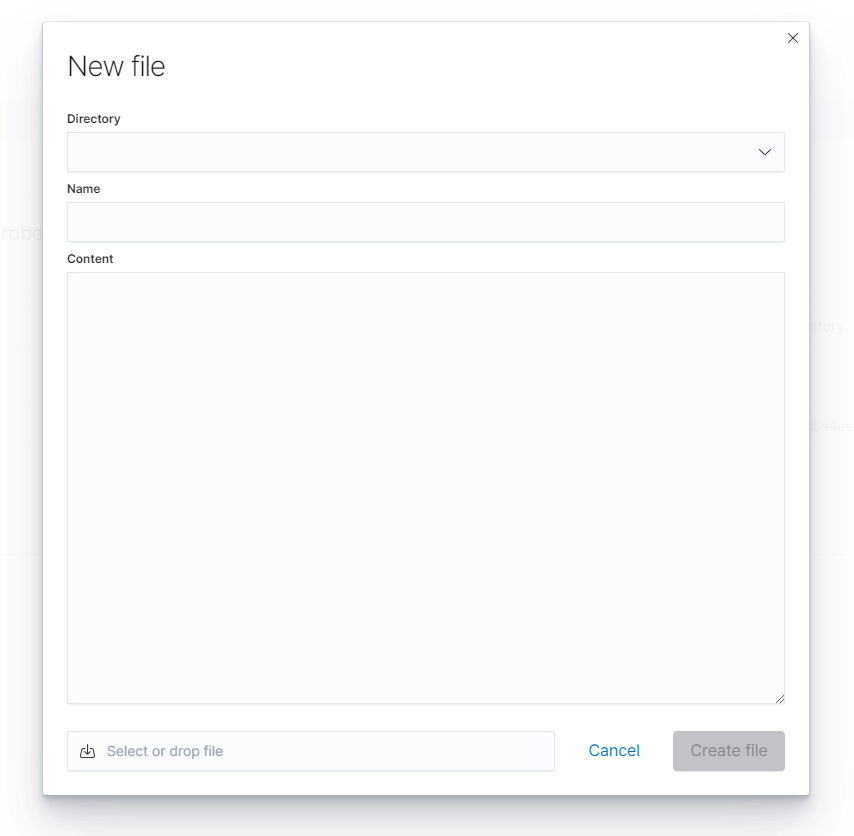
Click New File. Select the directory, enter the file name with its extension, and type the content, or upload an existing file with the field in the lower-left corner. You can create files only in the managed directories and only with an allowed extension. A .conf file is validated when you save it, and a parsing error blocks the save.
Update file
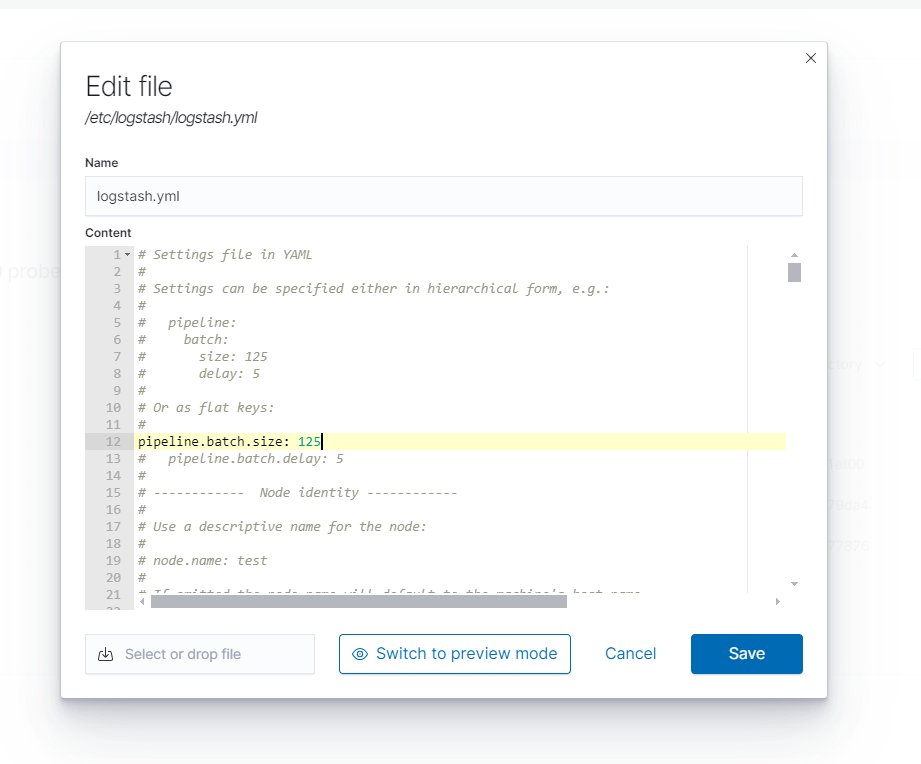
Choose Show or edit in the Actions menu, or click the eye icon for files without a status. The file opens in preview mode. Click Switch to edit mode to change the name or the content, or upload a new version of the file.
When you edit a .yml or .yaml file, the editor checks the syntax and marks the errors. Save stays disabled until you correct them.
Delete file
Choose Delete in the Actions menu, or click the trash icon, and confirm.
Enable/disable file
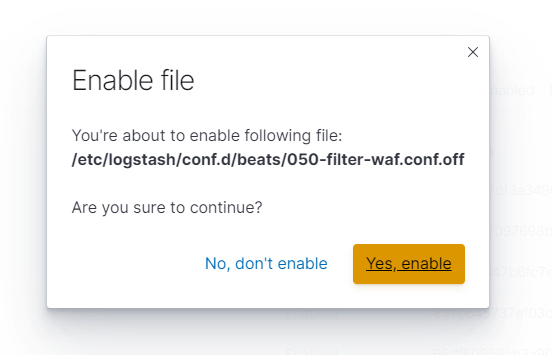
A configuration file can be enabled or disabled. The pipeline uses only enabled files, so you can disable a file, for example for testing. Choose Enable or Disable in the Actions menu, or click the status, and confirm.
Files parsing
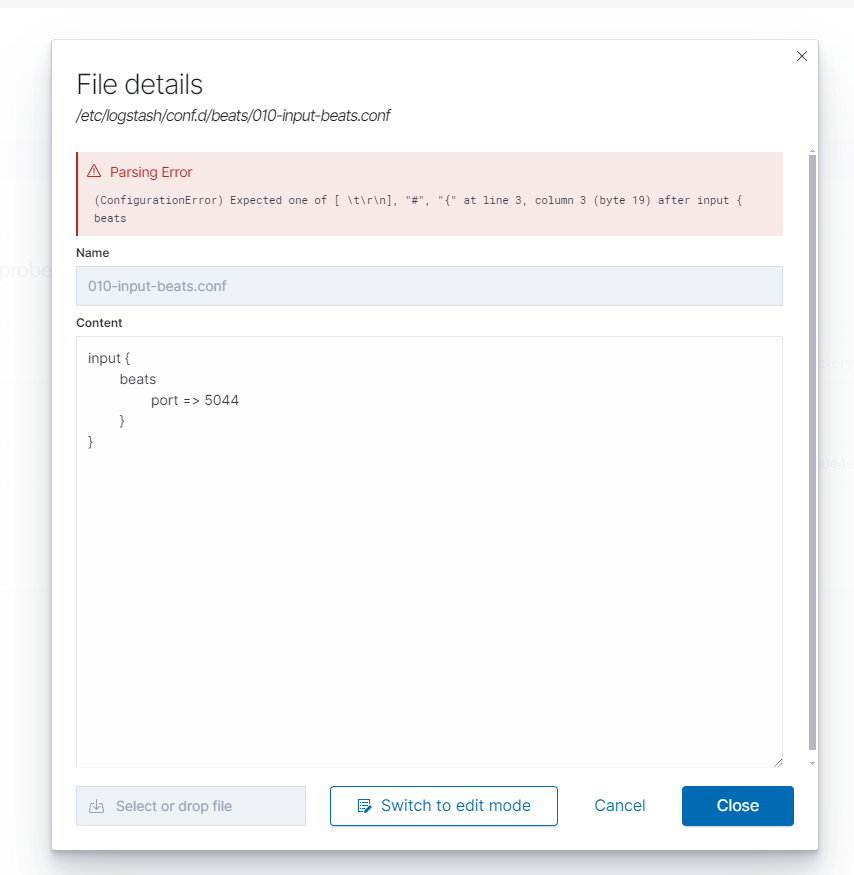
The probe parses .conf and .conf.off files in /etc/logserver-probe/conf.d/ to check their syntax. A file that cannot be parsed has a warning icon next to its path.
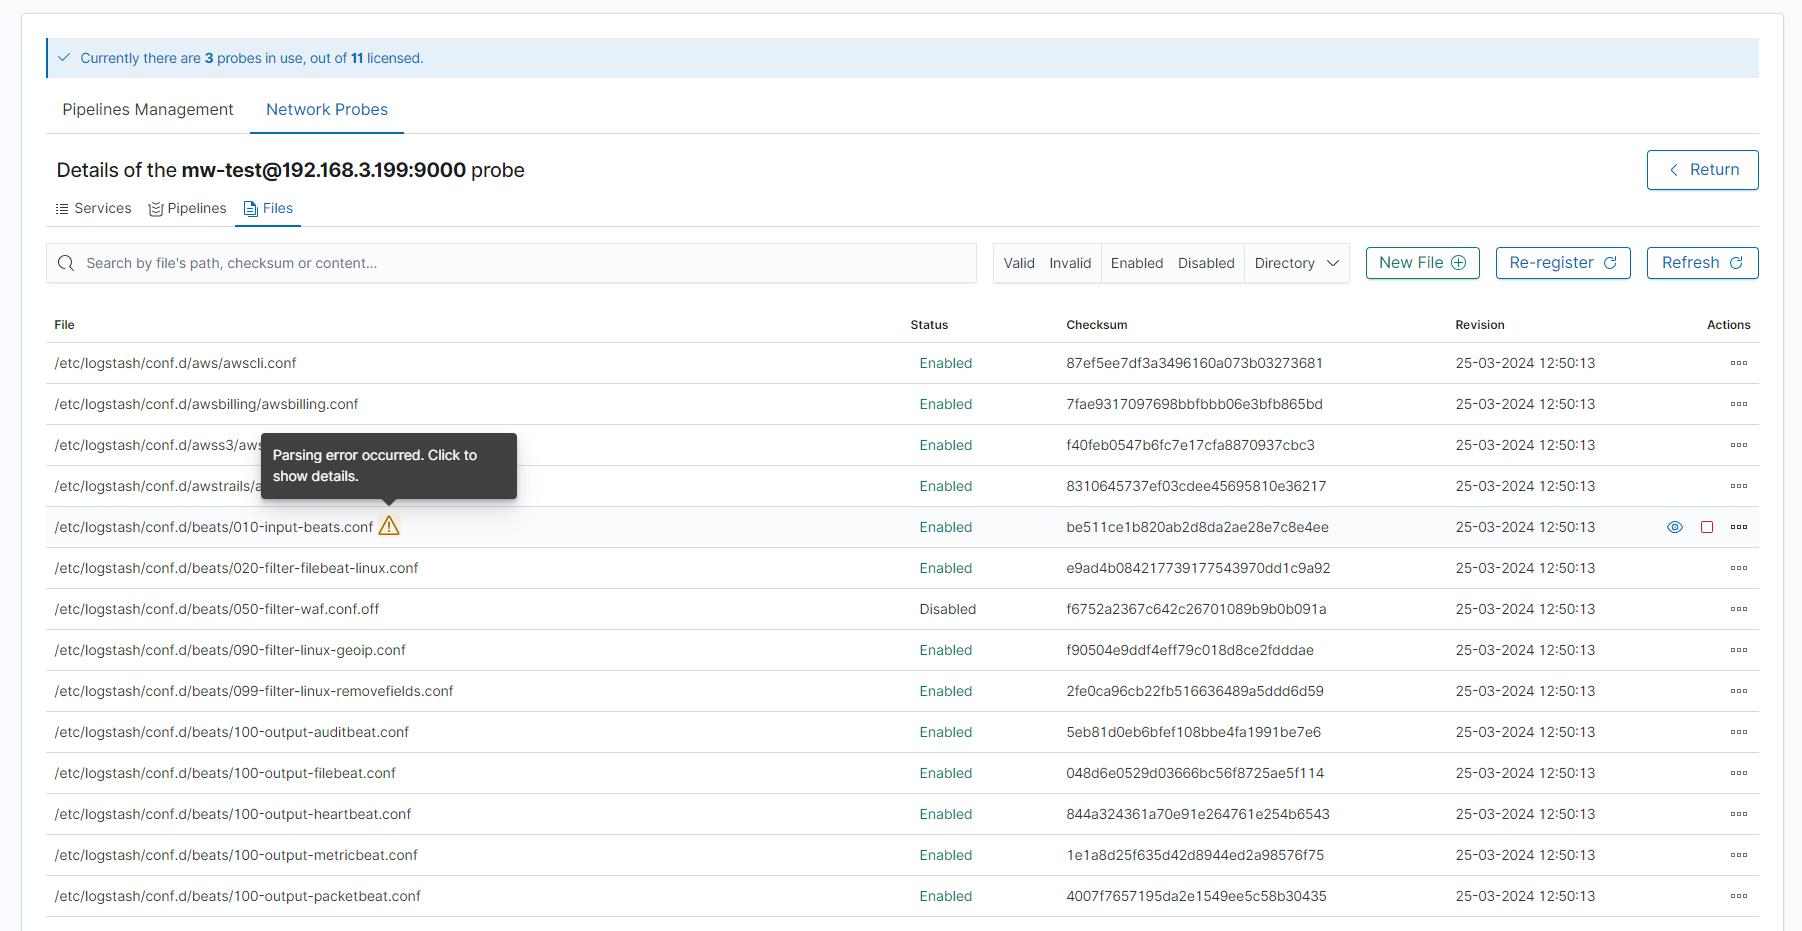
Click the icon to open the file with the parser message and correct the error.
Files’ revision consistency
The probe registers its files every 12 hours (registration_interval_hours in license-service.conf). A file that was not found in the latest registration, for example because someone deleted it directly on the probe, shows a warning icon in the Revision column with the message Outdated revision.

Click the icon to write the stored copy of the file back to the probe. If you deleted the file on purpose, delete it in the GUI as well.
Files re-registration
Click Register to register all files on the probe again. The registration also parses the pipeline configuration files. Click Refresh to see the result.