Suricata IDS
Suricata is one of the detection engines bundled with the Network Probe (see the bundled services table). It inspects live network traffic, matches it against a ruleset, and writes events as JSON. This chapter takes a fresh probe from a masked Suricata service to alerts visible in the Energy Logserver GUI.
What Suricata does
Suricata is a network threat detection engine (IDS and IPS):
Detects attacks such as SQL injection, cross-site scripting, malware callbacks, and port scans.
Parses application protocols: HTTP, DNS, TLS, SSH, SMB, NFS.
Matches traffic against the Emerging Threats ruleset (tens of thousands of signatures).
Can extract files carried in network traffic.
Writes events in JSON format to
/var/log/suricata/eve.json.
What Suricata One Click deploys
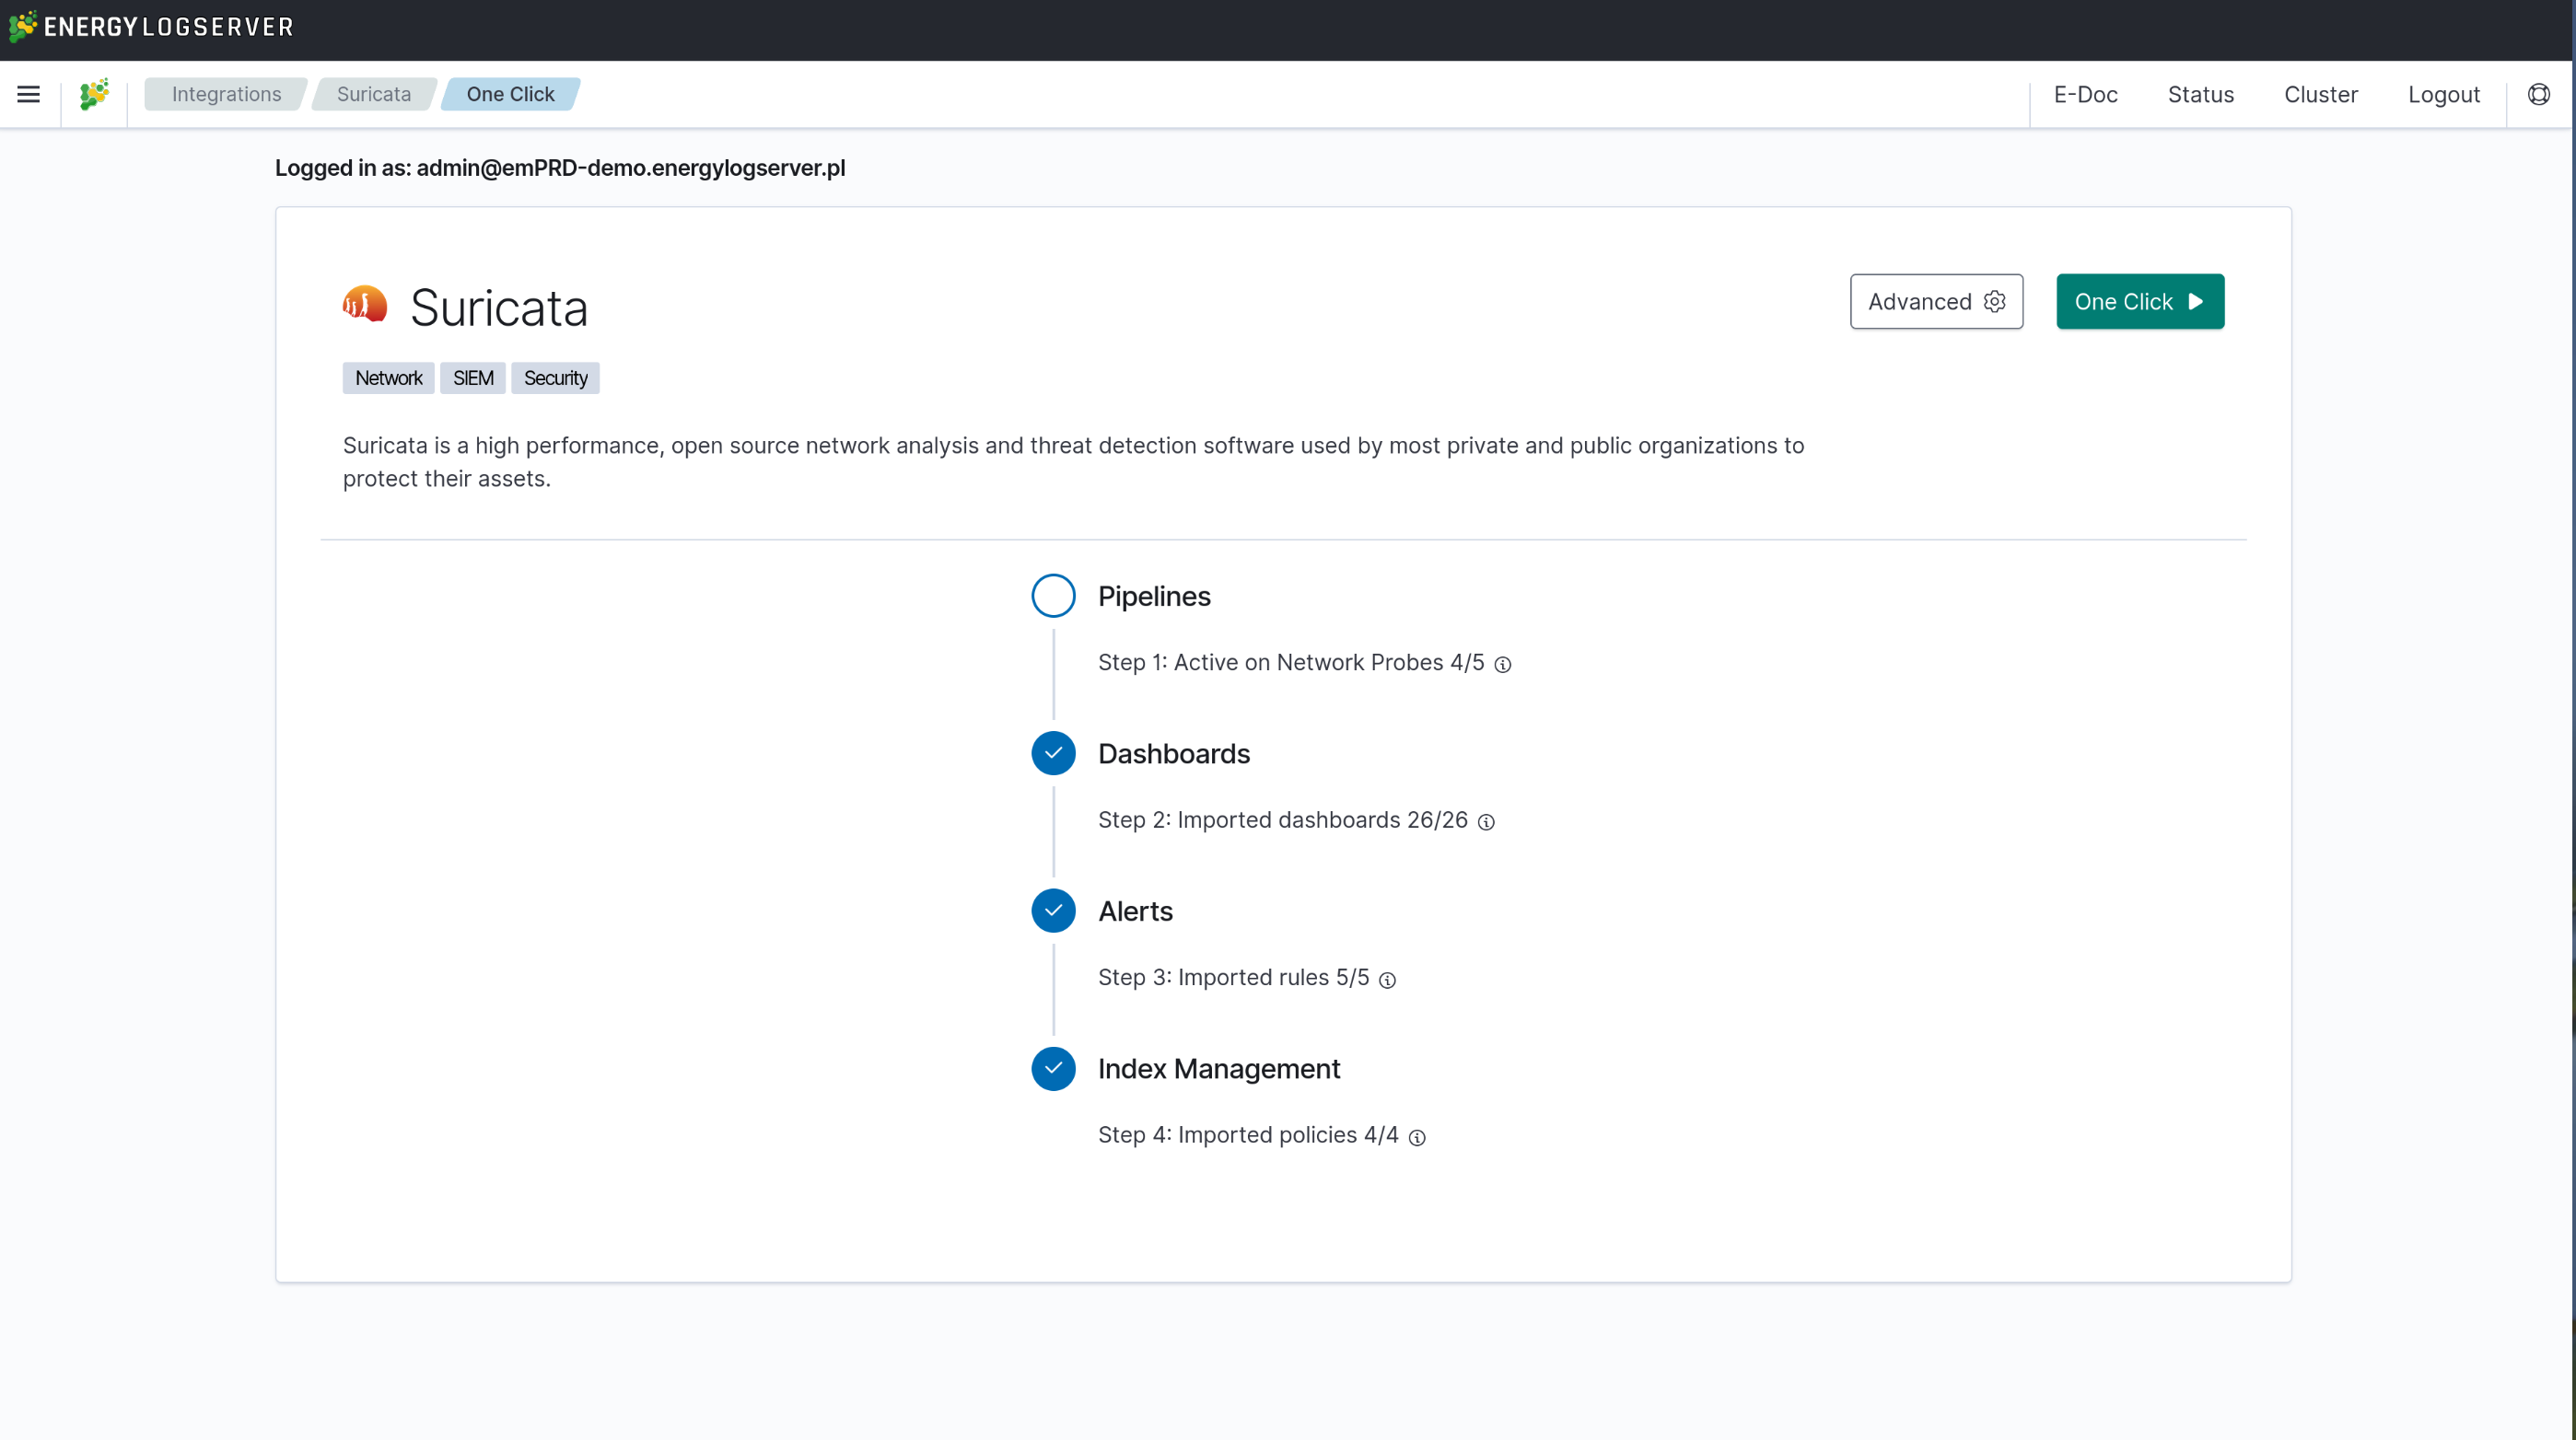
The Suricata entry in the Integrations catalog installs the Energy Logserver side of the pipeline in a single action. Open it from Tools → Integrations → Suricata and use One Click Installation. It sets up four component groups:
Component |
Purpose |
|---|---|
Pipelines |
The Network Probe pipeline that parses |
Dashboards |
26 Discover dashboards for alerts, flows, DNS, HTTP, TLS, SSH, SMB, NFS, and threats. |
Alerts |
5 predefined alert rules. |
Index Management |
Index lifecycle policies for the Suricata indices. |
How the pieces fit together
Before configuring anything, it helps to see the whole chain. Suricata inspects network traffic and writes events to eve.json. The Network Probe pipeline reads that file, parses it, and writes the events into Energy Logserver indices. The GUI, through its dashboards and Discover, then reads those indices and shows them to you.
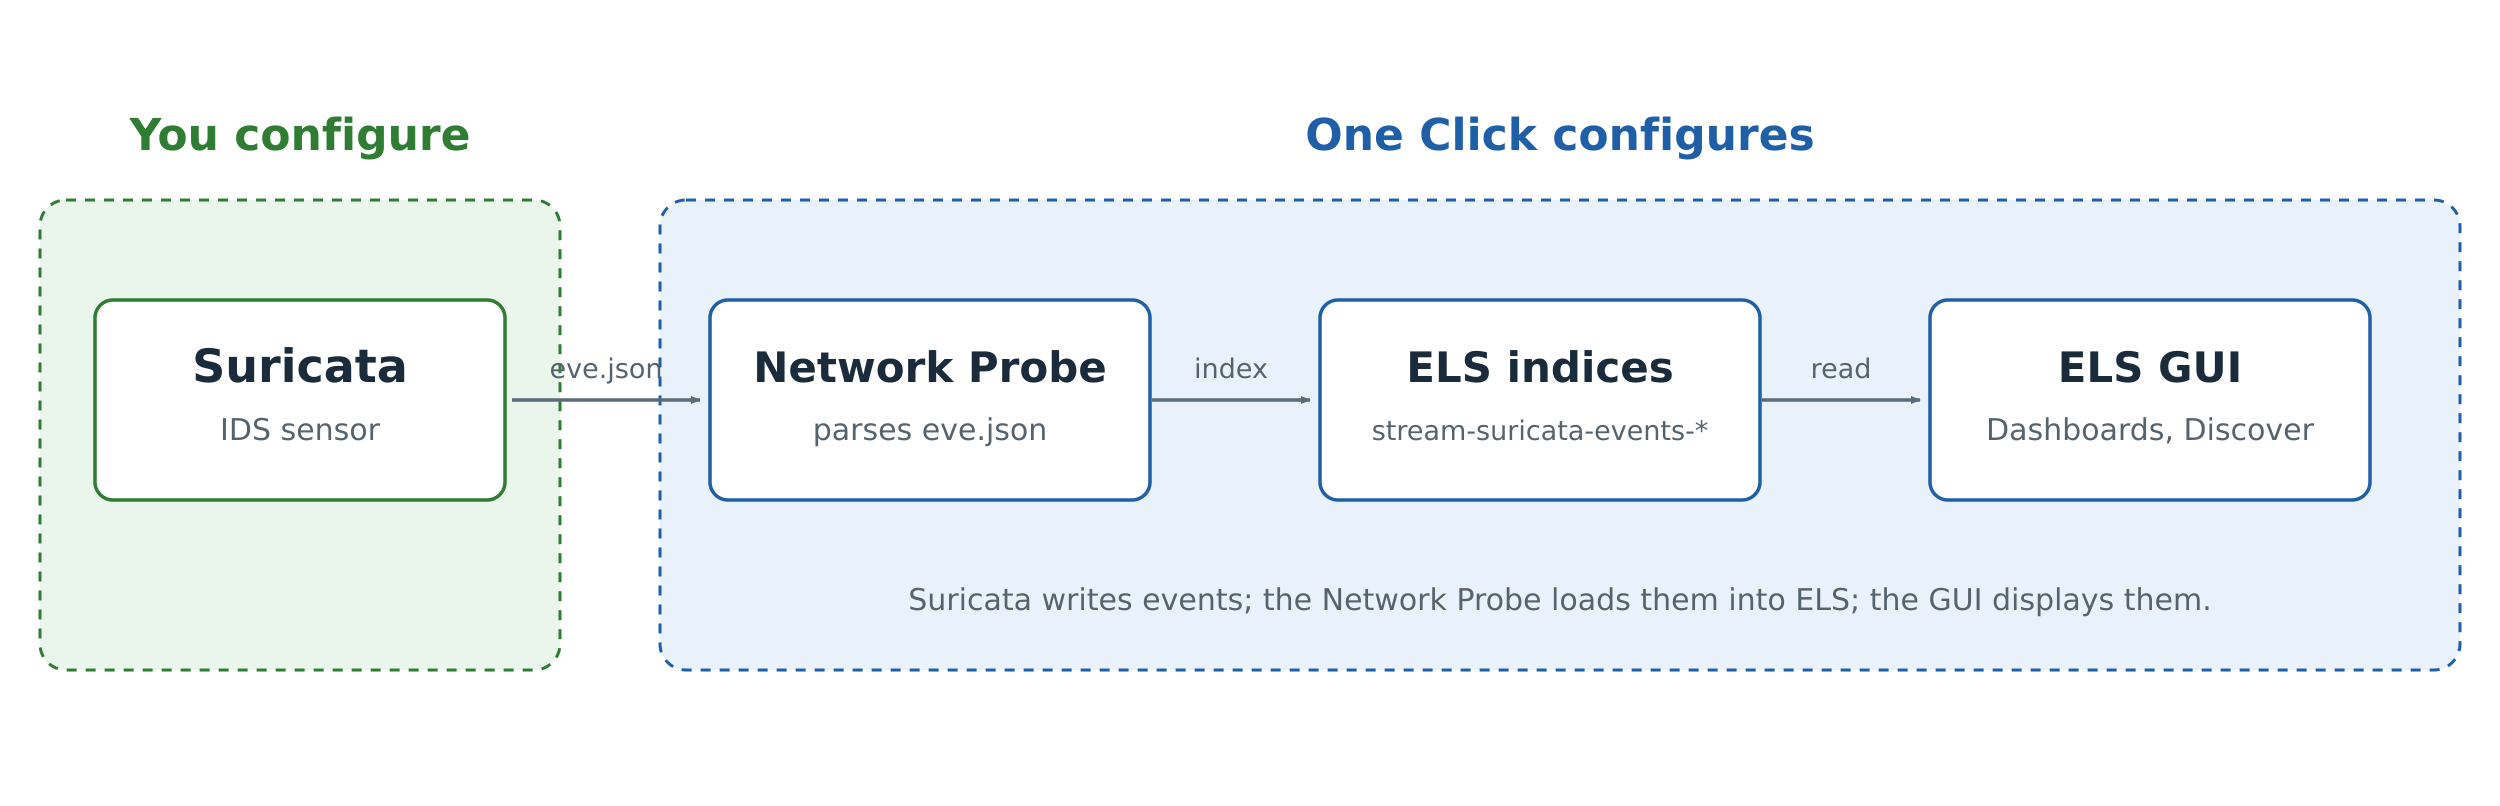
One Click sets up the middle and right of this chain: the pipeline, the indices with their lifecycle policies, and the dashboards. The steps below configure the left side, Suricata itself, because that part depends on your host and network and cannot be set up centrally.
Why manual host configuration is needed
One Click configures only the parts that are identical across every deployment. Three things stay in your hands because they are specific to the host:
The Suricata service is left masked. Masking is a systemd state in which the service unit is linked to
/dev/null, so the service cannot start until you unmask it. This prevents Suricata from running before it has a capture interface and a ruleset.The capture interface is not auto-detected. The correct interface depends on which network card actually sees the traffic you want to monitor, which no central process can know.
The ruleset is not downloaded. Rulesets are a policy and licensing decision (ET Open, ET Pro, or custom sources) and are fetched on the host with
suricata-update.
Requirements
Root SSH access to the Energy Logserver host running the Network Probe.
Admin access to the Energy Logserver GUI.
Port 22 (SSH) reachable.
Port 443 (GUI) reachable.
Step 1: Deploy the Energy Logserver components (GUI)
Log in to the GUI at
https://<IP-ADDRESS-OR-HOSTNAME>.Open Tools → Integrations and select the Suricata card.
Click One Click and wait one to two minutes for the deployment to finish.
Confirm that every component group reports as installed: the Pipelines, Dashboards, Alerts, and Index Management steps all show their full counts.
Step 2: Unmask the Suricata service (SSH)
Connect to the host:
ssh root@<IP-ADDRESS-OR-HOSTNAME>
Check the current state:
systemctl status suricata
Expected output:
o suricata.service
   Loaded: masked (Reason: Unit suricata.service is masked.)
   Active: inactive (dead)
Unmask the service:
systemctl unmask suricata
Expected output:
Removed /etc/systemd/system/suricata.service.
Step 3: Identify the capture interface
List the available interfaces:
ip link show | grep -E "^[0-9]+:"
Example output:
1: lo: <LOOPBACK,UP,LOWER_UP> ...          # loopback, do not use
2: ens192: <BROADCAST,MULTICAST,UP,LOWER_UP> ...
Inspect the candidate interface:
ip addr show <INTERFACE>
Choose the interface that sees the traffic you want Suricata to monitor. On a sensor with a dedicated capture port, that is the port connected to the SPAN or mirror source, not the management interface.
Step 4: Bind Suricata to the interface with a systemd override
Create an override so Suricata always starts on the chosen interface:
mkdir -p /etc/systemd/system/suricata.service.d

cat > /etc/systemd/system/suricata.service.d/override.conf <<'EOF'
[Service]
# Clear the unit's default ExecStart before setting a new one
ExecStart=
# Start Suricata on the chosen capture interface
ExecStart=/sbin/suricata -c /etc/suricata/suricata.yaml --pidfile /var/run/suricata.pid -i <INTERFACE>
EOF
Reload the systemd configuration:
systemctl daemon-reload
Verify the override took effect:
systemctl cat suricata.service | grep "ExecStart"
Expected output:
ExecStart=/sbin/suricata -c /etc/suricata/suricata.yaml --pidfile /var/run/suricata.pid -i <INTERFACE>
Note
Replace <INTERFACE> with the name from Step 3 (for example ens192). This override is the deployment-specific counterpart to the capture-interface note in Installation.
Step 5: Set HOME_NET
HOME_NET tells Suricata which address ranges are your internal network, so it can tell inbound from outbound and score direction-sensitive rules correctly.
Back up the configuration first:
cp /etc/suricata/suricata.yaml /etc/suricata/suricata.yaml.backup
Edit /etc/suricata/suricata.yaml and find the vars section near the top:
vars:
  address-groups:
    HOME_NET: "[192.168.0.0/16,10.0.0.0/8,172.16.0.0/12]"
Set HOME_NET to your own ranges, then verify:
grep "HOME_NET:" /etc/suricata/suricata.yaml | head -1
Expected output (example):
HOME_NET: "[10.4.9.0/24]"
Step 6: Download the ruleset
suricata-update
The download takes two to three minutes. Verify that the rules landed:
wc -l /var/lib/suricata/rules/suricata.rules
Expected output (example):
62019 /var/lib/suricata/rules/suricata.rules
Step 7: Test the configuration
Validate the configuration before starting the service:
suricata -T -c /etc/suricata/suricata.yaml
A successful test ends with a notice that the configuration was successfully loaded.
Enable promiscuous mode on the capture interface so it accepts frames not addressed to it:
ip link set <INTERFACE> promisc on
ip link show <INTERFACE> | grep PROMISC
Expected output (example):
2: ens192: <BROADCAST,MULTICAST,PROMISC,UP,LOWER_UP> ...
Step 8: Start Suricata
systemctl start suricata
systemctl status suricata
Expected output (example):
* suricata.service - Suricata Intrusion Detection Service
   Loaded: loaded (/usr/lib/systemd/system/suricata.service; ...)
   Active: active (running)
Enable start on boot:
systemctl enable suricata
Step 9: Verify that events are flowing
Check that Suricata is writing events:
ls -lh /var/log/suricata/eve.json
sleep 30
ls -lh /var/log/suricata/eve.json
The file size should grow between the two listings.
Check the event types being written:
tail -50 /var/log/suricata/eve.json | jq -r .event_type | sort | uniq -c
Expected output (example):
     15 flow
      8 http
      3 stats
      2 dns
      1 alert
Verify end to end with test traffic
These tests confirm the whole chain, from the sensor to the dashboards, by generating traffic that trips known rules.
Install a target web server:
dnf install httpd -y
systemctl start httpd
systemctl enable httpd
Generate traffic that matches Emerging Threats rules:
# Web scanner signature
curl -A "nikto/1.0" http://<YOUR-SERVER-IP>/

# SQL injection attempt
curl "http://<YOUR-SERVER-IP>/?id=1' OR '1'='1"
Count the alerts after a short wait:
sleep 30
grep '"event_type":"alert"' /var/log/suricata/eve.json | wc -l
List the alert signatures that fired:
grep '"event_type":"alert"' /var/log/suricata/eve.json | jq -r '.alert.signature'
Example output:
ET SCAN Nikto Web Scanner Detected
ET WEB_SPECIFIC_APPS SQL Injection Attempt
Alerts in eve.json confirm that the rules load and match. The next section confirms that the pipeline carries them into the GUI.
Explore in dashboards and Discover
Dashboards
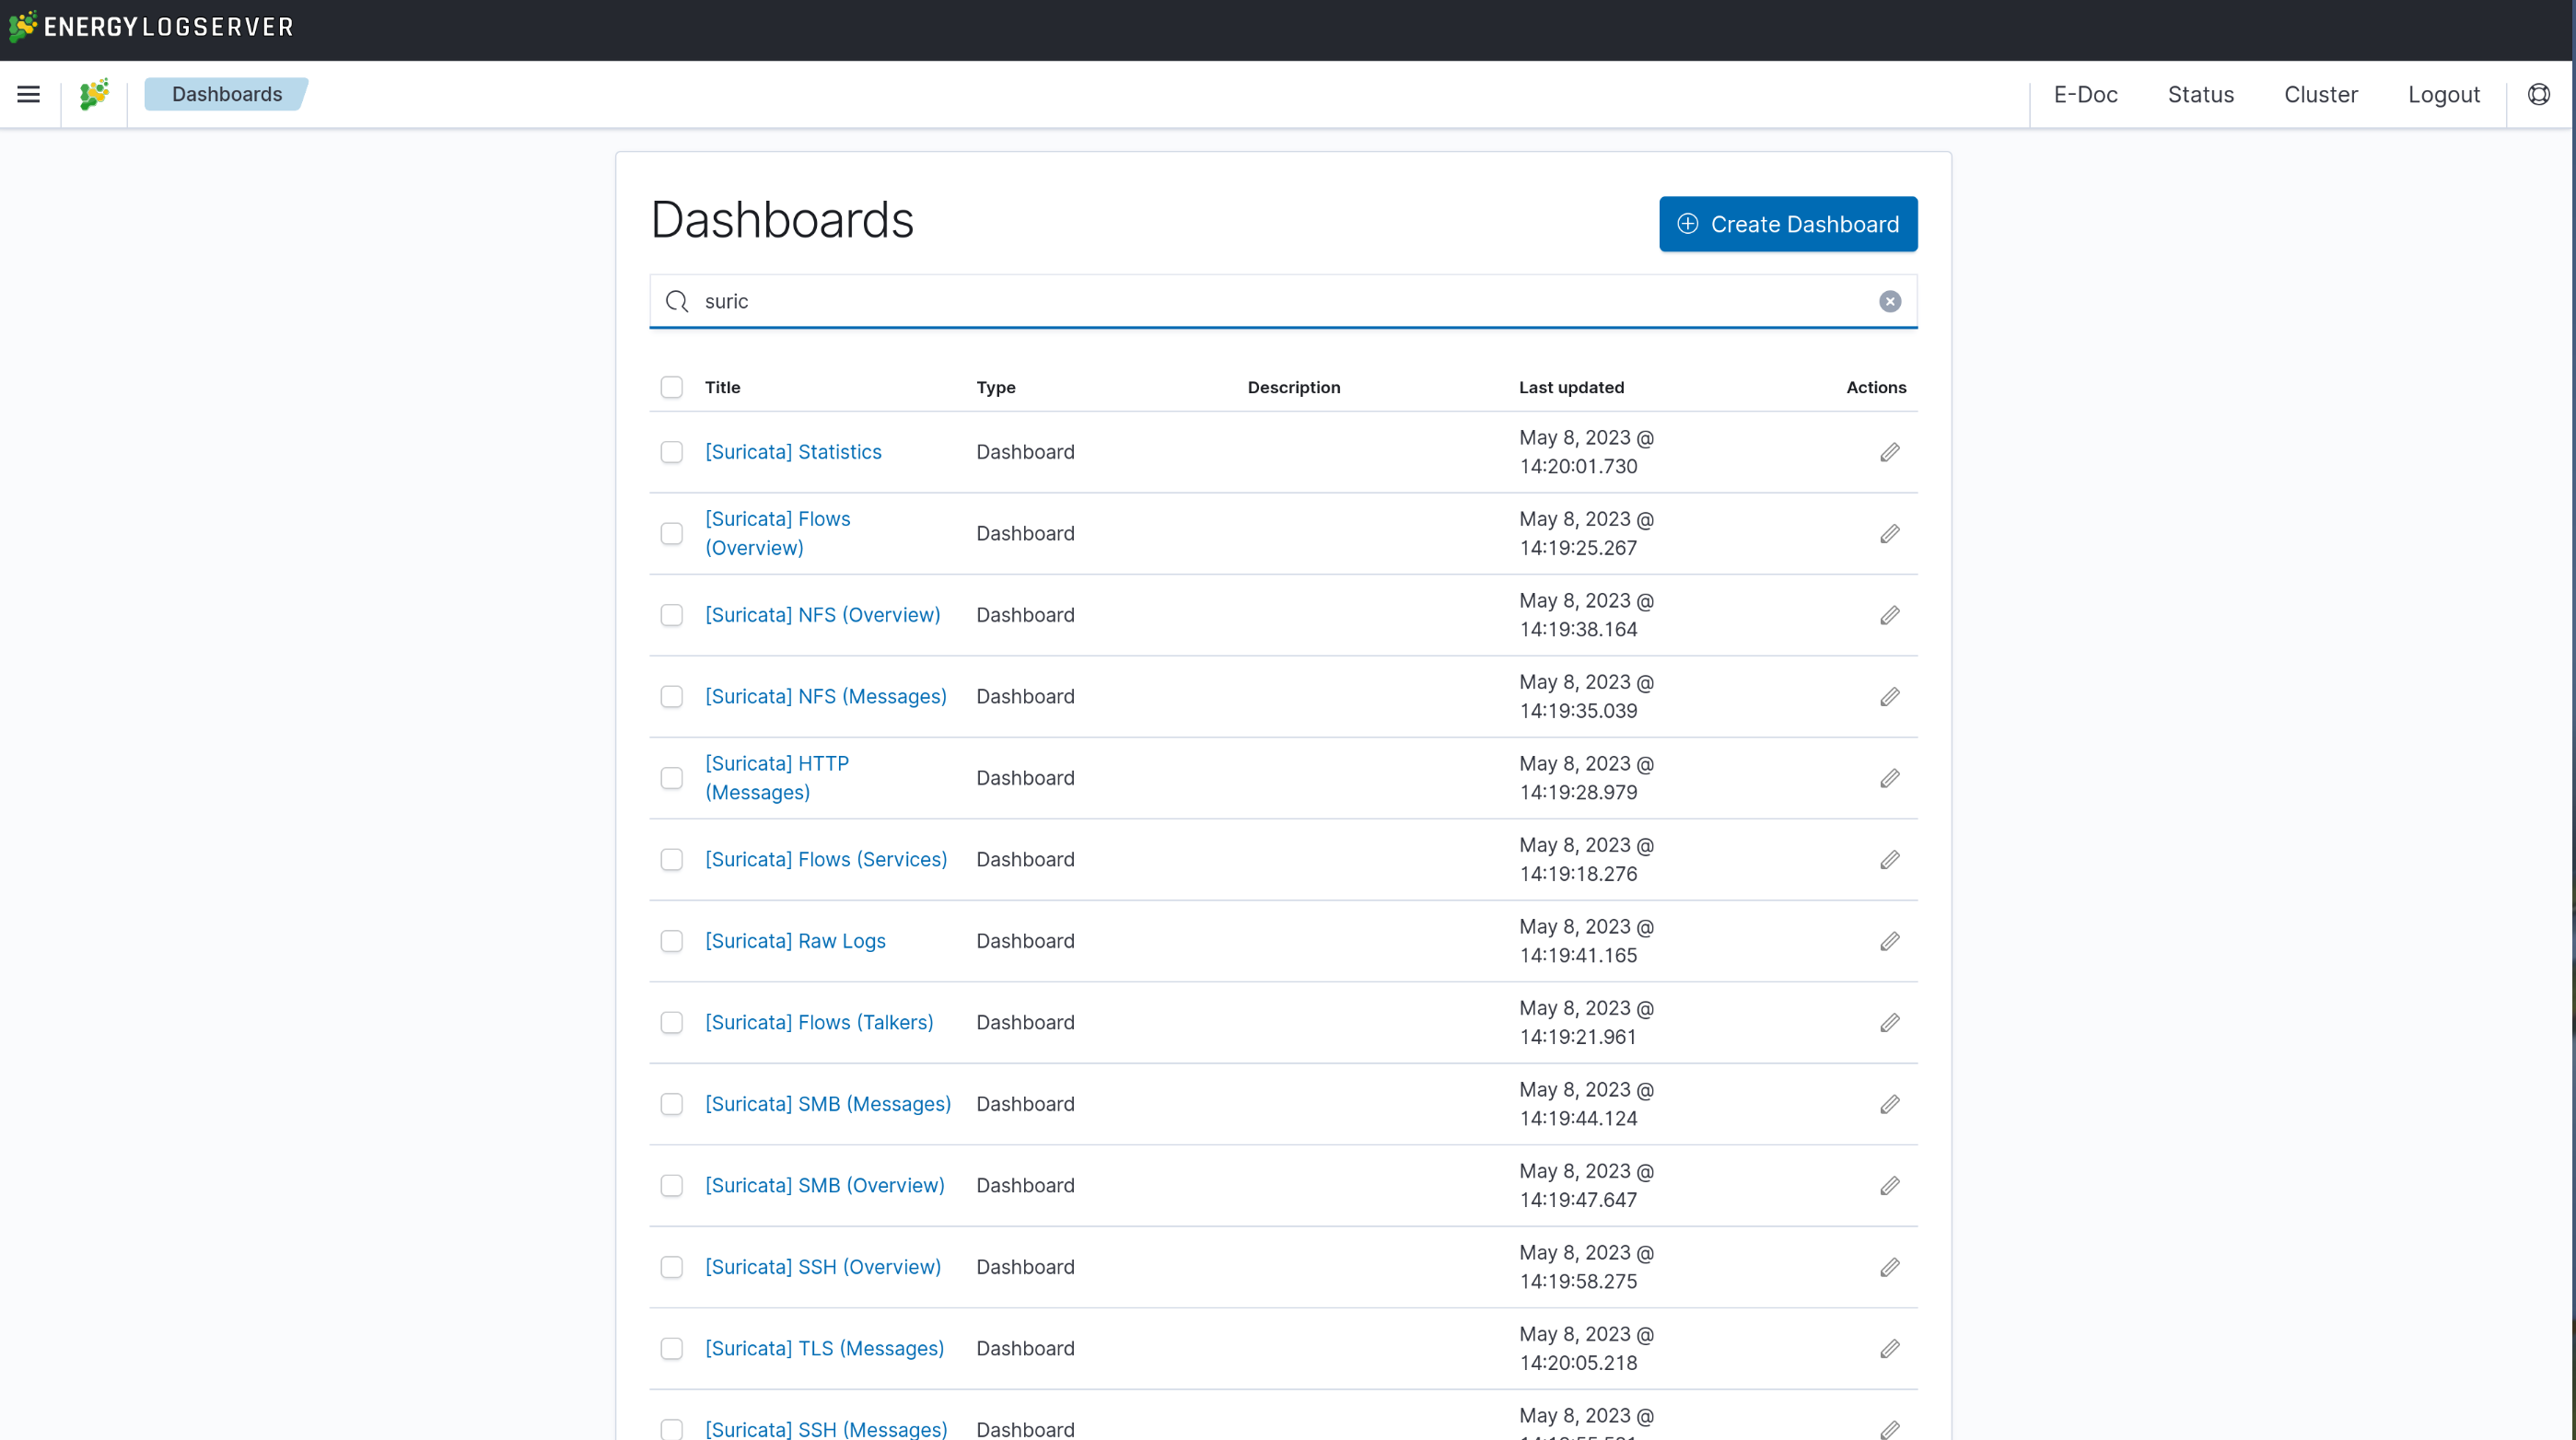
Open Menu → Dashboards and search for suricata. The One Click deployment imports 26 dashboards.
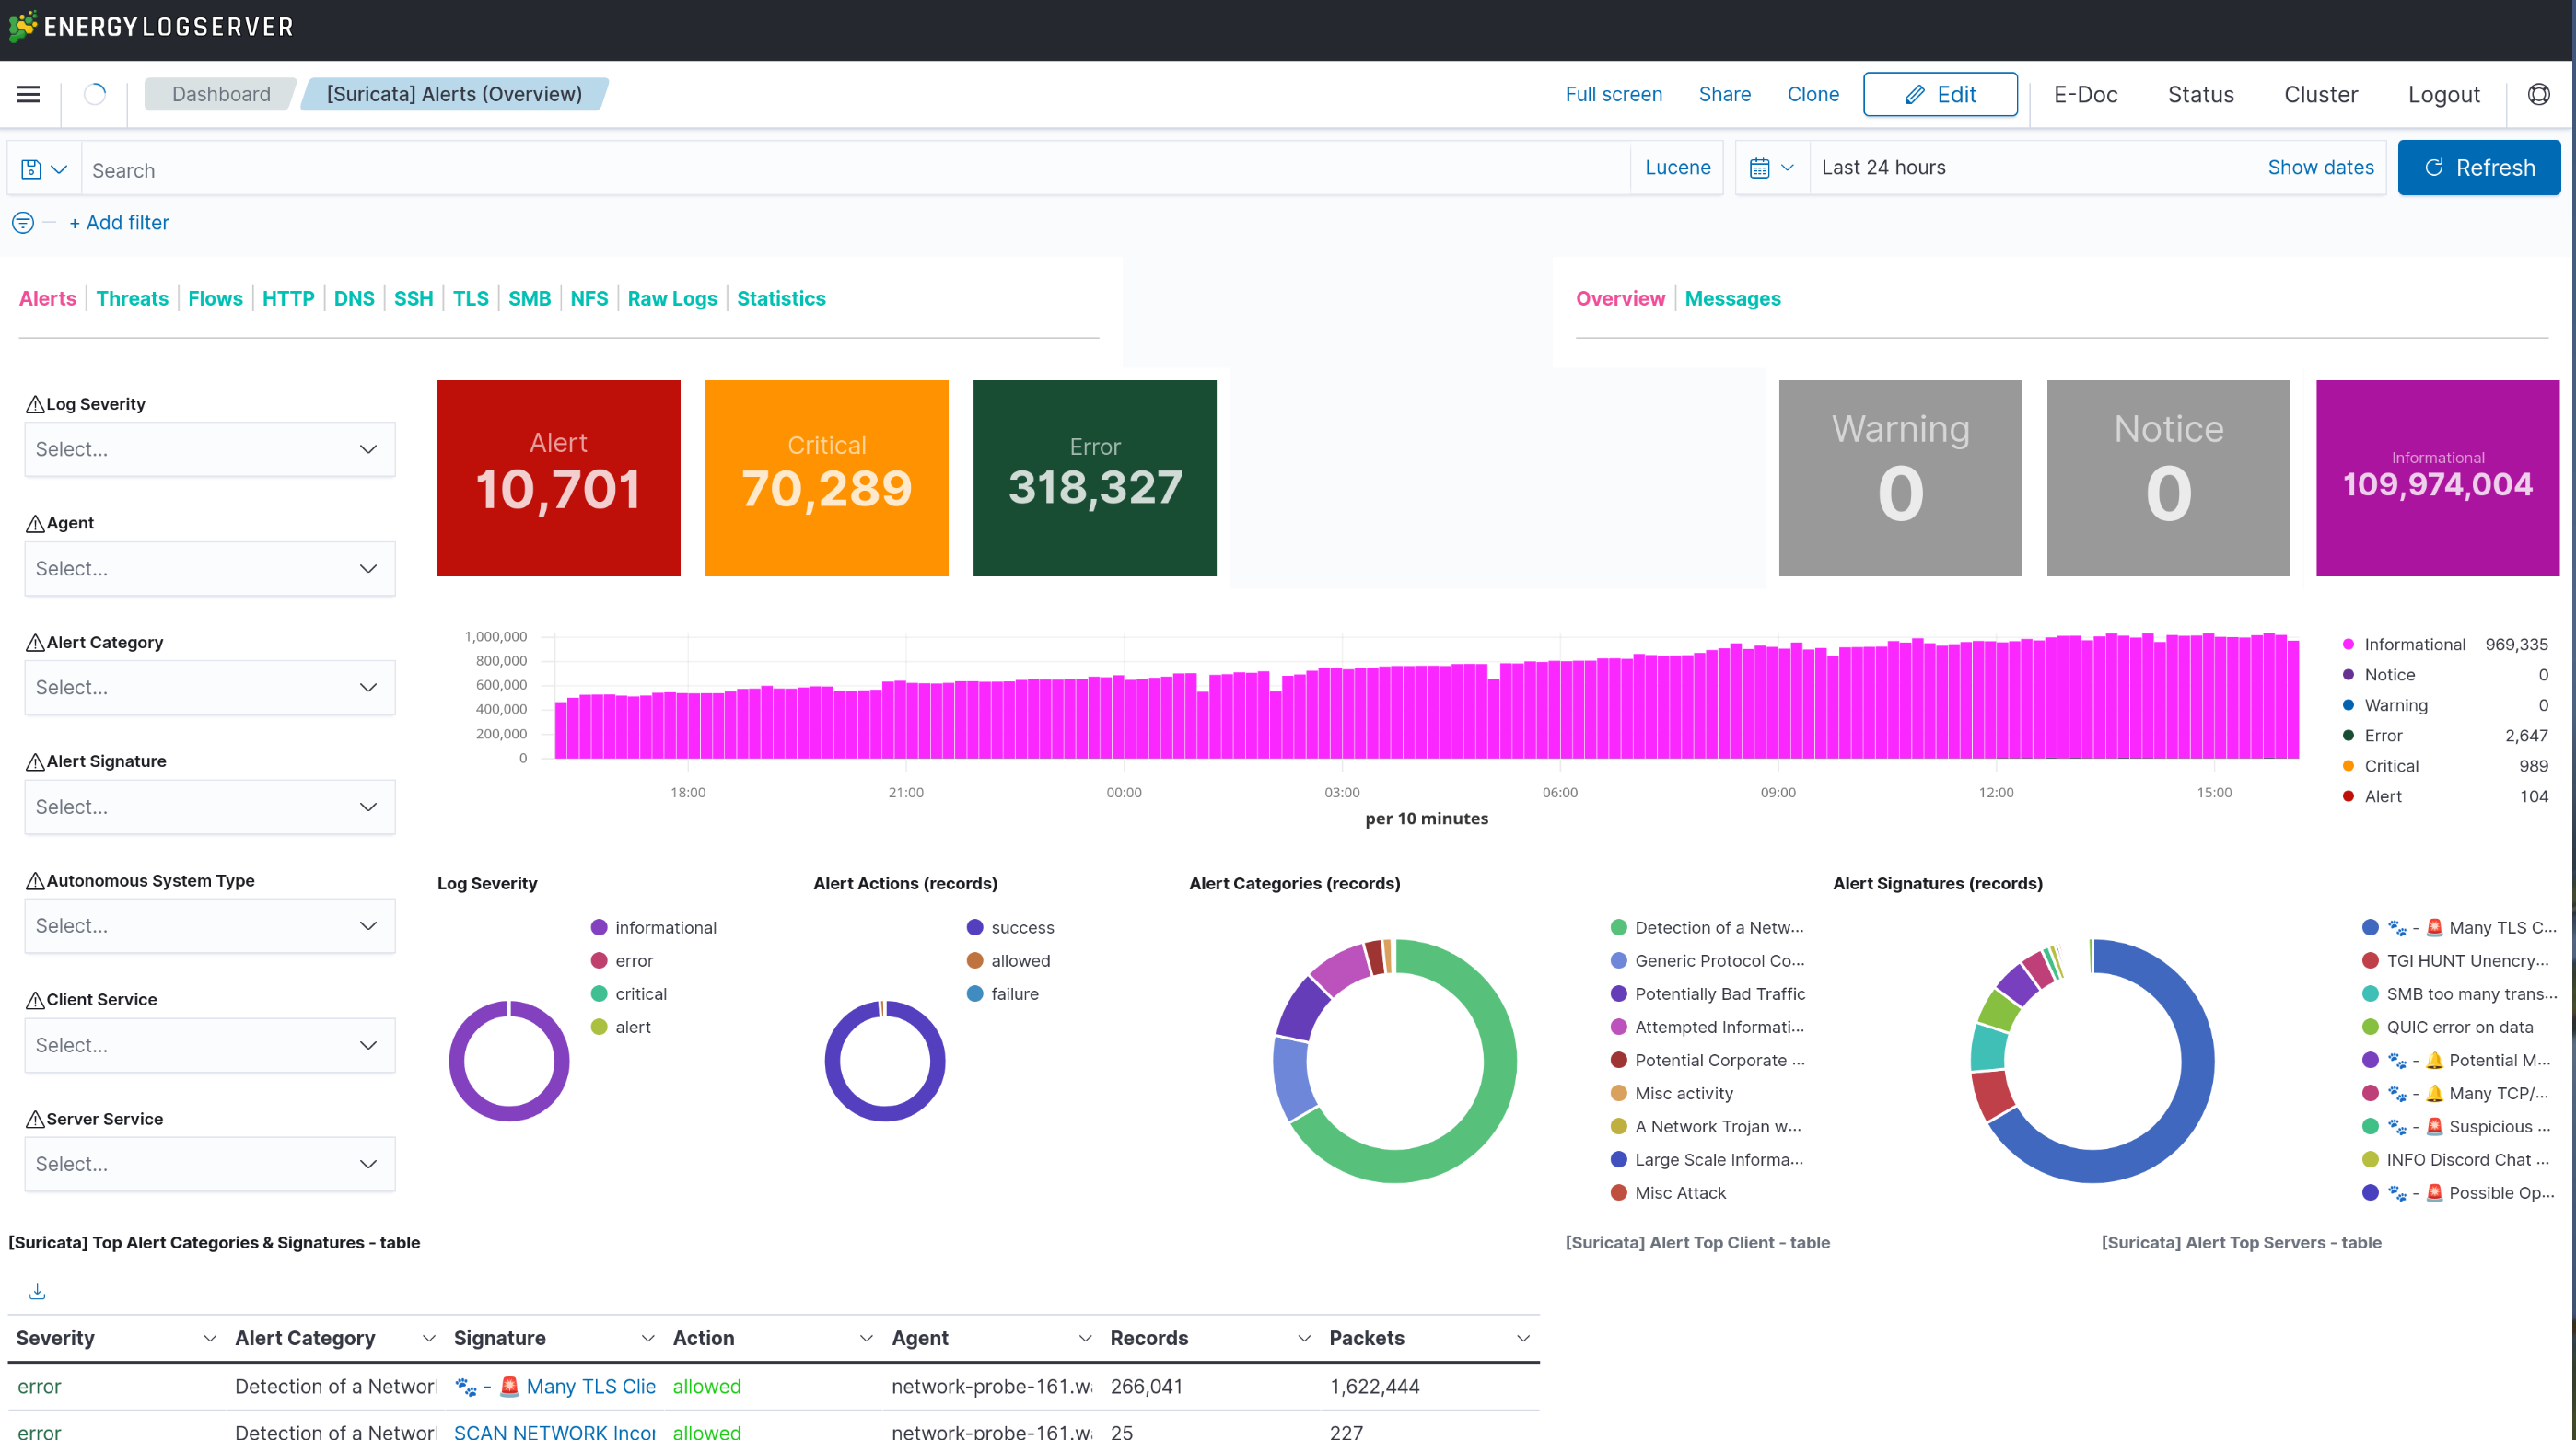
Open [Suricata] Alerts (Overview) for a threat-focused summary, then set the time picker (top right) to a range that covers your test traffic.
Discover
Discover is where you read the raw Suricata events. Open Menu → Discover and select the index pattern:
stream-suricata-events-*
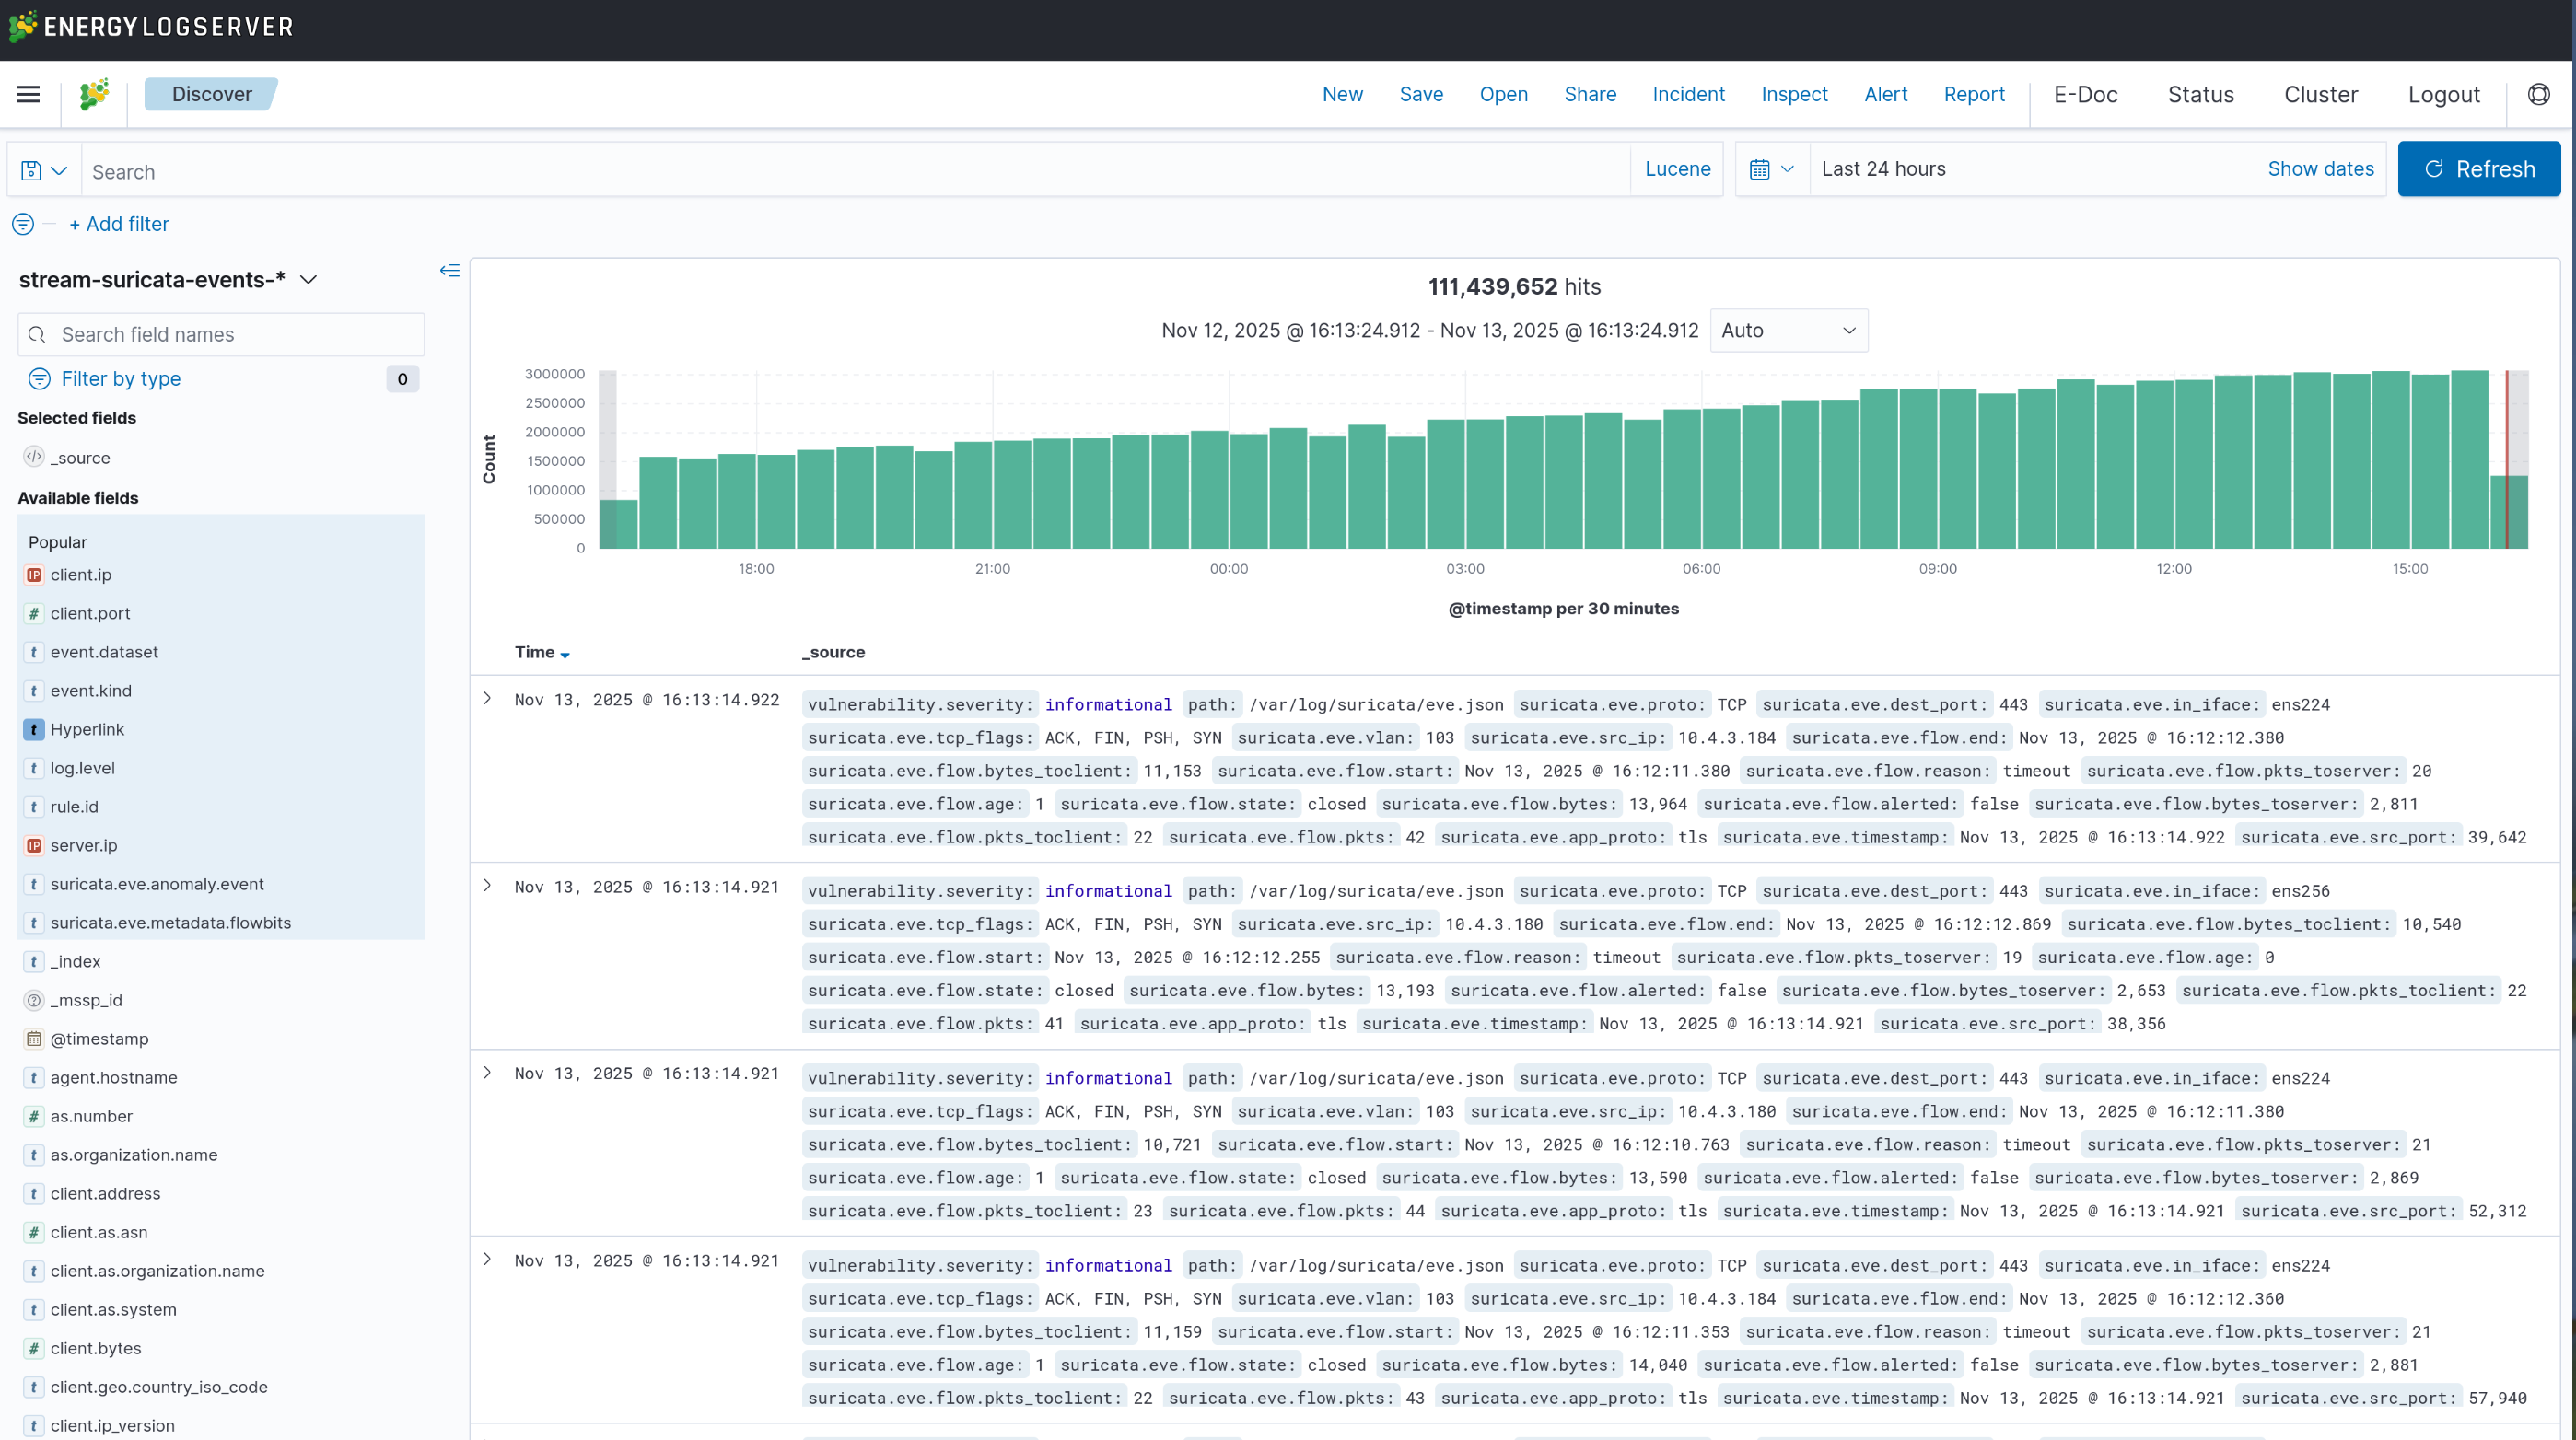
If you see “No results match your search criteria”, work through these causes in order:
Wrong time range. The most common cause. Set the time picker to
Last 1 hourright after starting Suricata, orLast 7 daysfor older events.Suricata not running. Run
systemctl status suricata. If it is not active, start it (Step 8); if it fails to start, see Troubleshooting.No traffic. Confirm events exist with
tail -50 /var/log/suricata/eve.json.Pipeline not running. Run
systemctl status logserver-probe.
Useful searches
The Discover search bar uses Lucene syntax:
event_type:"alert"                                  # all alerts
event_type:"http"                                   # HTTP events
src_ip:"<IP-ADDRESS>"                               # by source
dest_ip:"<IP-ADDRESS>"                              # by destination
alert.severity:1                                     # 1 = critical, 2 = high, 3 = medium
alert.signature:"SQL Injection"                     # by signature text
event_type:"alert" AND alert.severity:[1 TO 2]       # high severity only
event_type:"alert" AND NOT alert.category:"Not Suspicious Traffic"
Columns worth adding
The default _source column is hard to scan. Add these fields from the field list on the left to get a readable table:
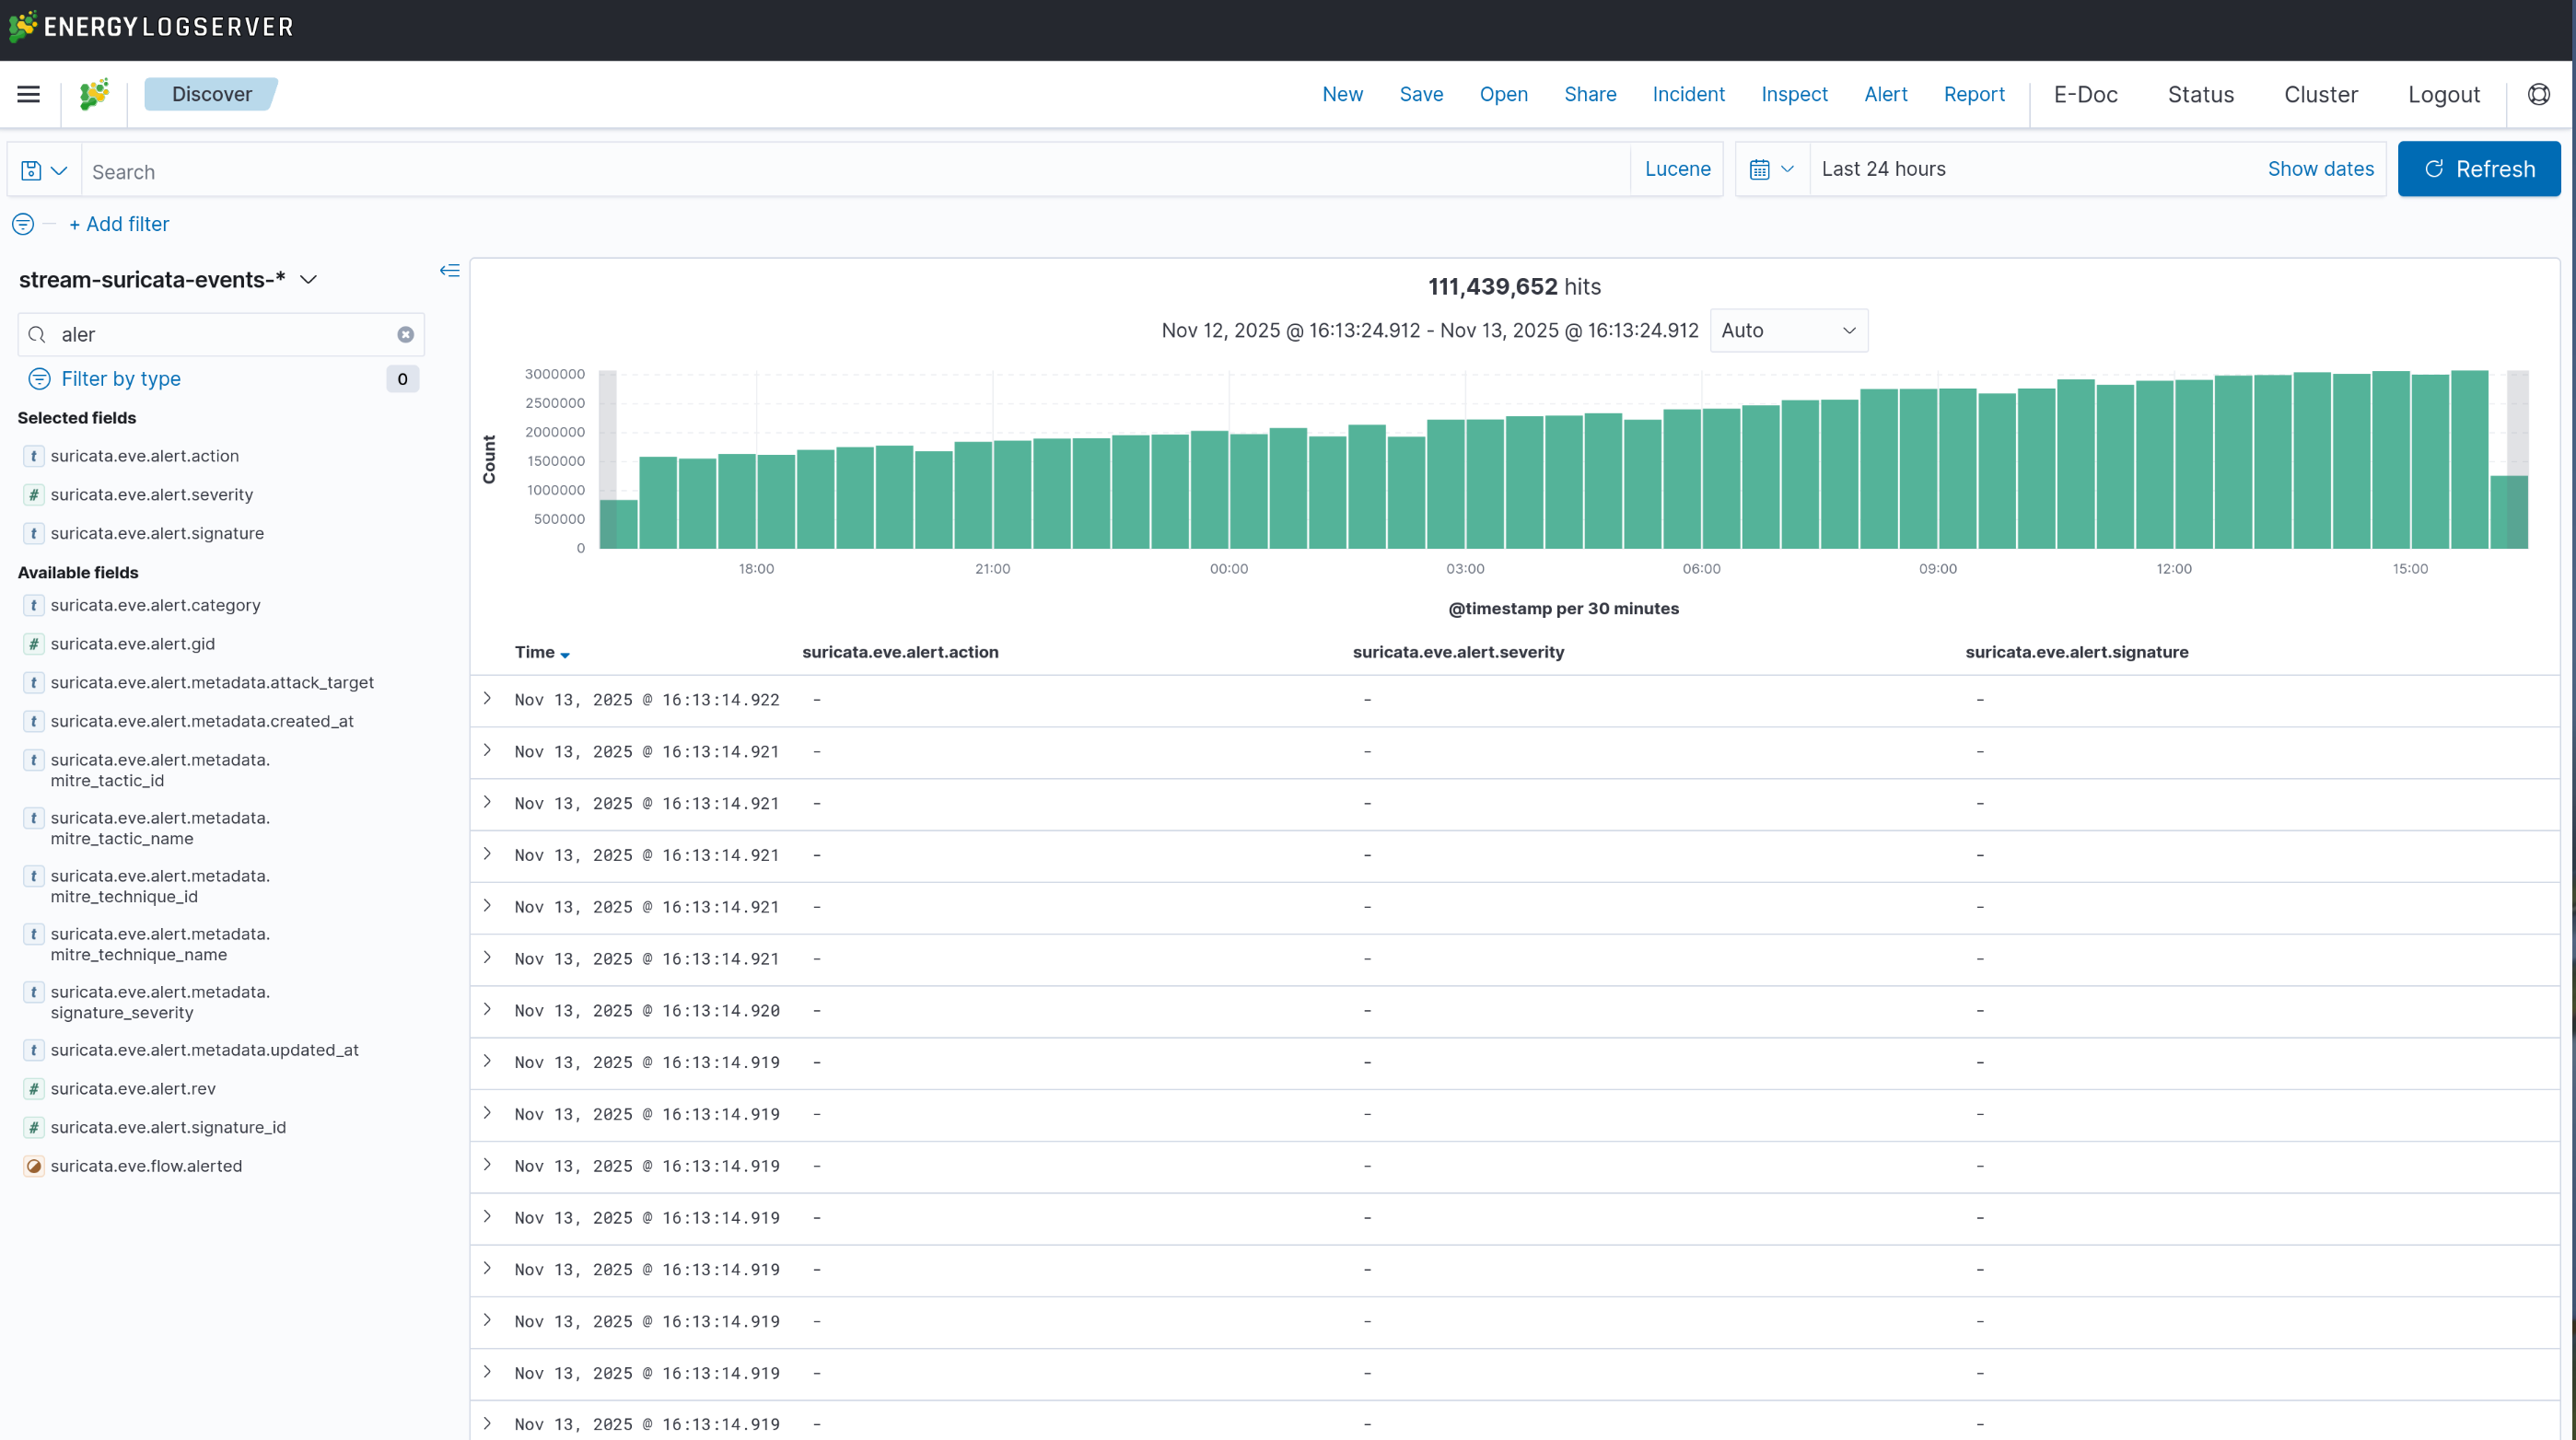
event_type        # event type
src_ip            # source
dest_ip           # destination
alert.severity    # severity
alert.signature   # alert name
proto             # protocol (TCP, UDP, ICMP)
Troubleshooting
“certificate signature failure” during One Click
If One Click fails at the pipeline step with unable to execute operation! certificate signature failure, this is not a Suricata problem and is not related to the manual steps above. It comes from inconsistent license-service certificates and affects every integration installed through One Click. See Network Probe Troubleshooting for diagnosis and resolution.
Suricata will not start
Read the service log:
journalctl -u suricata -n 50
Common causes:
Unable to find iface '<name>': the interface in the systemd override does not exist. Recheck Step 3 and Step 4.Config validation failed: run
suricata -T -c /etc/suricata/suricata.yamland fix the reported line.Permission denied on
eve.json: reset ownership.chown -R suricata:suricata /var/log/suricata chmod 755 /var/log/suricata
High CPU or memory use
Each option below trades some detection or capture for lower load. Read the trade-off before applying it.
Disable rule categories you do not need.
Cause: every enabled rule is evaluated against matching traffic, so categories you never look at still cost CPU.
Trade-off: you stop detecting those categories. Disable only what you knowingly do not monitor.
cat >> /etc/suricata/disable.conf <<'EOF'
group:*games*
group:*p2p*
group:*chat*
EOF
suricata-update --disable-conf=/etc/suricata/disable.conf
systemctl restart suricata
Limit the AF_PACKET worker threads.
Cause: by default Suricata runs one worker per CPU core (
threads: auto). On a many-core host each worker holds its own buffers and flow tables, which inflates CPU and memory even at low traffic.Trade-off: fewer workers means less capture throughput. On a busy link, setting this too low causes packet drops (see Packet drops). Lower it gradually and watch the drop rate.
Set the thread count in the
af-packetsection of/etc/suricata/suricata.yaml:af-packet: - interface: <INTERFACE> threads: 2
Disable file extraction if you do not need it.
Cause: with file extraction on, Suricata reassembles files carried in the traffic and writes them to disk, which is extra CPU and I/O unless you are actually collecting files.
Trade-off: you lose extracted-file capture and any file-hash rules that depend on it.
file-store:
  enabled: no
Packet drops
A sustained drop rate above roughly 1 percent means Suricata is not keeping up with the traffic and is missing events. Check the statistics:
journalctl -u suricata -n 50 | grep "Stats for"
If drops are high, apply these in order:
Increase the capture ring buffer in the
af-packetsection.Cause: the ring buffer absorbs bursts between the NIC and Suricata. When it fills, the kernel drops packets before Suricata ever sees them.
Trade-off: a larger ring pins more memory per interface. Double it and re-measure rather than setting it very high at once.
af-packet:
  - interface: <INTERFACE>
    ring-size: 4096
Disable NIC offloading.
Cause: offloading features (GRO, LRO, TSO, GSO) hand Suricata pre-reassembled segments that no longer match what crossed the wire, which both hides detail and wastes work.
Trade-off: the CPU now does work the NIC used to, so expect slightly higher CPU. This is the accepted setup for capture interfaces.
ethtool -K <INTERFACE> tx off rx off gro off lro off tso off gso off
Raise the process priority (last resort).
Cause: under contention the scheduler may starve Suricata of CPU while it is trying to keep up with capture.
Trade-off: a negative
Nicevalue takes CPU from the other probe services (Kafka, pmacct, Zeek). Use it only after the ring buffer and offloading changes are not enough.Run
systemctl edit suricataand add aNice=-10line under[Service].
No alerts
Confirm the ruleset exists and is not empty:
ls -lh /var/lib/suricata/rules/suricata.rules
If missing or empty, run
suricata-updateand restart the service.Confirm
HOME_NETmatches your network (Step 5).Confirm rules loaded:
grep "rules loaded" /var/log/suricata/suricata.log
Events reach eve.json but not Discover
The data is stuck between Suricata and the GUI: Suricata writes eve.json, but the Network Probe pipeline is not reading it.
Check the pipeline service and its Suricata configuration:
systemctl status logserver-probe
ls -l /etc/logserver-probe/conf.d/suricata/
journalctl -u logserver-probe -f
Look for JSON parsing errors in the log. Then confirm the events reached the Data Node:
curl -X GET "localhost:9200/stream-suricata-events-*/_count?pretty"
A count of 0 means nothing has been indexed yet: go back and confirm Suricata is running and writing events.
Definition of terms
Term |
Meaning |
|---|---|
IDS / IPS |
Intrusion Detection System and Intrusion Prevention System. Suricata runs here as an IDS: it detects and logs, it does not block. |
eve.json |
Suricata’s JSON event log at |
HOME_NET |
The address ranges Suricata treats as your internal network. |
Emerging Threats (ET) |
The open ruleset Suricata matches traffic against. |
Masked service |
A systemd state in which a unit is linked to |
Promiscuous mode |
An interface mode that accepts all frames on the wire, not only those addressed to the host. |
Index pattern |
A wildcard such as |