Zeek
Zeek (formerly Bro) is one of the detection engines bundled with the Network Probe (see the bundled services table). It is a Network Security Monitor (NSM): instead of matching traffic against a signature ruleset, it parses every connection and writes detailed, structured logs of what happened on the network. This chapter takes a fresh probe from a masked Zeek service to events visible in the Energy Logserver GUI.
What Zeek does
Zeek is a passive network analyzer focused on protocol detail and behavior, not on blocking:
Writes per-protocol logs: connections (
conn.log), DNS, HTTP, SSL/TLS, SSH, SMB, files, and more.Records rich connection metadata: endpoints, duration, bytes, connection state, and detected service.
Runs a scripting language for custom detection and enrichment.
Detects protocol anomalies and notable events (
notice.log).Monitors passively from a mirror or SPAN port, so it adds no latency to the traffic it watches.
Zeek complements a signature engine such as Suricata: Suricata answers “did this match a known attack”, Zeek answers “what exactly happened on the wire”.
What Zeek One Click deploys
The Zeek entry in the Integrations catalog installs the Energy Logserver side of the pipeline in a single action. Open it from Tools → Integrations → Zeek and use One Click Installation.
Component |
Purpose |
|---|---|
Pipelines |
The Network Probe pipeline that reads Zeek’s JSON logs, parses them, and writes the events to the |
Note
Unlike the Suricata integration, Zeek One Click does not ship dashboards or predefined alert rules. Zeek’s value is its detailed logs: you read them in Discover and build the dashboards that fit what you monitor. Explore in Discover and Build your own dashboards cover both.
How the pieces fit together
Before configuring anything, it helps to see the whole chain. Zeek captures traffic on the monitored interface and writes its logs to /opt/zeek/spool/zeek/. The Network Probe pipeline reads those logs, parses them, and writes the events into Energy Logserver indices under stream-zeek-*. The GUI, through Discover and any dashboards you build, then reads those indices.
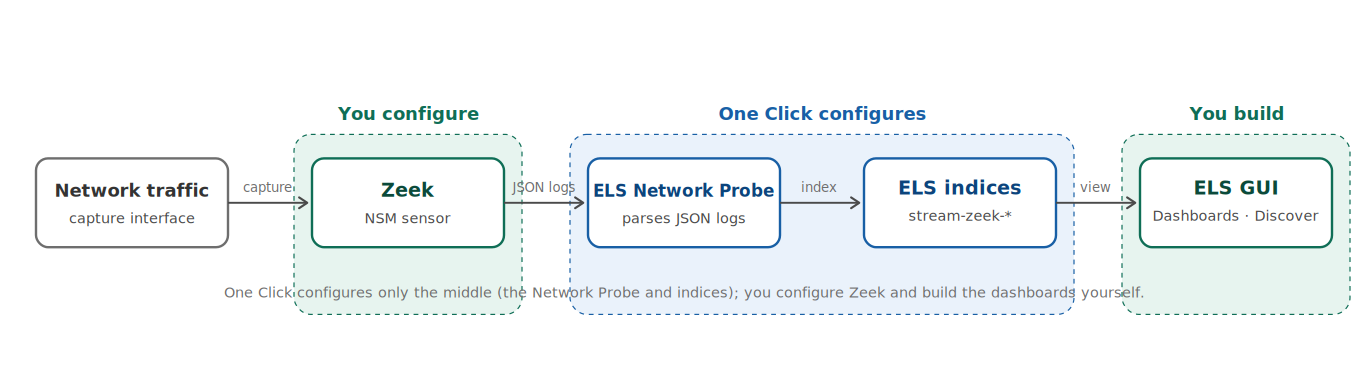
One Click sets up the middle of this chain: the pipeline and the indices with their template. Both ends are left to you. On the left you configure Zeek itself, because that depends on your host and network. On the right you explore the data and build dashboards, because what is worth visualizing depends on what you monitor.
Why manual host configuration is needed
One Click configures only the parts that are identical across every deployment. Three things stay in your hands because they are specific to the host:
The Zeek service is left masked. Masking is a systemd state in which the service unit is linked to
/dev/null, so the service cannot start until you unmask it. This prevents Zeek from running before it has a capture interface and configuration.The capture interface is not auto-detected. The correct interface depends on which network card actually sees the traffic you want to monitor, which no central process can know.
Zeek logs in TSV by default, not JSON. Zeek writes tab-separated logs out of the box, but the Network Probe pipeline expects JSON. You switch the output format on the host.
Requirements
Root SSH access to the Energy Logserver host running the Network Probe.
Admin access to the Energy Logserver GUI.
A capture interface that sees the traffic you want to monitor (a SPAN or mirror port).
Port 22 (SSH) reachable.
Port 443 (GUI) reachable.
Step 1: Deploy the Energy Logserver components (GUI)
Log in to the GUI at
https://<IP-ADDRESS-OR-HOSTNAME>.Open Tools → Integrations and select the Zeek card.
Click One Click and wait for the deployment to finish.
Confirm that the Pipelines step reports its pipeline as activated on every Network Probe you selected.
Step 2: Unmask the Zeek service (SSH)
Connect to the host:
ssh root@<IP-ADDRESS-OR-HOSTNAME>
Check the current state:
systemctl status zeek
Expected output:
o zeek.service
   Loaded: masked (Reason: Unit zeek.service is masked.)
   Active: inactive (dead)
Unmask the service:
systemctl unmask zeek
The service is now unmasked but not yet running: it starts once the interface and output format are set.
Step 3: Set the capture interface
Zeek reads its node layout from /opt/zeek/etc/node.cfg. List the available interfaces:
ip link show | grep -E "^[0-9]+:"
Example output:
1: lo: <LOOPBACK,UP,LOWER_UP> ...          # loopback, do not use
2: ens192: <BROADCAST,MULTICAST,UP,LOWER_UP> ...
Choose the interface connected to the SPAN or mirror source, not the management interface. Back up the configuration, then set the interface:
cp /opt/zeek/etc/node.cfg /opt/zeek/etc/node.cfg.backup
Edit /opt/zeek/etc/node.cfg and point the standalone node at your interface:
[zeek]
type=standalone
host=localhost
interface=<INTERFACE>
Note
Replace <INTERFACE> with the name from this step (for example ens192). This is the deployment-specific counterpart to the capture-interface note in Installation.
Optionally, set your internal address ranges in /opt/zeek/etc/networks.cfg. Zeek uses them to classify traffic direction, which populates the locality fields (private or public) on the events.
Step 4: Switch Zeek output to JSON
The Network Probe pipeline parses JSON, so enable Zeek’s JSON log policy. Back up the site configuration first:
cp /opt/zeek/share/zeek/site/local.zeek /opt/zeek/share/zeek/site/local.zeek.backup
Append the JSON policy load to /opt/zeek/share/zeek/site/local.zeek:
# Write all logs as JSON for the Network Probe pipeline
@load policy/tuning/json-logs.zeek
Step 5: Deploy and verify Zeek
Check the configuration, then deploy it. zeekctl deploy validates the scripts, installs them, and starts Zeek:
zeekctl check
zeekctl deploy
Confirm Zeek is running:
zeekctl status
Expected output (example):
Name         Type       Host          Status    Pid    Started
zeek         standalone localhost      running   12345  ...
Because the zeek.service unit starts Zeek through zeekctl deploy, use zeekctl status, not systemctl status zeek, to read the true state of the running node.
Confirm the logs are now JSON. Give Zeek a moment to see traffic on the interface, then read the current connection log:
head -2 /opt/zeek/spool/zeek/conn.log
A JSON line confirms the format:
{"ts":1731234567.123456,"uid":"CHFgkX3PJpvTcqGvi3","id.orig_h":"10.4.9.10", ...}
If you still see tab-separated columns with #separator header lines, the policy did not load: recheck Step 4 and run zeekctl deploy again.
Enable start on boot:
systemctl enable zeek
Step 6: Confirm the pipeline is reading the logs
The One Click deployment placed the Zeek pipeline on the probe. Confirm the files are present and the service is running:
ls /etc/logserver-probe/conf.d/zeek/
systemctl status logserver-probe
Expected pipeline files:
04-zeek-input.conf 10-zeek-filter.conf 30.output.conf ...
The input reads Zeek’s per-protocol logs from /opt/zeek/spool/zeek/ (conn.log, dns.log, http.log, ssl.log, and the rest) as JSON, and the output writes them to stream-zeek-*. Follow the probe log to confirm it picked up the files:
journalctl -u logserver-probe -f
Step 7: Verify events reach the Data Node
Check that the index exists and is filling:
curl -u <USER>:<PASSWORD> "http://localhost:9200/_cat/indices/stream-zeek-*?v"
Expected output (example):
health status index                   docs.count  store.size
green  open   stream-zeek-2025.11.15        12345       6.1mb
Confirm the document count is climbing:
curl -u <USER>:<PASSWORD> "http://localhost:9200/stream-zeek-*/_count?pretty"
A count of 0 means nothing has been indexed yet: go back and confirm Zeek is running (Step 5) and writing JSON, and that the probe is active (Step 6).
Verify end to end with test traffic
Zeek is passive, so it logs traffic that crosses the monitored link. Generate a little traffic across that link, then confirm it lands as Zeek events.
# DNS lookup and an HTTP request over the monitored path
dig example.com
curl -s http://example.com/ > /dev/null
After a short wait, look for the matching event types on the host:
sleep 30
cat /opt/zeek/spool/zeek/dns.log  | tail -2
cat /opt/zeek/spool/zeek/http.log | tail -2
DNS and HTTP entries confirm that Zeek sees the link. The next section confirms the pipeline carried them into the GUI.
Explore in Discover
Discover is where you read the raw Zeek events. Open Menu → Discover and select the index pattern:
stream-zeek-*
If the pattern does not exist yet, create it once under Management → Index Patterns with stream-zeek-* and @timestamp as the time field.
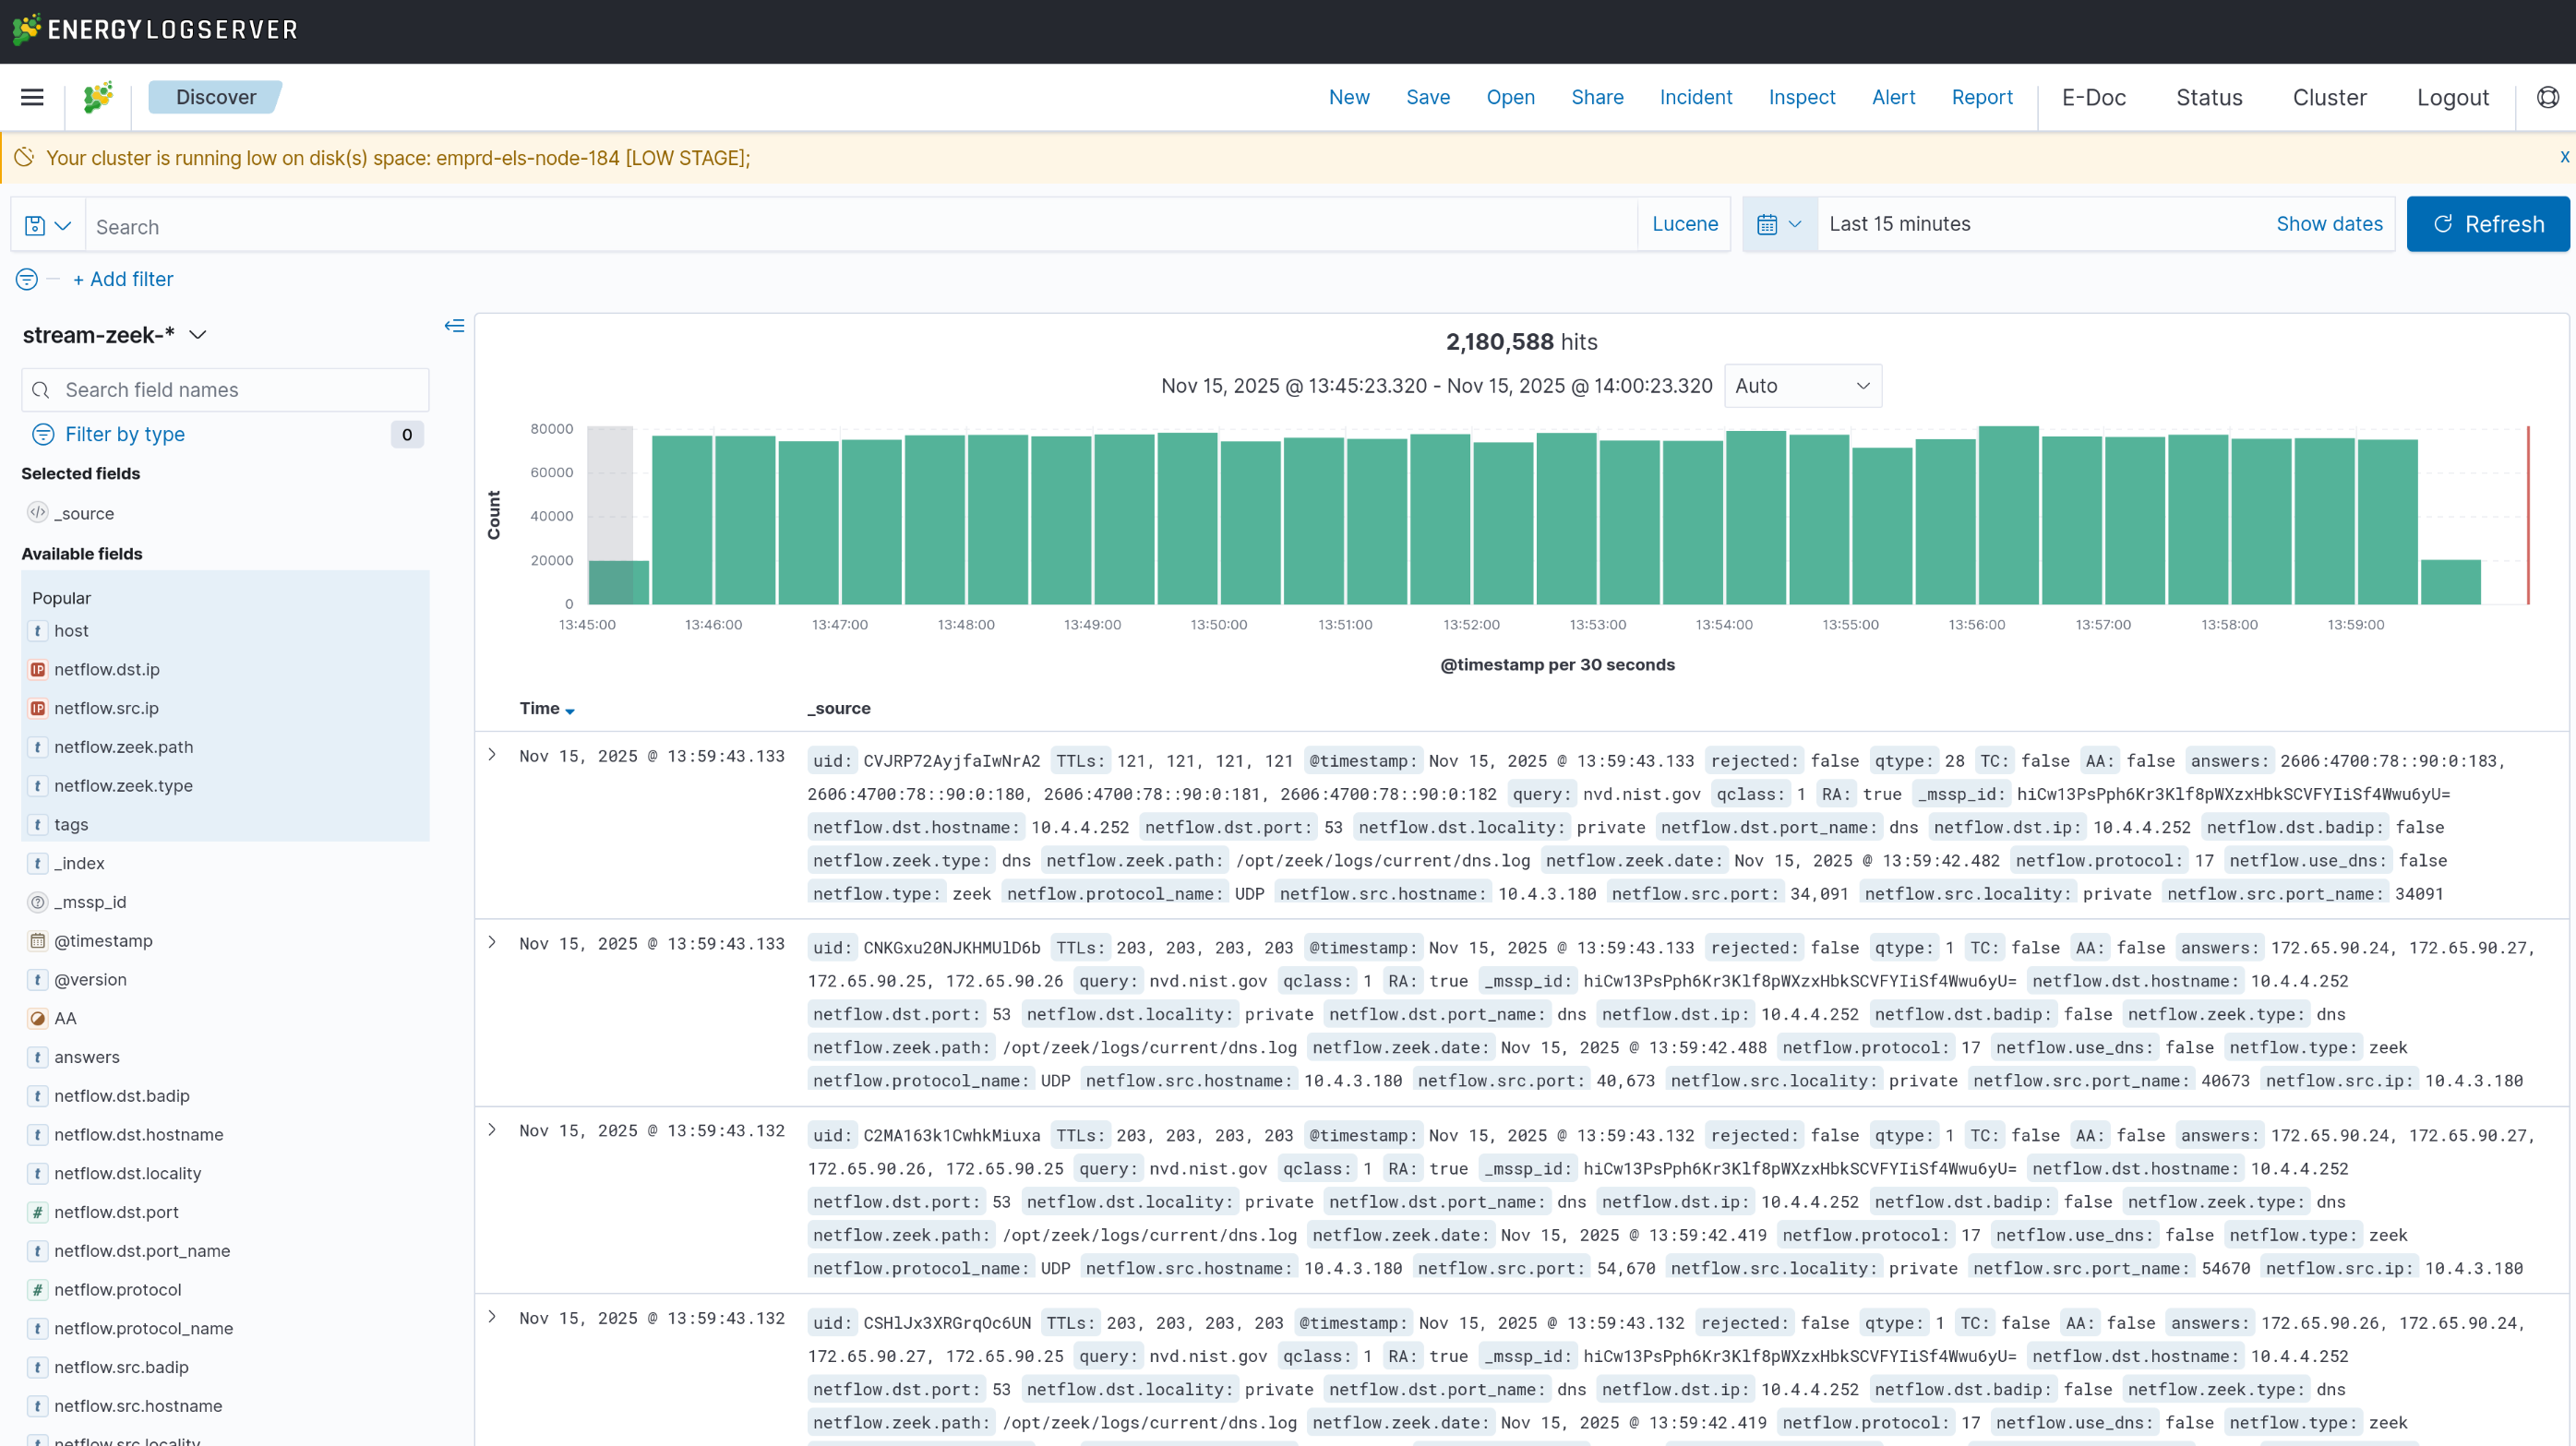
If you see “No results match your search criteria”, work through these causes in order:
Wrong time range. The most common cause. Set the time picker to
Last 1 hourright after starting Zeek, orLast 7 daysfor older events.Zeek not running. Run
zeekctl statuson the host. If it is not running, deploy it (Step 5).No traffic. Confirm logs exist with
tail -2 /opt/zeek/spool/zeek/conn.log.Pipeline not running. Run
systemctl status logserver-probe.
Useful searches
Zeek events carry the log type in netflow.zeek.type and the connection detail under netflow.*. The Discover search bar uses Lucene syntax:
netflow.zeek.type:"conn"                         # connection records
netflow.zeek.type:"dns"                          # DNS queries
netflow.zeek.type:"http"                         # HTTP requests
netflow.zeek.type:"ssl"                          # TLS sessions
netflow.src.ip:"<IP-ADDRESS>"                    # by source
netflow.dst.ip:"<IP-ADDRESS>"                    # by destination
netflow.dst.port:443                             # by destination port
netflow.dst.badip:true                           # destination flagged as a known bad IP
Columns worth adding
The default _source column is hard to scan. Add these fields from the field list on the left to get a readable table:
netflow.zeek.type       # log type (conn, dns, http, ssl, ...)
netflow.src.ip          # source
netflow.dst.ip          # destination
netflow.dst.port        # destination port
netflow.zeek.service    # detected service
netflow.protocol_name   # transport protocol
Build your own dashboards
Zeek One Click does not import dashboards, so you build the views you need. Create visualizations under Menu → Visualize → Create visualization against the stream-zeek-* index pattern, then collect them on a dashboard. A useful starter set:
Visualization |
Type |
Bucket / field |
|---|---|---|
Top source IPs |
Data table |
Terms on |
Protocol distribution |
Pie |
Terms on |
Traffic timeline |
Line |
Date histogram on |
Connection destinations map |
Coordinate map |
Geohash on the destination geo-point field, where geoip enrichment is enabled |
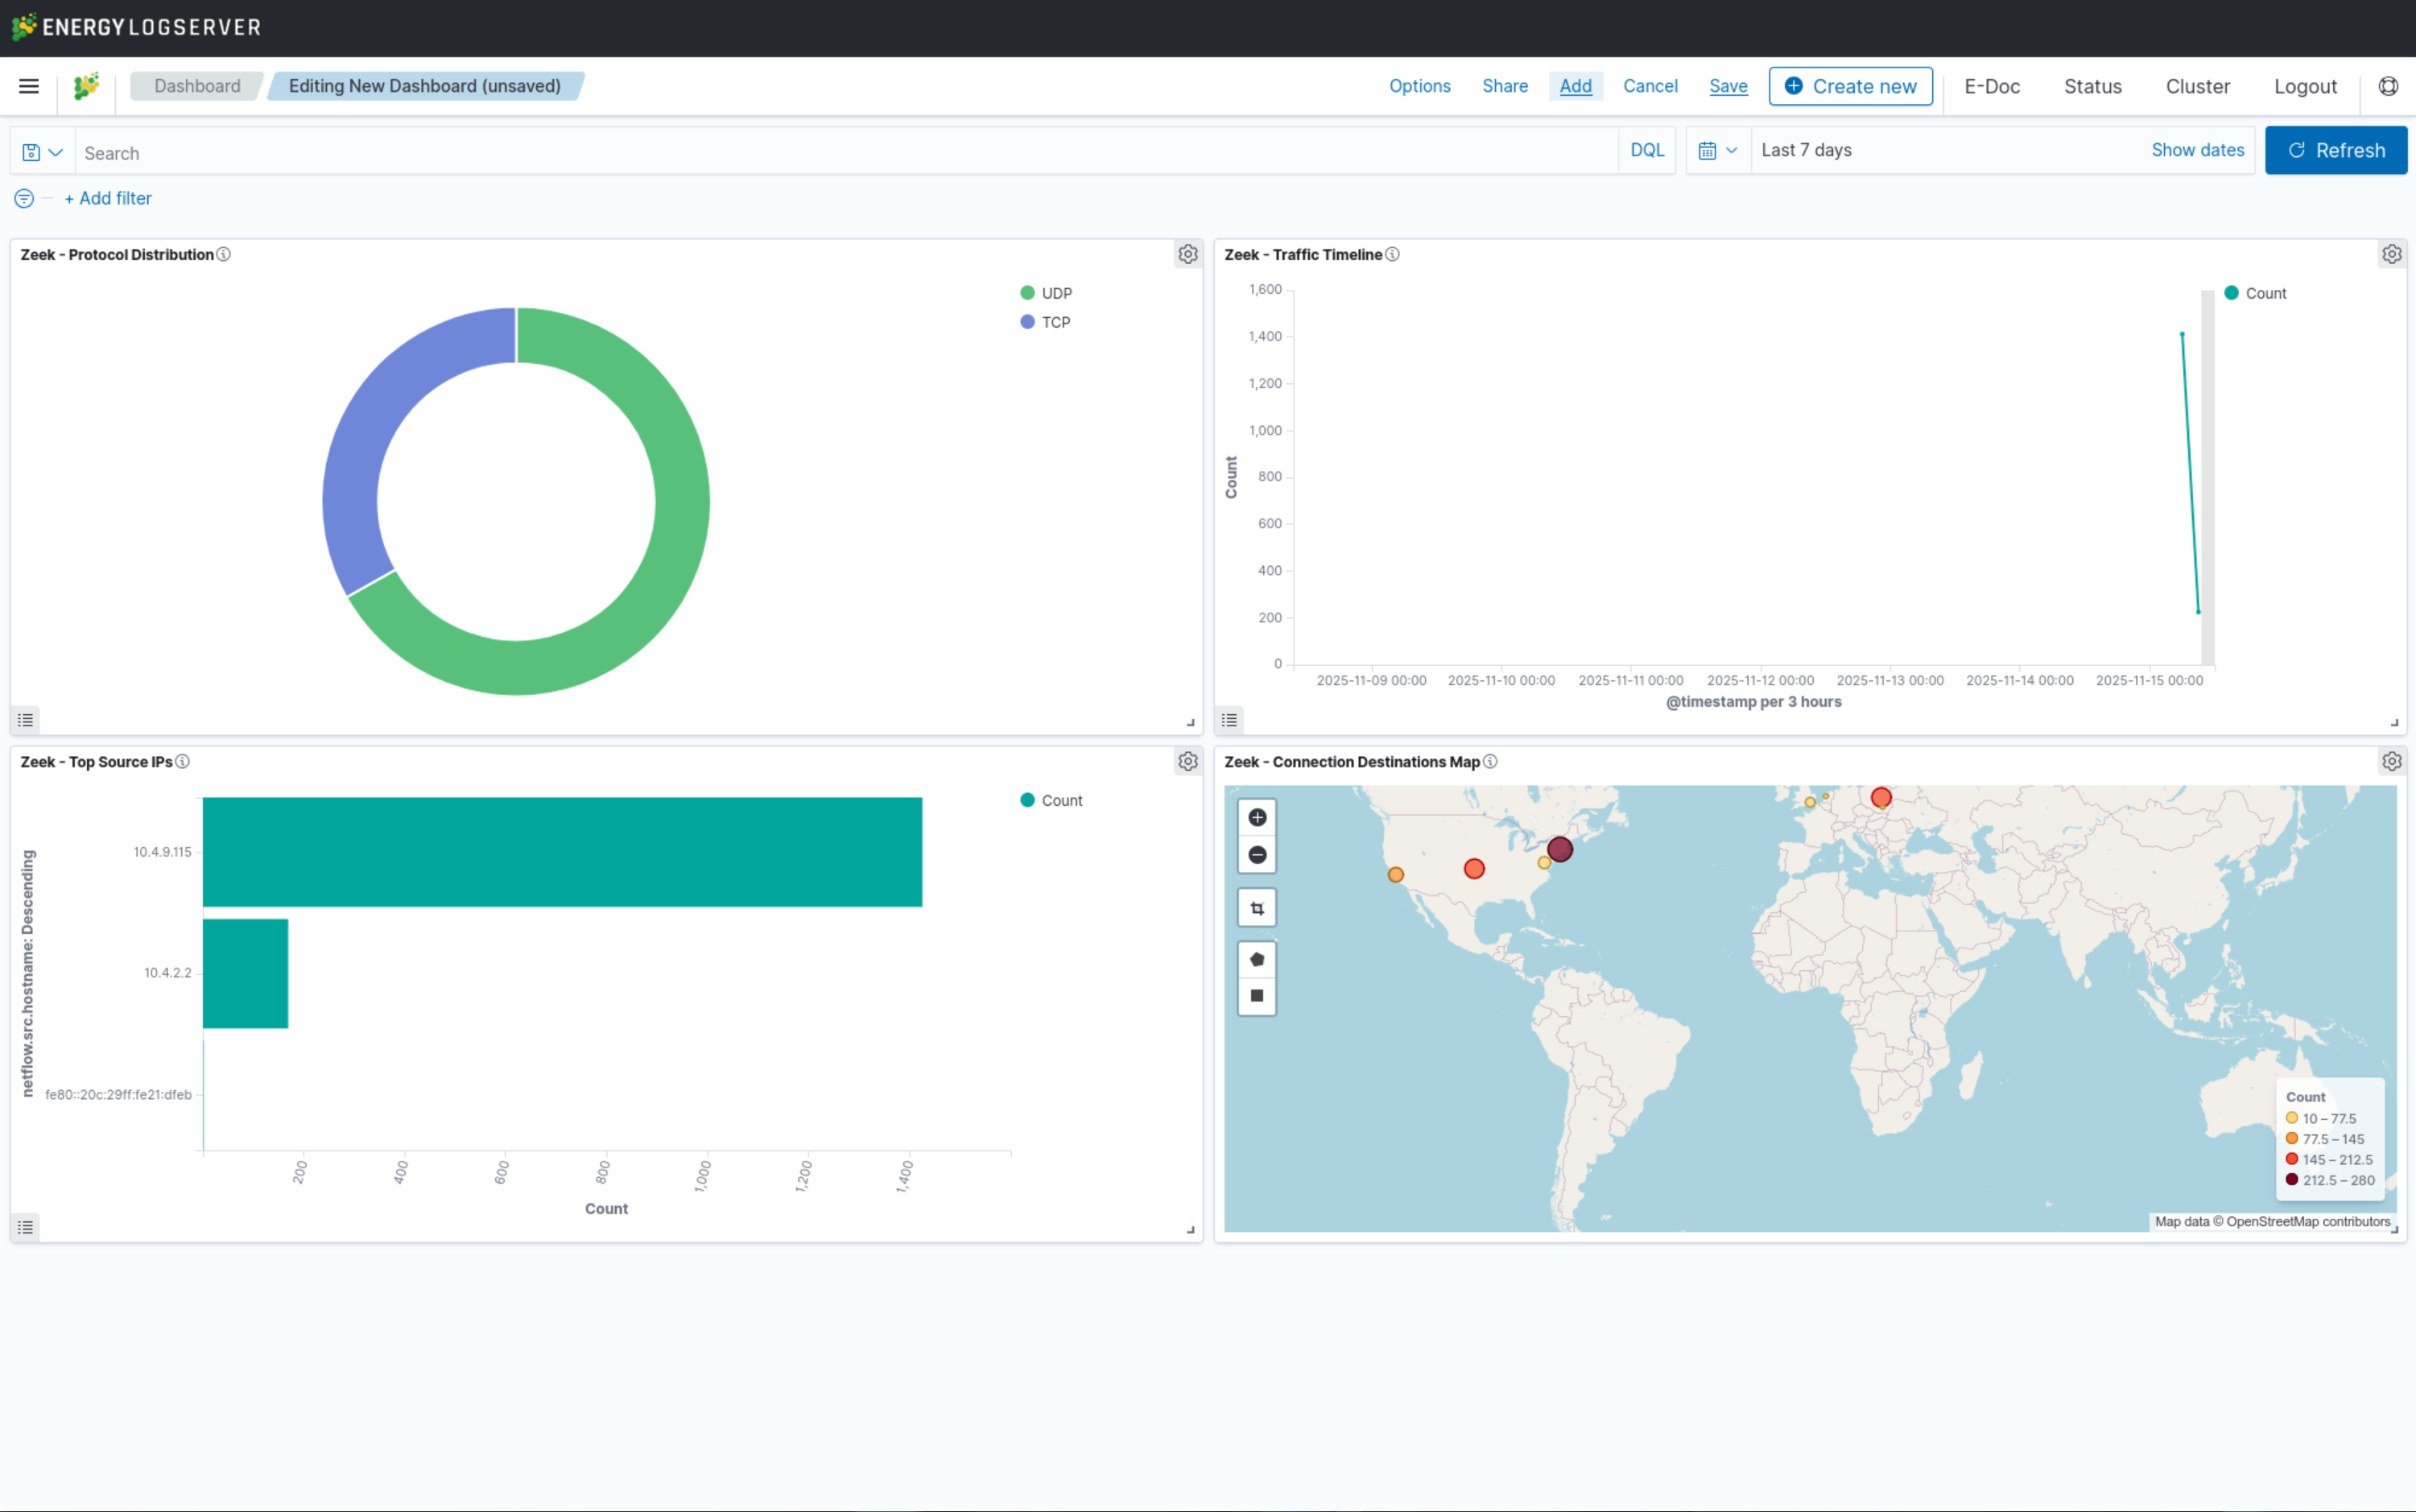
Save the visualizations, add them to a new dashboard under Menu → Dashboard → Create dashboard, and set the time picker to a range that covers your traffic.
Maintenance
Log rotation
Zeek’s logs exist in two places, with separate retention: as files on the sensor, and as indexed events in Energy Logserver. You manage both, because a full sensor disk stops capture and unbounded indices fill the Data Node.
Zeek rotates its own logs. Zeek closes the current logs in
/opt/zeek/spool/zeek/on the interval set byLogRotationIntervalin/opt/zeek/etc/zeekctl.cfg; thezeekctl cronmaintenance pass then compresses them and moves them to dated directories under/opt/zeek/logs/. The probe installs the cron entry*/5 * * * * /opt/zeek/bin/zeekctl cronfor this. If rotation is not running (an empty/opt/zeek/logs/, orLogRotationInterval=0), enable it there rather than adding a second rotation mechanism.Archived logs (
/opt/zeek/logs/) are the rotated, compressed logs kept on the sensor. Purge them on a schedule so the disk does not fill:find /opt/zeek/logs/ -mtime +30 -delete
Indexed events (
stream-zeek-*). One Click does not install an index-management policy for these indices, so nothing prunes them by default and they grow until the Data Node fills. Create an Index Management policy (rollover and deletion) forstream-zeek-*in the GUI to bound their retention. Deleting log files on the sensor does not remove data already in Energy Logserver, and the reverse also holds.
Warning
Do not point logrotate at /opt/zeek/spool/zeek/. Zeek keeps those files open while writing, so rotating them underneath it leaves Zeek writing to a deleted file and breaks the Network Probe’s read position (the sincedb). Let Zeek rotate its own logs, and purge the archive in /opt/zeek/logs/ instead.
Zeek updates
# Back up the configuration first
tar -czf /root/zeek-config-$(date +%Y%m%d).tar.gz /opt/zeek/etc/

systemctl stop zeek
yum update zeek -y
zeekctl deploy
Performance monitoring
zeekctl status      # is the node running
zeekctl netstats    # received vs dropped packets
du -sh /opt/zeek/spool/zeek/   # current log volume
Troubleshooting
“certificate signature failure” during One Click
If One Click fails at the pipeline step with unable to execute operation! certificate signature failure, this is not a Zeek problem and is not related to the manual steps above. It comes from inconsistent license-service certificates and affects every integration installed through One Click. See Network Probe Troubleshooting for diagnosis and resolution.
Zeek will not start
Check the configuration and the diagnostic output:
zeekctl check
zeekctl diag
tail -50 /opt/zeek/spool/zeek/stderr.log
Common causes:
Interface does not exist: the interface in
node.cfgis wrong. Recheck Step 3 withip link show.Script error:
zeekctl checkreports the failing line. Fix it and runzeekctl deployagain.No packets arriving: confirm the mirror or SPAN port is delivering traffic with
tcpdump -i <INTERFACE> -c 10.
Events reach the sensor but not the index
Zeek writes its logs, but the Network Probe pipeline is not reading them. The usual cause is file permissions: the probe reads Zeek’s logs through membership in the zeek group, so the log files must be group-readable by zeek.
ls -l /opt/zeek/spool/zeek/*.log
chown zeek:zeek /opt/zeek/spool/zeek/*.log
chmod 640 /opt/zeek/spool/zeek/*.log
640 with group zeek is enough; the probe user (logserver-probe) does not need world-readable files. The Network Probe package adds logserver-probe to the zeek group at install time, so this membership normally already exists. Confirm it, and add it if missing:
id logserver-probe | grep -o zeek || gpasswd -a logserver-probe zeek
If you just added the membership, restart the pipeline so it takes effect:
systemctl restart logserver-probe
If the log format is the problem instead, confirm it is JSON (head -2 /opt/zeek/spool/zeek/conn.log); if it is still TSV, redo Step 4.
If the pipeline read position is stuck after a bad rotation, clear the sincedb and let it re-read (this reprocesses existing logs):
systemctl stop logserver-probe
rm -f /var/lib/logserver-probe/plugins/inputs/file/.sincedb_*
systemctl start logserver-probe
Packet drops
A sustained drop rate means Zeek is not keeping up with the traffic and is missing events. Check the counters:
zeekctl netstats
If drops are high, apply these in order:
Spread the load across worker processes.
Cause: a single Zeek process is bound to one core, which caps how much traffic it can parse.
Trade-off: each worker holds its own state and buffers, so more workers use more CPU and memory. Raise the count gradually and re-measure.
Set
lb_procsin/opt/zeek/etc/node.cfg:[zeek] type=standalone host=localhost interface=<INTERFACE> lb_procs=2
Increase the capture ring buffer.
Cause: the ring buffer absorbs bursts between the NIC and Zeek. When it fills, the kernel drops packets before Zeek sees them.
Trade-off: a larger ring pins more memory per interface. Double it and re-measure rather than setting it very high at once.
ethtool -G <INTERFACE> rx 4096
High CPU or memory use
Cause: Zeek parses and logs every protocol it recognizes, so on a busy link the volume of parsed events drives both CPU and log size.
Trade-off: disabling logs you do not use lowers load but removes that visibility. Turn off only what you knowingly do not need, in /opt/zeek/share/zeek/site/local.zeek, then zeekctl deploy. Before that, confirm the load is Zeek and not the pipeline:
ps -o pid,%cpu,%mem,cmd -C zeek
Definition of terms
Term |
Meaning |
|---|---|
NSM |
Network Security Monitor. Zeek observes and records network activity in detail rather than blocking it. |
conn.log |
Zeek’s connection log: one record per TCP, UDP, or ICMP flow, with endpoints, duration, bytes, and state. |
zeekctl |
Zeek’s control utility. |
networks.cfg |
|
Masked service |
A systemd state in which a unit is linked to |
sincedb |
The Network Probe’s record of how far it has read each log file, so it does not re-read from the start. |
Index pattern |
A wildcard such as |