Monitoring and Performance
About Skimmer
Energy Logserver uses a monitoring module called Skimmer to monitor the performance of its hosts. Skimmer collects metrics from the following sources:
ELS Data Node API: node stats, cluster health, cluster shards, license status, indices stats
Network Probe API: JVM, GC, process, events, CPU load metrics
OS statistics: CPU, filesystem, swap, network interfaces, VM stats, zombie processes, disk usage, TCP port status
Systemd services: status of any configured systemd service (via DBus)
Kafka (optional), consumer group lag metrics
Process monitoring: PID tracking for configured processes
Skimmer logs to the systemd journal. Set the log level with the SKIMMER_LOG_LEVEL environment variable (DEBUG, INFO, ERROR).
Skimmer Installation
The RPM package is delivered with the system installer in the install/agents directory:
cd $install_directory/install/agents
yum install skimmer-1.0.*-x86_64.rpm -y
The package installs to /opt/skimmer/ with the following layout:
Path |
Description |
|---|---|
|
Binary |
|
Configuration file |
|
Systemd service unit |
Skimmer service configuration
The Skimmer configuration is located in the /opt/skimmer/skimmer.conf file. The file uses a flat key = value format (lines starting with # are comments).
# enable stats collection
main_enabled = true

# index name in Data Node
index_name = skimmer
index_format = %Y.%m

# credentials for Data Node API
elasticsearch_auth = logserver:logserver

# Data Node output address (comma-separated list for fault tolerance)
elasticsearch_address = 127.0.0.1:9200

# Network Probe output address (comma-separated list for fault tolerance)
logstash_address = 127.0.0.1:6110

# Data Node API address for stats retrieval
elasticsearch_api = 127.0.0.1:9200

# Network Probe API address for stats retrieval
logstash_api = 127.0.0.1:9600

# collection interval (minimum 10s)
interval = 1min

# how often to collect shards, license, and indices stats
system_health_check_interval = 4h

# index patterns to monitor (default: all)
# indices_stats_patterns = *
# indices_stats_regex = .*

# Kafka monitoring (optional)
# kafka_path = /usr/share/kafka/
# kafka_server_api = 127.0.0.1:9092
# kafka_monitored_topics = topic1,topic2
# kafka_monitored_groups = group1,group2
# kafka_outdated_version = false

# comma-separated process names to track PIDs
processes = /usr/sbin/sshd,/usr/sbin/rsyslogd

# comma-separated systemd services to monitor status
# extend the list as shown below to cover all 8.x services
systemd_services = logserver,logserver-probe,alert,cerebro,logserver-gui,e-doc,intelligence,intelligence-scheduler,license-service,automation

# comma-separated port numbers to check
port_numbers = 9200,9300,9600,5514,5044,443,5601,5602,5603

# enable SSL for Data Node API connections
# elasticsearch_ssl = true

# specific paths to check disk usage
# check_disk_usage = /var/lib/logserver-probe/queue

# force node IP when Skimmer is not running on a cluster node
# elasticsearch_api_force_node_ip = 10.0.0.1

# redefine field type mappings
# mapping = {"store": "long"}
Note
List services in systemd_services by their unit names. Skimmer stores the state of each one in a node_stats_systemd_service_<name> field. The packaged configuration may still list the previous service aliases, and Skimmer reports them under the same logserver, logserver-probe, and logserver-gui fields. Network Probe stats fields use the logserver-probe_stats_ prefix.
In the Skimmer configuration file, set the credentials to communicate with Data Node:
elasticsearch_auth = $user:$password
Kafka monitoring
To monitor the Kafka process and the number of documents in the queues of topics, run Skimmer on the Kafka server and uncomment the following parameters:
kafka_path = /usr/share/kafka/
kafka_server_api = 127.0.0.1:9092
kafka_monitored_topics = topic1,topic2
kafka_monitored_groups = group1,group2
kafka_outdated_version = false
kafka_path, path to Kafka home directory (requireskafka-consumer-groups.sh)kafka_server_api, IP address and port for Kafka server API (default:127.0.0.1:9092)kafka_monitored_groups, comma-separated list of Kafka consumer groups; if not defined, the command will be invoked with the--all-groupsparameterkafka_outdated_version, set totrueif you use Kafka before v2.4.0
After the changes in the configuration file, restart the service:
systemctl restart skimmer
Skimmer GUI configuration
To view the collected data by Skimmer in the GUI, you need to add an index pattern.
Go to the “Management” -> “Index Patterns” tab and press the “Create Index Pattern” button. In the “Index Name” field, enter the formula skimmer-*, and select the “Next step” button. In the “Time Filter” field, select @timestamp and then press “Create index pattern”.
In the “Discover” tab, select the skimmer-* index from the list of indexes. A list of collected documents with statistics and statuses will be displayed.
The Skimmer dashboard includes the following monitoring parameters (in the GUI, each visualization title is prefixed with Skimmer -):
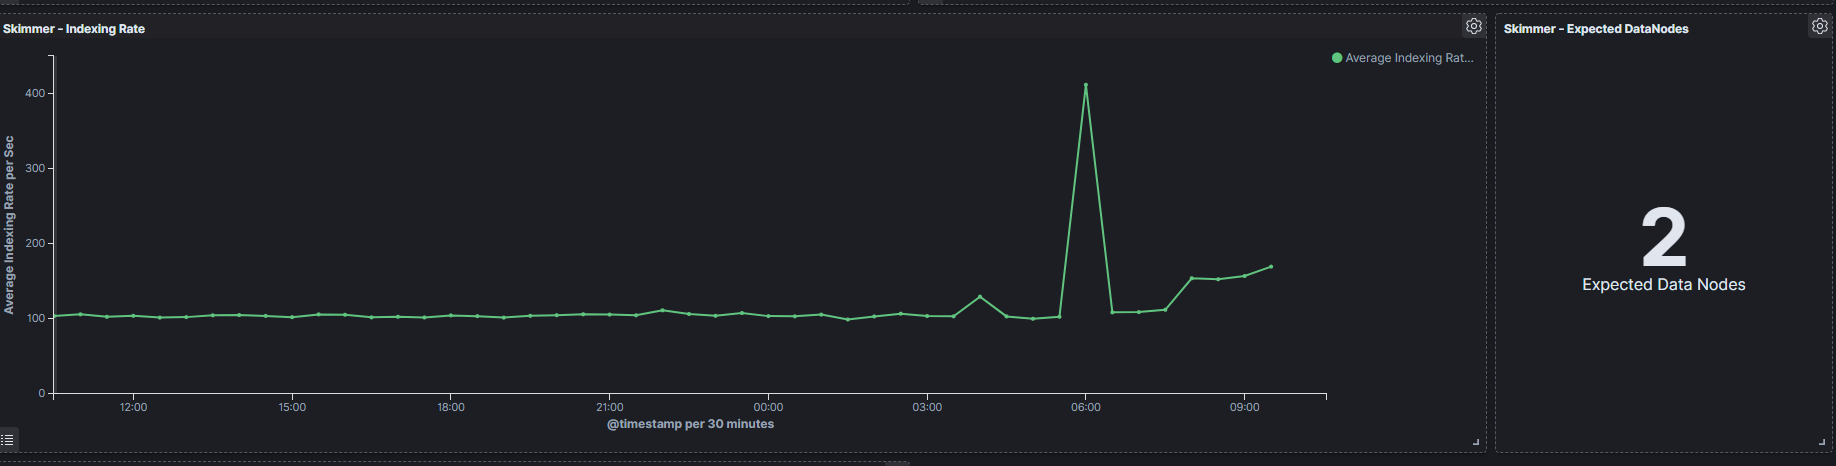
Logserver - Heap usage in percent, total amount of Java heap memory currently used by the JVM Data Node process (in percent)Logserver Probe - Heap usage in percent, total amount of Java heap memory currently used by the JVM Network Probe process (in percent)Logserver - Process CPU usage, CPU time used by the Data Node process (in percent)Logserver - Node CPU usage, CPU usage of the host running the Data Node (in percent)Logserver - Current queries, current count of search queries to Data Node indicesLogserver - Current search fetch, current count of the fetch phase for search queries to Data Node indicesGC Old collection, duration of Java Garbage Collector Old collection (in milliseconds)GC Young collection, duration of Java Garbage Collector Young collection (in milliseconds)Flush, duration of the Data Node flushing process that permanently saves the transaction log to the Lucene index (in milliseconds)Refresh, duration of the Data Node refresh process that prepares new data for searching (in milliseconds)Indexing, duration of the Data Node document indexing process (in milliseconds)Merge, duration of the Data Node merge process that periodically merges smaller segments into larger segments (in milliseconds)Indexing Rate, growth of the cluster document count per second, measured on primary shards between two collection runs (the closest metric to EPS)Expected DataNodes, number of data nodes Skimmer considers necessary for the current load, never fewer than the nodes already runningFree Space, total space and free space in bytes on the Data Node clusterIndex / Size in Bytes, size of individual indices in bytesIndex / Documents, document count per index
Note
Indexing Rate is a cluster-wide figure sampled at the interval set in the Skimmer configuration, one minute by default, and counted on primary shards, so replicas do not inflate it. When documents are removed between two samples the difference is negative, and Skimmer repeats the previous value instead of reporting a drop, which shows as a flat line while retention purges or index deletions run.
Expected Data Nodes
Based on the collected performance data of the Energy Logserver environment, Skimmer automatically indicates the need to run additional data nodes. The value stays at the number of running data nodes while the Data Node process CPU across the cluster is below 50 percent. Above that threshold Skimmer derives it from the total shard count, and it never drops below the number of nodes already running.