Troubleshooting
Diagnostic tools, common issues, and resolution procedures.
Too many open files
If you have a problem with too many open files by the Energy Logserver process, check the values in the following configuration files:
/usr/lib/systemd/system/logserver.service,LimitNOFILE=262144/etc/security/limits.d/30-logserver.conf,logserver - nofile 262144/etc/sysconfig/logserver,MAX_OPEN_FILES=262144
If you need to increase these values, edit the files and then reload systemd:
systemctl daemon-reload
systemctl restart logserver
The Logserver-GUI status code 500
If the login page is displayed in Logserver-GUI, but after the attempt to login, the browser displays “error: 500”, and the logs will show entries:
Error: Failed to encode cookie (sid-auth) value: Password string too short (min 32 characters required).
Generate a new login.ironsecret with the following command:
echo "login.ironsecret: \"$(</dev/urandom tr -dc _A-Z-a-z-0-9 | head -c32)\"" >> /etc/logserver-gui/logserver-gui.yml
Support tool
Energy Logserver includes a support tool (formerly diagnostic tool) that collects system data necessary for problem analysis by the support team.
The tool is located at: /usr/share/logserver/utils/support-tool.sh (a diagnostic-tool.sh symlink is also available for backward compatibility).
The support tool collects the following information:
Configuration files: Data Node (
/etc/logserver/), GUI (/etc/logserver-gui/), Network Probe (/etc/logserver-probe/conf.d/), Alert (/opt/alert/config.yaml), Cerebro (/opt/cerebro/), Skimmer (/opt/skimmer/skimmer.conf), E-Doc (/opt/e-doc/config.yml), SIEM/Endpoint Security (/var/ossec/etc/)Service logs (via journalctl):
logserver,logserver-gui,logserver-probe,alert,cerebro,skimmer,e-docCluster information: cluster health, cluster settings, indices summary, shard details
Running the support tool
The tool reads credentials automatically from /etc/logserver-gui/logserver-gui.yml. No command-line arguments are needed:
/usr/share/logserver/utils/support-tool.sh
Warning
If you have changed the default password or protocol, edit the script and update the credentials manually (see the read_config section), or disable read_config and set esUsername, esPass, and protocol variables directly.
The tool saves the results as an AES-256-CBC encrypted archive at /root/diagnostics-logs-<hostname>-<date>.tar.gz.enc.
To decrypt the archive:
openssl enc -aes-256-cbc -md sha512 -base64 -d -in diagnostics-logs-*.tar.gz.enc -out diagnostics-logs.tar.gz
Verification steps and logs
Verification of Energy Logserver service
To verify the Energy Logserver service you can use the following commands:
Control of the Energy Logserver system service via systemd:
systemctl status logserver
output:
* logserver.service - Logserver
   Loaded: loaded (/usr/lib/systemd/system/logserver.service; enabled; vendor preset: disabled)
   Active: active (running) since Tue 2023-11-14 15:17:16 CET; 5 days ago
 Main PID: 58816 (java)
   CGroup: /system.slice/logserver.service
           └─58816 /etc/alternatives/jre/bin/java -Xshare:auto -Dopensearch.networkaddress.cache.ttl=60 -Dopensearch.networkaddress.cache.n.
Control of Logserver instance via tcp port:
curl -XGET '127.0.0.1:9200/'
output:
{
  "name" : "node-1",
  "cluster_name" : "logserver",
  "cluster_uuid" : "B5SDCaaKQU2JdJpsKy6quQ",
  "version" : {
    "distribution" : "opensearch",
    "number" : "3.3.2",
    "build_type" : "tar",
    "build_snapshot" : false
  },
  "tagline" : "The OpenSearch Project: https://opensearch.org/"
}
The version.number field reports the search engine build, 3.3.2 on Energy Logserver 8.1, not the
product version. The response also carries build_hash, build_date, and the Lucene and
compatibility versions, omitted above.
Control of Logserver instance via log file:
tail -f /var/log/logserver/logserver.log
other control commands via curl application:
  curl -XGET "http://localhost:9200/_cat/health?v"
  curl -XGET "http://localhost:9200/_cat/nodes?v"
  curl -XGET "http://localhost:9200/_cat/indices"
Verification of Logserver-Probe service
To verify the Logserver-Probe service you can use the following command:
control Logserver-Probe service via systemd:
systemctl status logserver-probe
output:
    logserver-probe.service - logserver-probe
       Loaded: loaded (/usr/lib/systemd/system/logserver-probe.service; enabled; vendor preset: disabled)
       Active: active (running) since Mon 2025-01-06 09:15:32 CET; 2 months ago
     Main PID: 87818 (java)
       CGroup: /system.slice/logserver-probe.service
              └─87818 /usr/bin/java -Xms1g -Xmx1g
control Logserver-Probe service via port tcp:
curl -XGET '127.0.0.1:9600'
output:
  {
     "host": "logserver-node",
     "version": "7.17.29",
     "http_address": "127.0.0.1:9600"
  }
The
versionfield reports the pipeline engine bundled with the probe, not the Energy Logserver release.control Logserver-Probe service via log file:
tail -f /var/log/logserver-probe/logserver-probe-plain.log
Debugging
dynamically update logging levels through the logging API (service restart not needed):
   curl -XPUT 'localhost:9600/_node/logging?pretty' -H 'Content-Type: application/json' -d'
   {
       "logger.logserver-probe.outputs.logserver" : "DEBUG"
   }
   '
permanent change of logging level (service need to be restarted):
edit file
/etc/logserver-probe/logserver-probe.ymland set the following parameter:log.level: debug
restart logserver-probe service:
systemctl restart logserver-probe
checking the configuration of one pipeline. Run the test as the
logserver-probeuser with a temporary data directory, so it does not collide with the running service:mkdir -p /tmp/probe-test && chown logserver-probe /tmp/probe-test sudo -u logserver-probe /usr/share/logserver-probe/bin/logstash --path.settings /etc/logserver-probe \ --path.data /tmp/probe-test -t -f /etc/logserver-probe/conf.d/<pipeline> rm -rf /tmp/probe-test
Exit code 0 and
Config Validation Result: OKin the log mean the configuration is valid. The test writes the details of an error to/var/log/logserver-probe/logserver-probe-plain.log, not to the console. Point-fat the directory of one pipeline: with-f /etc/logserver-probe/conf.dthe test finds no files, because the configurations are in subdirectories, and still reportsOK.get information about load of the Logserver-Probe:
curl -XGET '127.0.0.1:9600/_node/jvm?pretty=true'
output:
 {
  "host" : "logserver-node",
  "version" : "7.17.29",
  "http_address" : "127.0.0.1:9600",
  "id" : "5a440edc-1298-4205-a524-68d0d212cd55",
  "name" : "logserver-node",
  "jvm" : {
    "pid" : 14705,
    "version" : "21",
    "vm_version" : "21",
    "vm_vendor" : "Eclipse Adoptium",
    "vm_name" : "OpenJDK 64-Bit Server VM",
    "start_time_in_millis" : 1736150132000,
    "mem" : {
      "heap_init_in_bytes" : 268435456,
      "heap_max_in_bytes" : 1056309248,
      "non_heap_init_in_bytes" : 2555904,
      "non_heap_max_in_bytes" : 0
    },
    "gc_collectors" : [ "G1 Young Generation", "G1 Old Generation" ]
  }
 }
All pipelines stop and the probe restarts in a loop
If one pipeline fails to start, for example because a translate filter points to a missing dictionary file, the Logserver-Probe process exits and stops all other pipelines. systemd starts it again, and the cycle repeats. systemctl status logserver-probe can still show active (running), while:
journalctl -u logserver-proberepeatsMain process exited, code=exited, status=1/FAILUREandScheduled restart job, restart counter is at <N>,the API on port 9600 does not respond.
Find the failing pipeline in the log:
grep -E "FATAL|Failed to execute action" /var/log/logserver-probe/logserver-probe-plain.log | tail
The line Failed to execute action {:action=>LogStash::PipelineAction::Create/pipeline_id:<pipeline> names the pipeline, and the lines above it describe the error. Fix the configuration of that pipeline, test it as described in Debugging, and restart the service.
Verification of Energy Logserver GUI service
To verify the Energy Logserver GUI service you can use the following commands:
Control the Energy Logserver GUI service via systemd:
systemctl status logserver-gui
output:
    * logserver-gui.service - Logserver-GUI
       Loaded: loaded (/usr/lib/systemd/system/logserver-gui.service; enabled; vendor preset: disabled)
       Active: active (running) since Mon 2025-01-06 09:16:45 CET; 2 months ago
     Main PID: 1330 (node)
       CGroup: /system.slice/logserver-gui.service
               └─1330 /usr/share/logserver-gui/bin/../node/bin/node --no-warnings /usr/share/logserver-gui/bin/../src/cli -c /etc/logserver-gui/logserver-gui.yml
Control the Energy Logserver GUI via port tcp/http:
curl -XGET '127.0.0.1:5601/'
output:
      <script>var hashRoute = '/app/logserver-gui';
      var defaultRoute = '/app/logserver-gui';
      var hash = window.location.hash;
      if (hash.length) {
        window.location = hashRoute + hash;
      } else {
        window.location = defaultRoute;
      }</script>
Control the Energy Logserver GUI via log file:
journalctl -fu logserver-gui
SIEM Agent - Windows CP1250 decoding problem
If the SIEM Agent works on an operating system which uses a non-Latin-script alphabet, the encoding could cause dropping documents by logserver-probe. In the logserver-probe log you can notice lines like the one below.
[2023-06-01T15:36:02,091][WARN ][logserver-probe.codecs.json ] Received an event that has a different character encoding than you configured. {:text=>"{\\\"timestamp\\\":\\\"2023-06-01T15:36:01.214+0000\\\",\\\"agent\\\":{\\\"id\\\":\\\"002\\\",\\\"name\\\":\\\"win10_laptop\\\"},\\\"manager\\\":{\\\"name\\\":\\\"SiemPlan.local\\\"},\\\"id\\\":\\\"1549035361.0\\\",\\\"full_log\\\":\\\"{\\\\\\\"type\\\\\\\":\\\\\\\"program\\\\\\\",\\\\\\\"ID\\\\\\\":78741874,\\\\\\\"timestamp\\\\\\\":\\\\\\\"2023/06/01 15:36:00\\\\\\\",\\\\\\\"program\\\\\\\":{\\\\\\\"format\\\\\\\":\\\\\\\"win\\\\\\\",\\\\\\\"name\\\\\\\":\\\\\\\"Skype\\x99 7.34\\\\\\\",\\\\\\\"architecture\\\\\\\":\\\\\\\"i686\\\\\\\",\\\\\\\"version\\\\\\\":\\\\\\\"7.34.102\\\\\\\",\\\\\\\"vendor\\\\\\\":\\\\\\\"Skype Technologies S.A.\\\\\\\",\\\\\\\"install_time\\\\\\\":\\\\\\\"20180212\\\\\\\",\\\\\\\"location\\\\\\\":\\\\\\\"C:\\\\\\\\\\\\\\\\Program Files (x86)\\\\\\\\\\\\\\\\Skype\\\\\\\\\\\\\\\\\\\\\\\"}}\\\",\\\"decoder\\\":{\\\"name\\\":\\\"syscollector\\\"},\\\"location\\\":\\\"syscollector\\\"}", :expected_charset=>"UTF-8"}
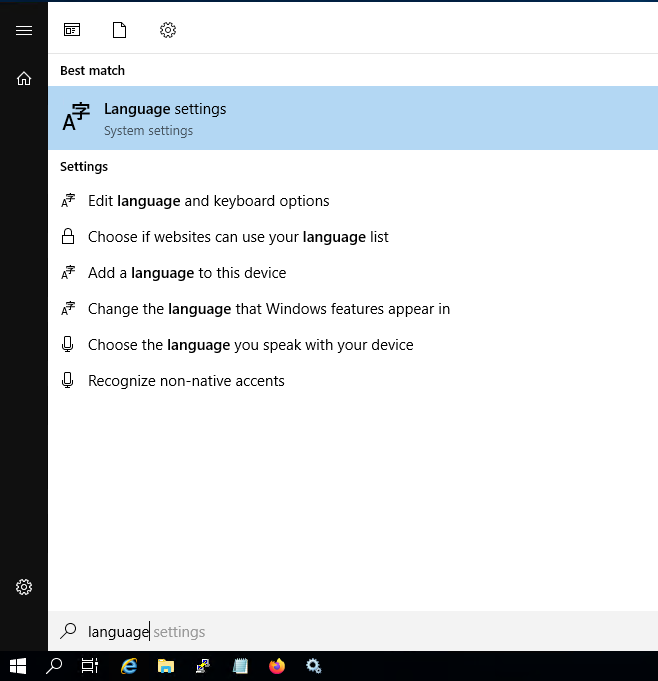
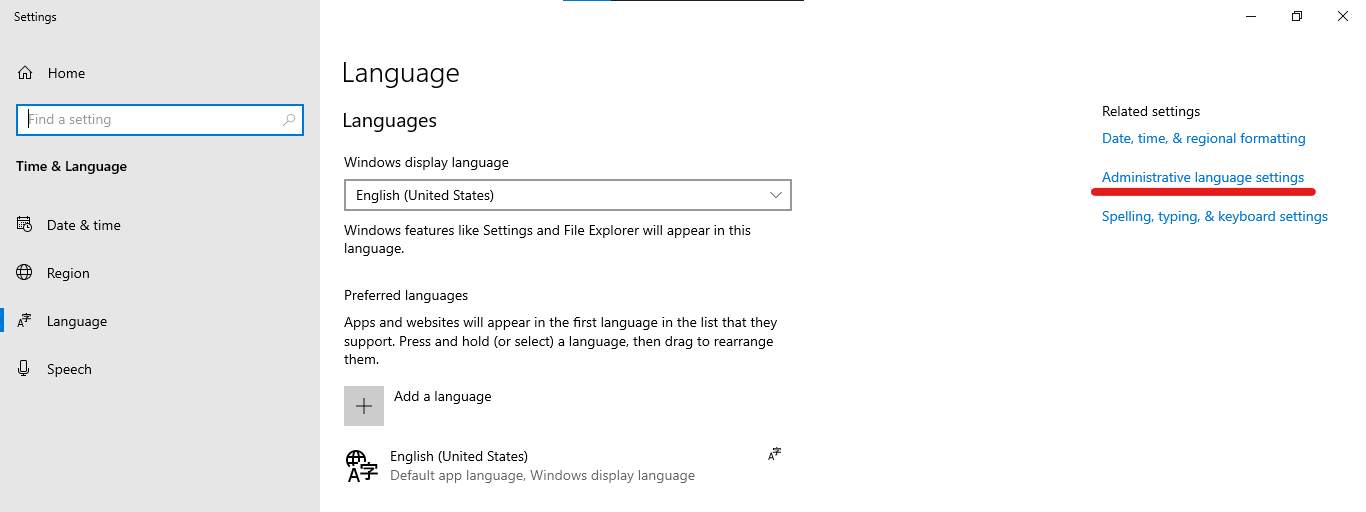
This is caused by default Windows encoding CP1250. You can change default encoding to UTF-8 by following this steps:
Go to Language settings
Open Administrative language settings
Click on
Change system locale...button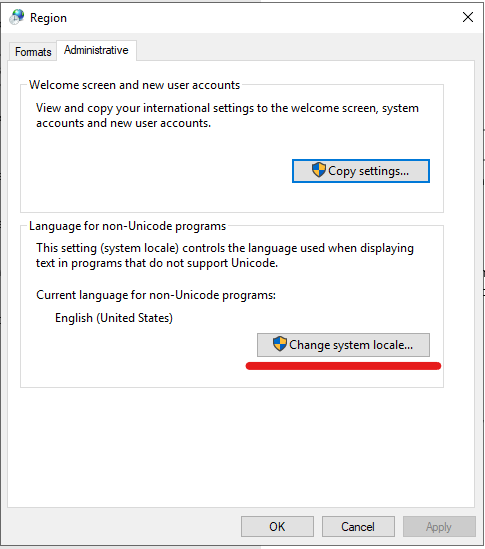
Tick the checkbox
Use Unicode UTF-8..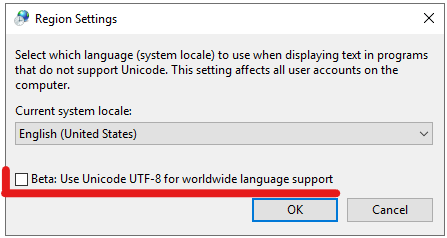
To make this change active you have to reboot system.
Wazuh manager
The start exceeds the systemd timeout
The wazuh-manager unit allows 45 seconds for the start (TimeoutSec=45). When the start takes longer, systemctl restart wazuh-manager ends with Job for wazuh-manager.service failed because a timeout was exceeded, and systemctl show wazuh-manager -p Result returns Result=timeout. Check journalctl -u wazuh-manager for the cause first. If the start is only slow, raise the limit with a drop-in file instead of editing the unit file:
mkdir -p /etc/systemd/system/wazuh-manager.service.d
printf "[Service]\nTimeoutStartSec=600\n" > /etc/systemd/system/wazuh-manager.service.d/timeout.conf
systemctl daemon-reload
Events are not analyzed after log directories were deleted
If a subdirectory of /var/ossec/logs, for example alerts, is deleted to free disk space, the analysis daemon wazuh-analysisd does not start, while systemctl status wazuh-manager still shows the service as active. Check the daemons with:
/var/ossec/bin/wazuh-control status
The output contains wazuh-analysisd not running..., and /var/ossec/logs/ossec.log shows a line like wazuh-analysisd: CRITICAL: (1107): Could not create directory 'logs/alerts/2026/' due to [(2)-(No such file or directory)]. Recreate the directory and restart the service:
mkdir /var/ossec/logs/alerts
chown wazuh:wazuh /var/ossec/logs/alerts
chmod 750 /var/ossec/logs/alerts
systemctl restart wazuh-manager
wazuh-analysisd creates the date subdirectories by itself.
My disk is full
The cluster has reached the flood stage watermark and switched to read-only mode. Non-administrative users cannot log in until the issue is resolved. For background on watermark levels see Disk-based shard allocation.
Step 1: free disk space
Check for heap dumps first. After an out-of-memory error the ELS Data Node writes a .hprof file that can be as large as its heap to /var/lib/logserver, as set by -XX:HeapDumpPath in /etc/logserver/jvm.options. The Network Probe also writes heap dumps on out-of-memory errors. List them with:
find / /var/lib/logserver -xdev -name '*.hprof' -exec ls -lh {} +
Delete the dumps you do not need for analysis.
Remove old indices via Index Management in the GUI, or via the API:
curl -u $USER:$PASSWORD -XDELETE \
  '127.0.0.1:9200/<index-name>?pretty'
To trigger immediate log rotation (/etc/logrotate.d/logtrail, 14-day retention):
logrotate -f /etc/logrotate.d/logtrail
Step 2: unblock indices
When disk usage drops below the high watermark the block releases automatically. To release it immediately without waiting:
curl -u $USER:$PASSWORD -XPUT '127.0.0.1:9200/_all/_settings' \
  -H 'Content-Type: application/json' \
  -d '{"index.blocks.read_only_allow_delete": null}'
Step 3: verify
curl -u $USER:$PASSWORD '127.0.0.1:9200/_cluster/health?pretty'
curl -u $USER:$PASSWORD '127.0.0.1:9200/_cat/nodes?v'
Status should return green or yellow.