Overview
Empowered AI is an advanced module of Energy Logserver platform, designed to enhance event detection, correlation, and data analysis across IT and OT environments. It combines mathematical data-analysis methods together with language-model-based detection, creating a powerful and comprehensive analytical engine.
The module uses statistical techniques to identify anomalies, recognize behavioral patterns, and detect deviations that may indicate security incidents or system failures.
A key component of Empowered AI is the use of Large Language Models (LLMs), including our dedicated on-site extension “AI on Prem”. This technology enables local execution of language models within the customer’s environment, ensuring no data leaves the organization. As a result, Empowered AI delivers advanced semantic detection, event classification, and automated analytical support while maintaining full data privacy and security compliance.
By combining mathematical precision with contextual understanding from language models, Empowered AI provides a modern, multi-layered approach to detection and analytics in complex log environments.
Important to note that Use Cases can work in batch or in realtime - connected to Network Probe pipeline.
Empowered AI is an ongoing project, continuously improved by a team of mathematicians, data scientists, and security analysts.
Use Cases
In the Empowered AI section you will find a summary of the existing use cases, connecting rules and data to work with. At the top, you’ll find the total number of configured cases and the number of scheduled and unscheduled cases. Here is the search field and buttons Refresh, Create and Upload.
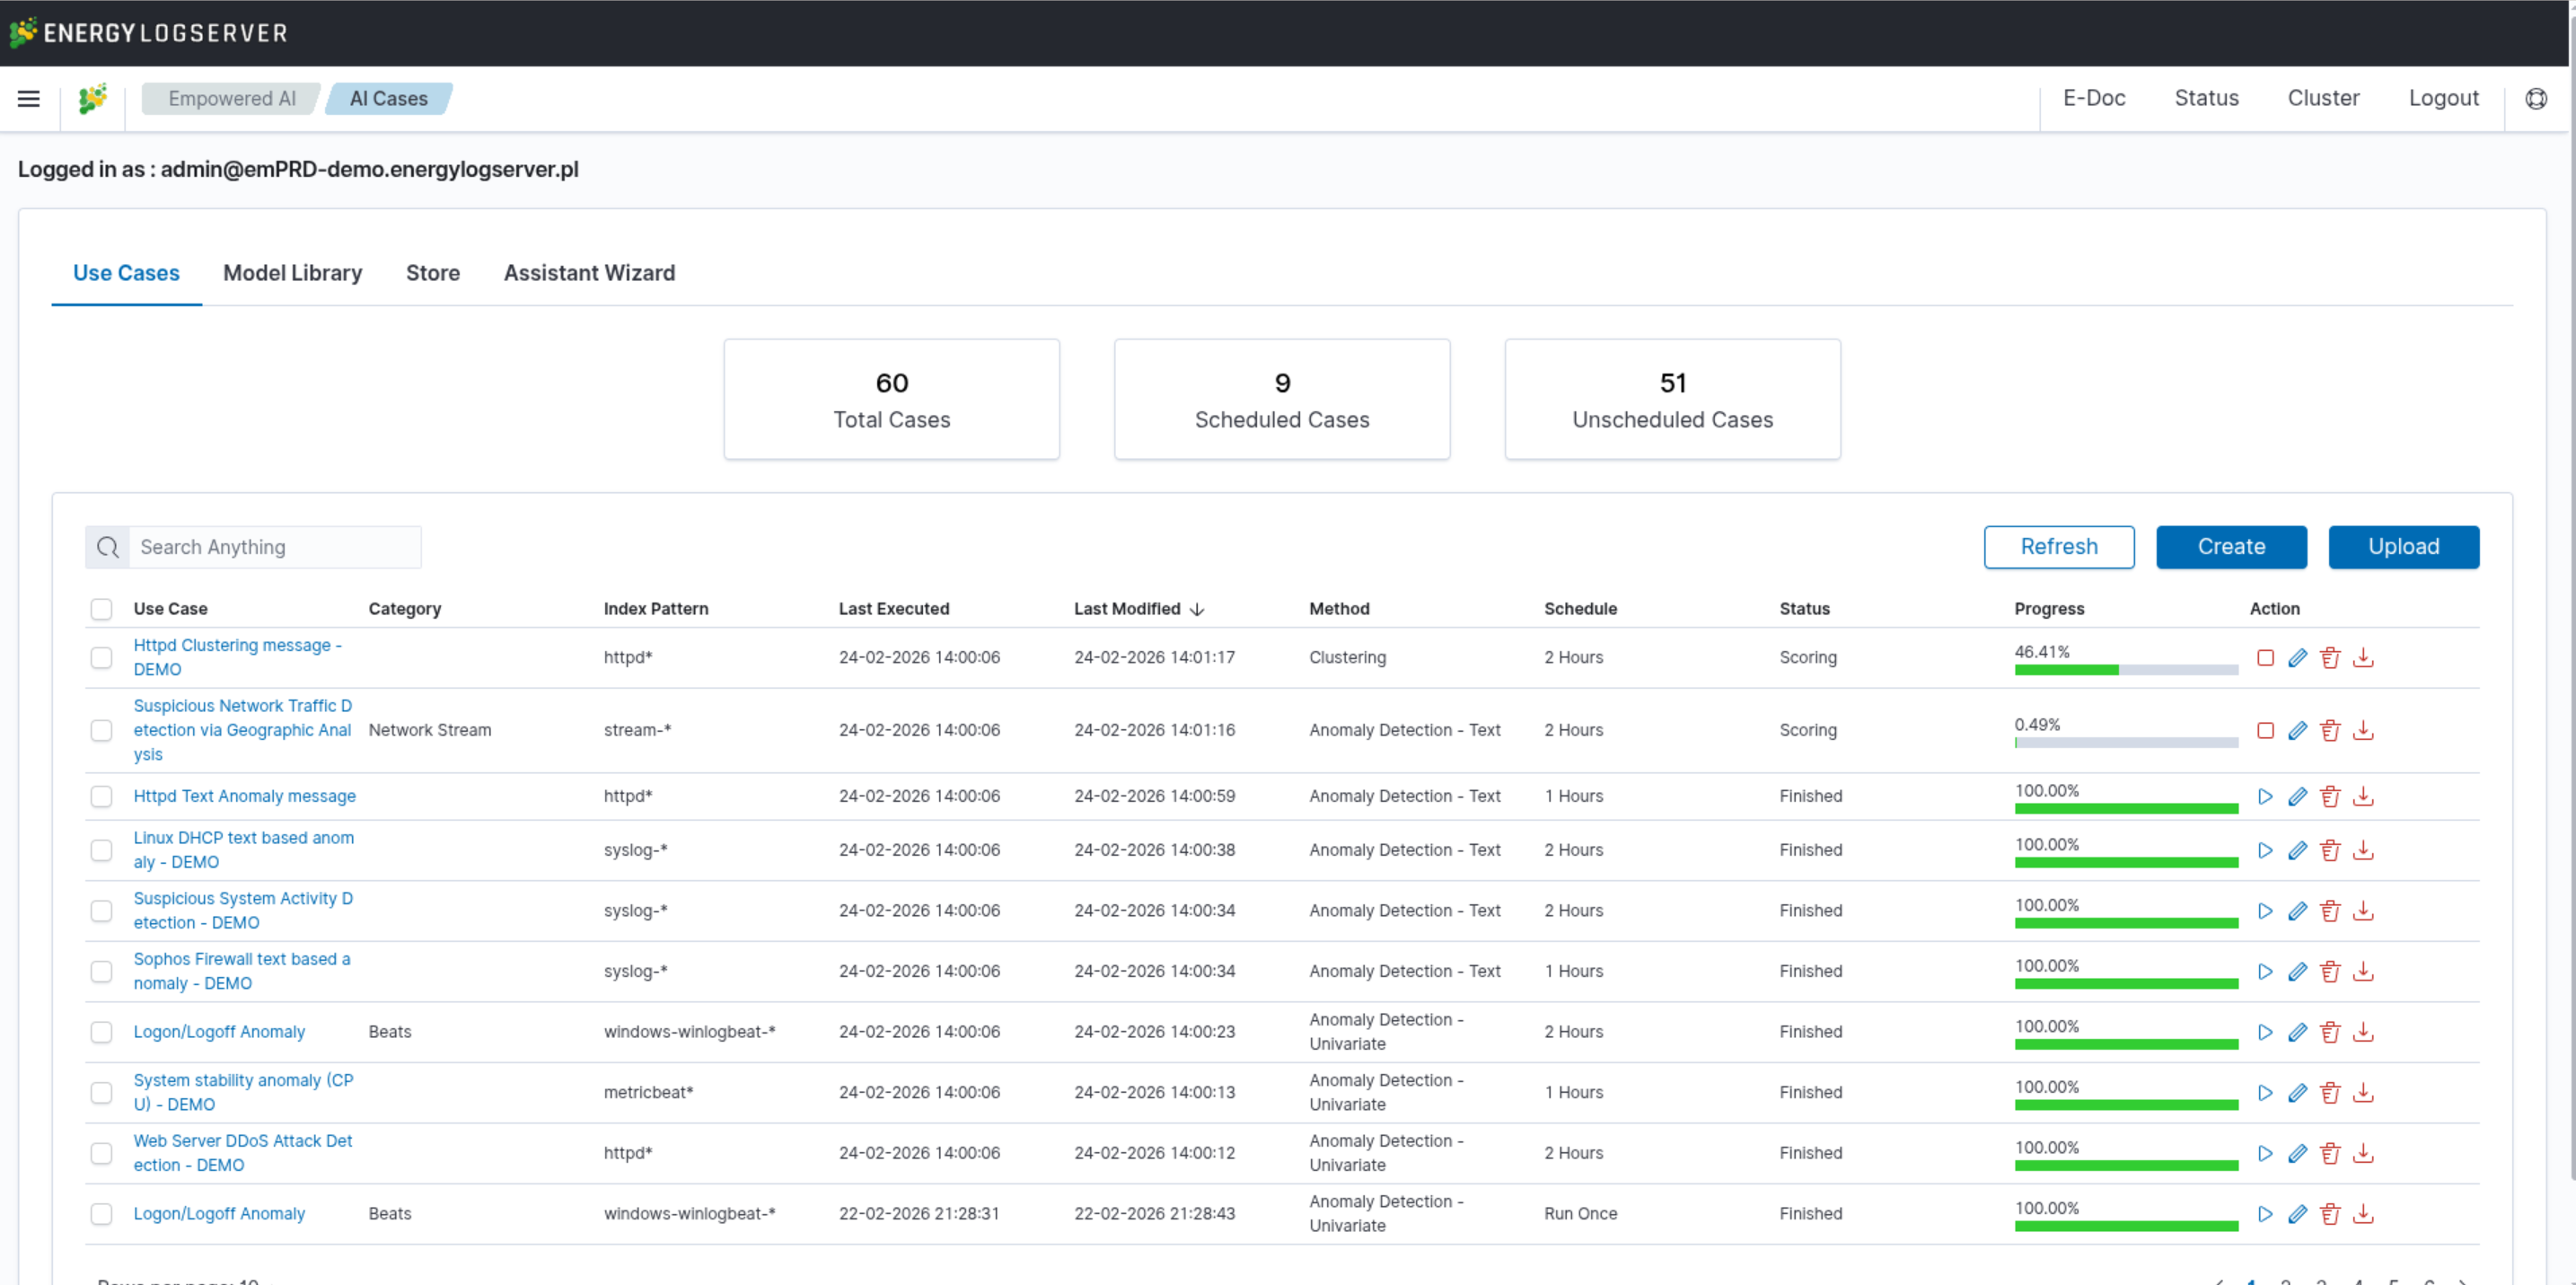
Table contains the following columns:
Use Case- unique name for the rule running on selected dataCategory- given category name upon createIndex Pattern- data to work withLast Executed- date when last use case was ExecutedLast Modified- when last use case configuration was changedMethod- selected algorithmSchedule- configuration of scheduling optionsStatus- current calculation statusProgress- progress bar in %Action- additional use case management
Status
The rule has one of the following statuses:
Waiting to Start -
Run Oncerule starts by clicking symbol playScheduled - the scheduled rule starts automatically
Scoring
Building
Finished
Error, Build Error, Score Error - click the use case name to see the error details in the Performance view
Actions
Icons of actions:
Play - run or rerun the rule
Stop - shown while the use case is running or scheduled; stops the running process or unschedules a periodic rule, after this action the rule type changes to Run Once
Pencil - edit the rule’s configuration
Bin - delete the rule
Download - get the full usecase, rule definition and its config
Create Use Case
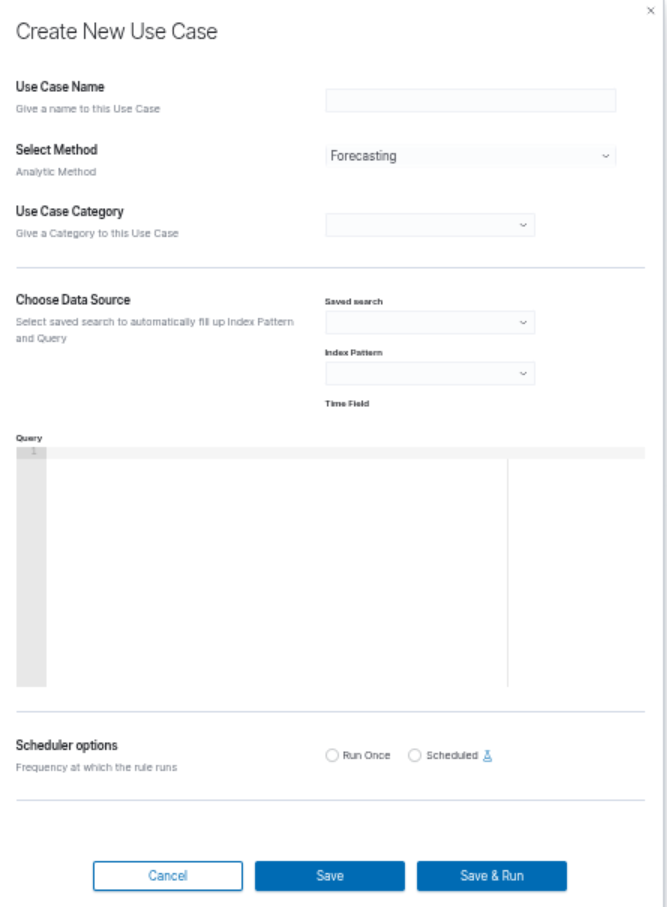
To create a new use case, click the Create button in the Use Cases tab. The Create New Use Case dialog will open.
Configuring the Use Case
Enter a name in the Use Case Name field.
Select the analytical method from the Select Method dropdown: Anomaly Detection - Number, Anomaly Detection - Text, or Clustering.
Select or enter a category in the Use Case Category field.
For Anomaly Detection - Number, use the Single value / Multi values switch to choose between univariate and multivariate analysis.
Data Source
In the Choose Data Source section, select the index pattern in the Index Pattern field. The Time Field is taken from the index pattern. You can narrow down the data with a JSON query (Query DSL) in the Query field.
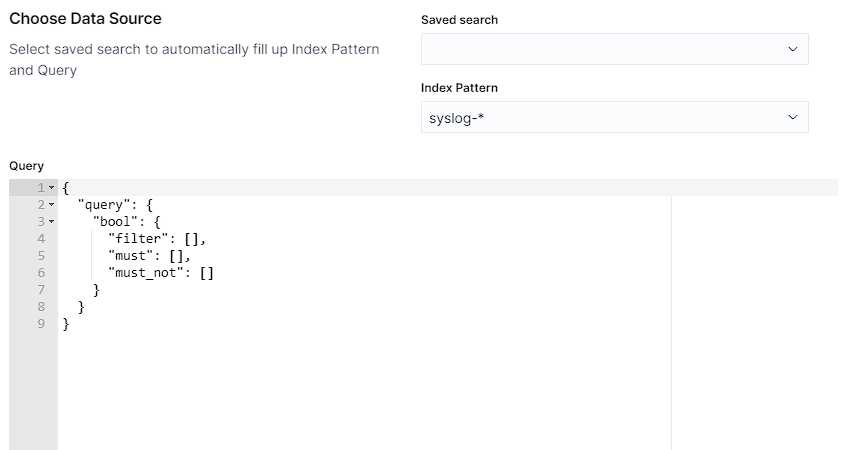
To fill in the Index Pattern and Query fields from Discover, select a saved search in the Saved search field. The use case takes over the Lucene query and the filters of the saved search. A query written in DQL, the default Discover language, is dropped without a warning, so switch the query language to Lucene before you save the search in Discover.
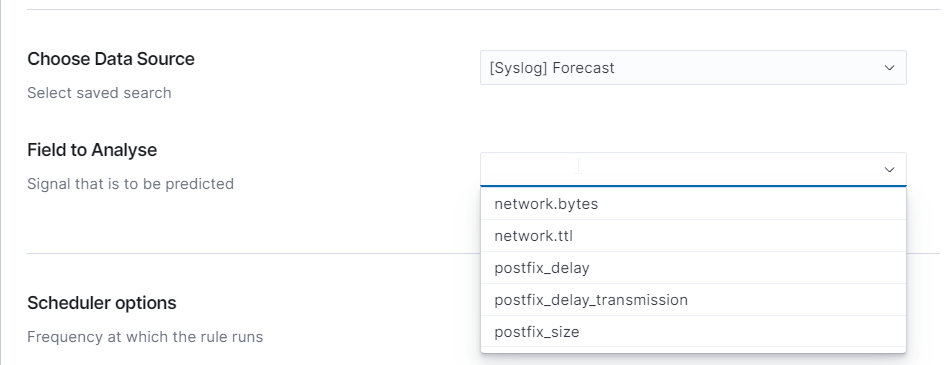
In the Field to Analyse section, select the field to analyse. The list shows the index pattern fields that match the selected method; select Show all fields to list every field. For Anomaly Detection - Number with a single value, you can select Take ‘log count’ itself as a signal to analyse to analyse the number of logs instead of a field.
Configuring the Scheduler
The use case can be run once or on a schedule:
Run Once: runs the analysis once. Provide the Build Time Frame (the historical data used to build the model, with shortcuts from 2 weeks to 4 months) and the Start Date from which the model calculates results. Actual Log Count shows the number of documents for the selected source and time period.

Scheduled: runs the analysis repeatedly. This option is experimental, which the GUI marks with a beaker icon. Choose one of the repeat modes:
Repeat until set date, every: runs every given number of hours, days, weeks, or months until the selected date,
Repeat at week day and time, every: runs on the selected day of the week at the selected time.
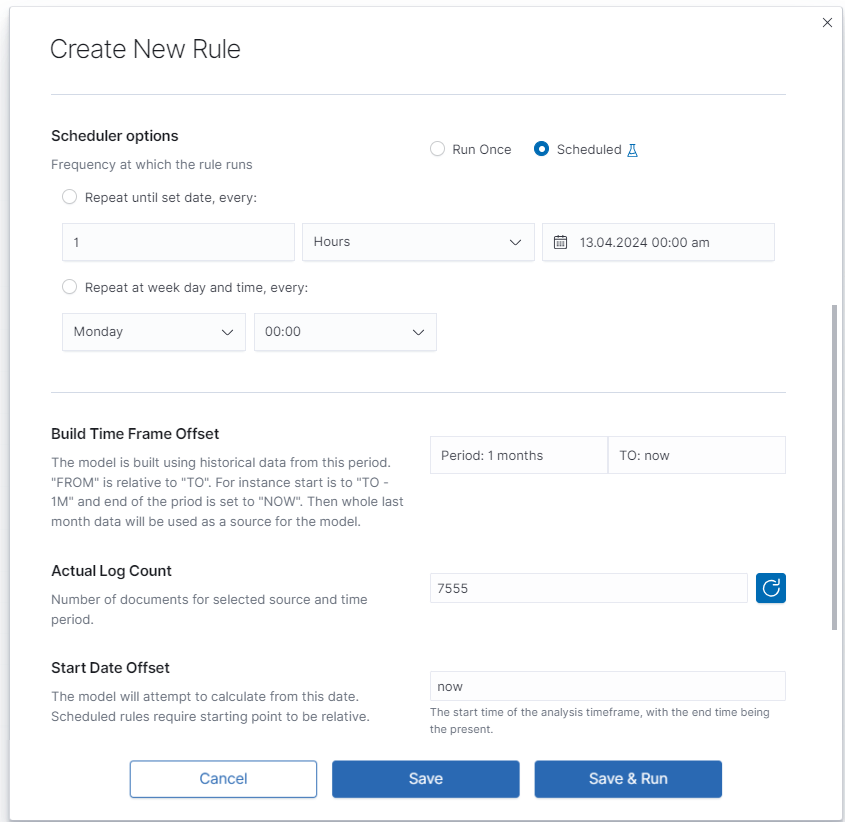
A scheduled use case also uses the Build Time Frame. Instead of a fixed start date, it takes a Start Date Offset relative to the run time, for example
now - 7 days.
The remaining fields depend on the selected method and are described in Anomaly Detection and Advanced Analytics.
Click Save to save the use case, or Save & Run to save it and start it immediately.
Accessing Performance Results
To view the results of a completed use case, click on its name in the Use Cases list. The Performance view will open, displaying the Use Case Configuration and Model Performance sections.