Advanced Analytics
Clustering
Clustering groups similar data into clusters with the k-means algorithm. Below is a guide on configuring clustering in the Empowered AI module.
Step 1: Configuring the Clustering Rule
Select Clustering in the Select Method field and select one or more fields in Field to Analyse. The method accepts fields of any type.
Number of clusters
In the Clusters field, specify the number of clusters to be created (5 by default, at least 2). This number depends on the nature of your data and the objectives of your analysis.

In AI Model, choose Build New From Scratch to train a new model or Take From Model Library to reuse a saved one.
Complete the configuration of other settings, such as Start Date, Build Time Frame, and Scheduler options. These settings are described in Create Use Case.
Step 2: Running the Rule
Click Save & Run to start the clustering immediately, or click Save and start the use case later with the play icon in the Use Cases list.
Performance Tab for Clustering
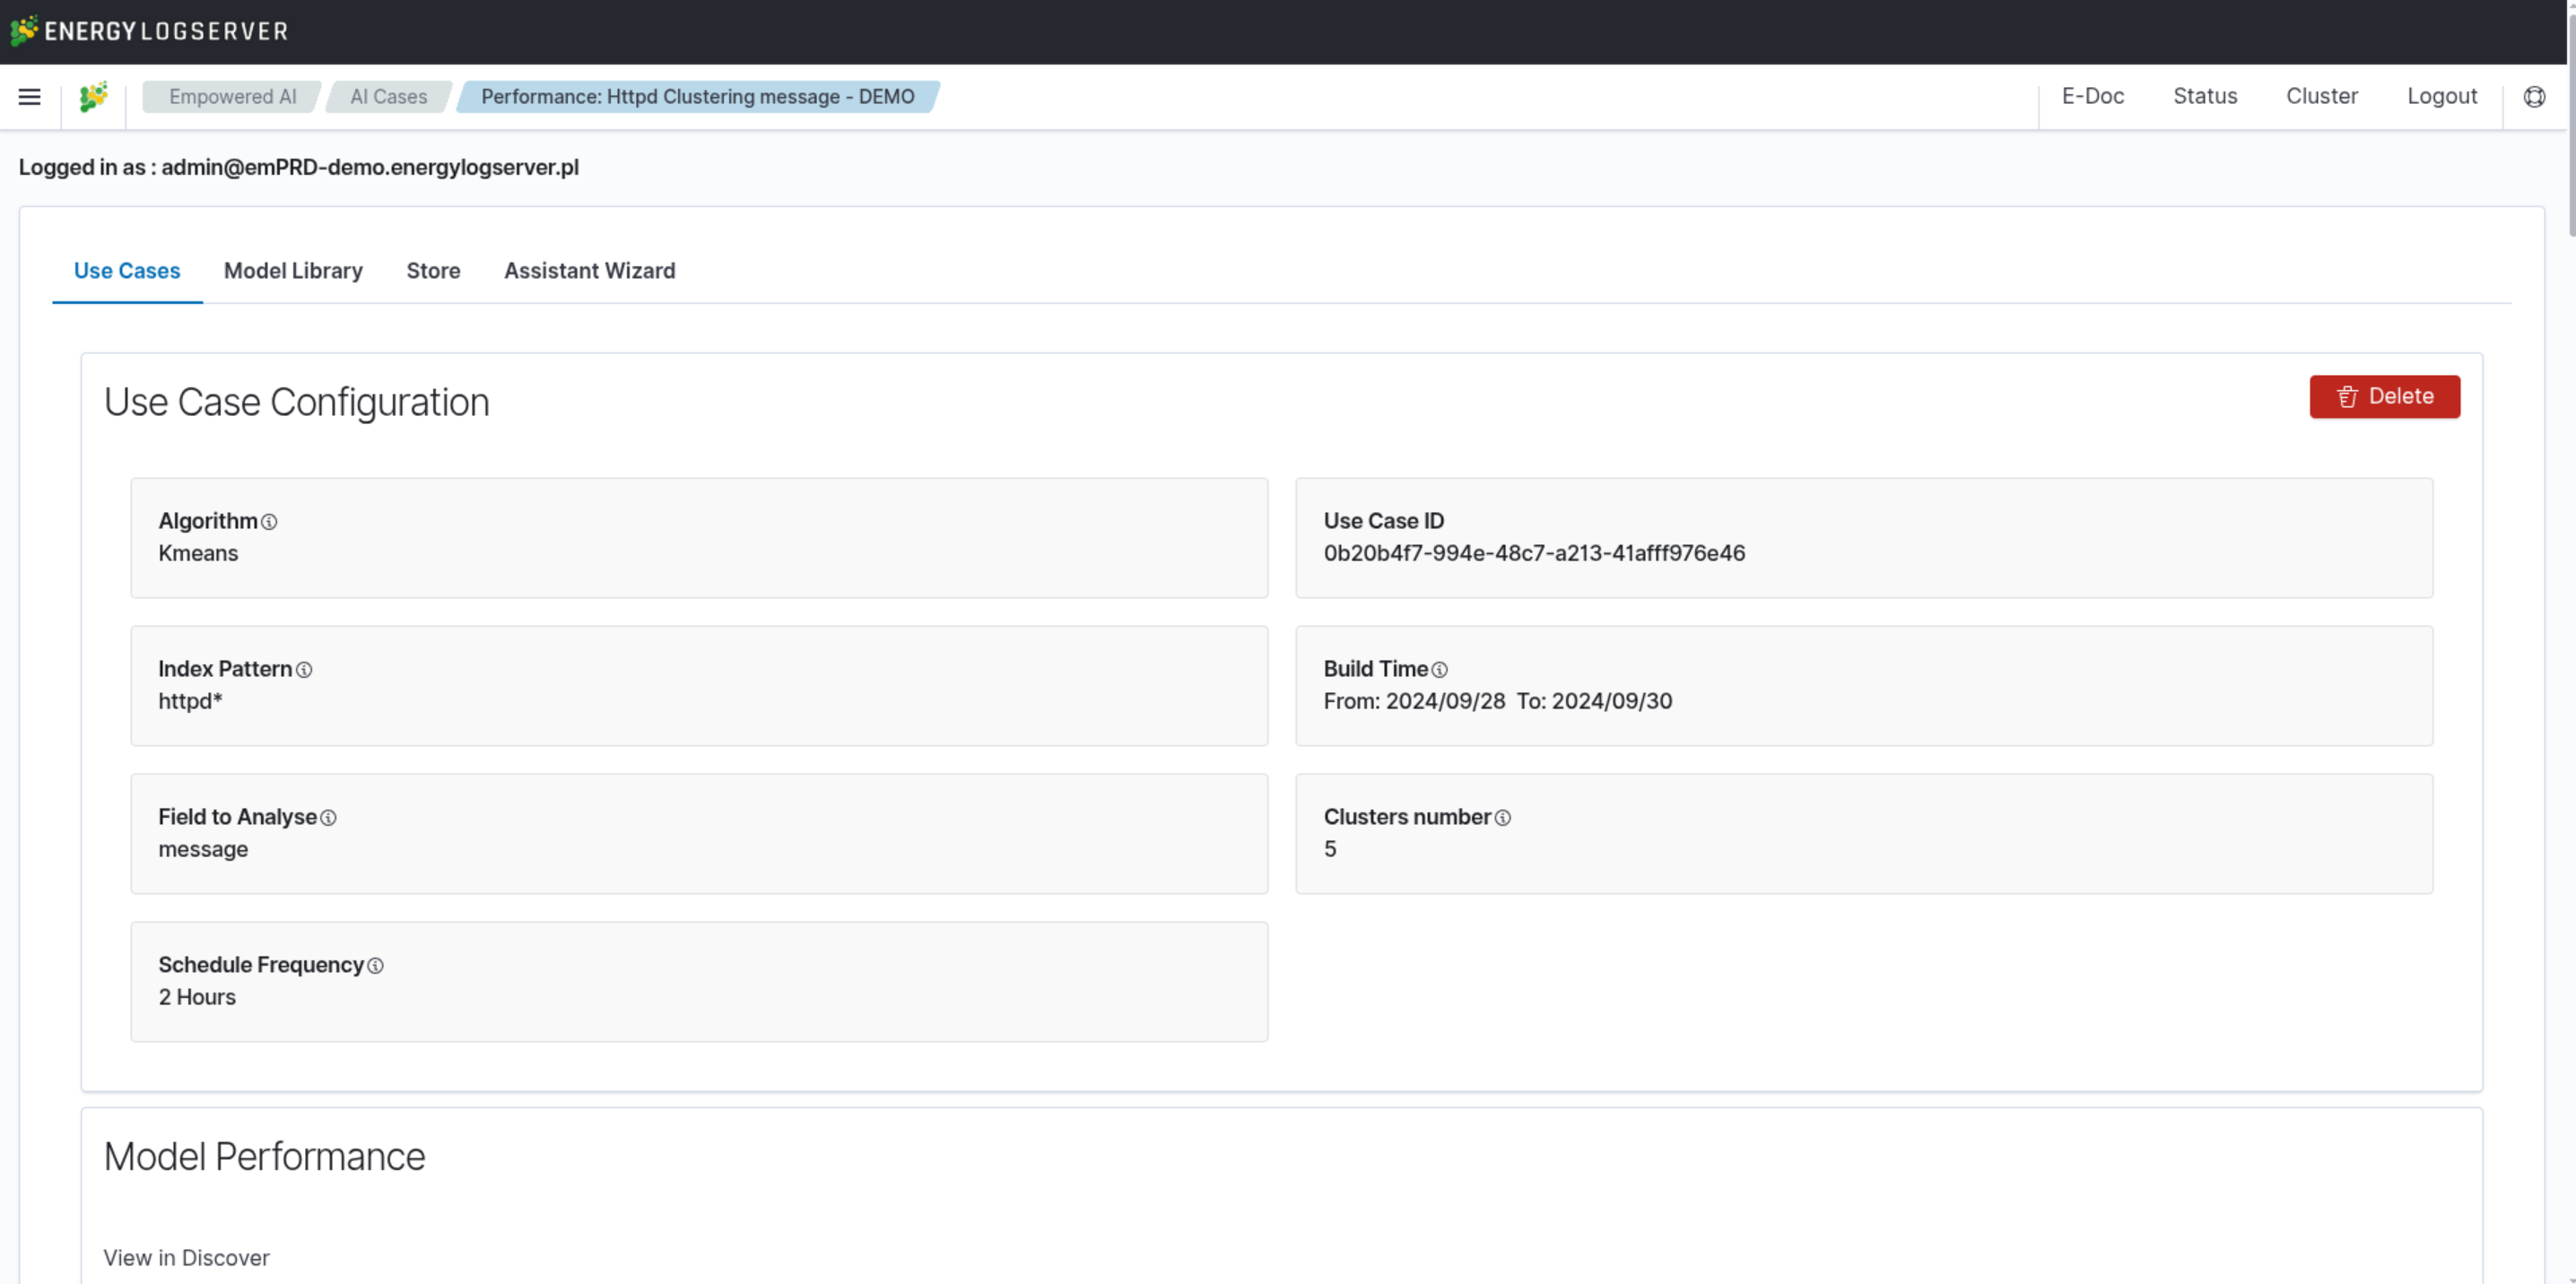
The Use Case Configuration section shows the algorithm (Kmeans), the analysed fields, and the number of clusters, together with the Run and Delete buttons.
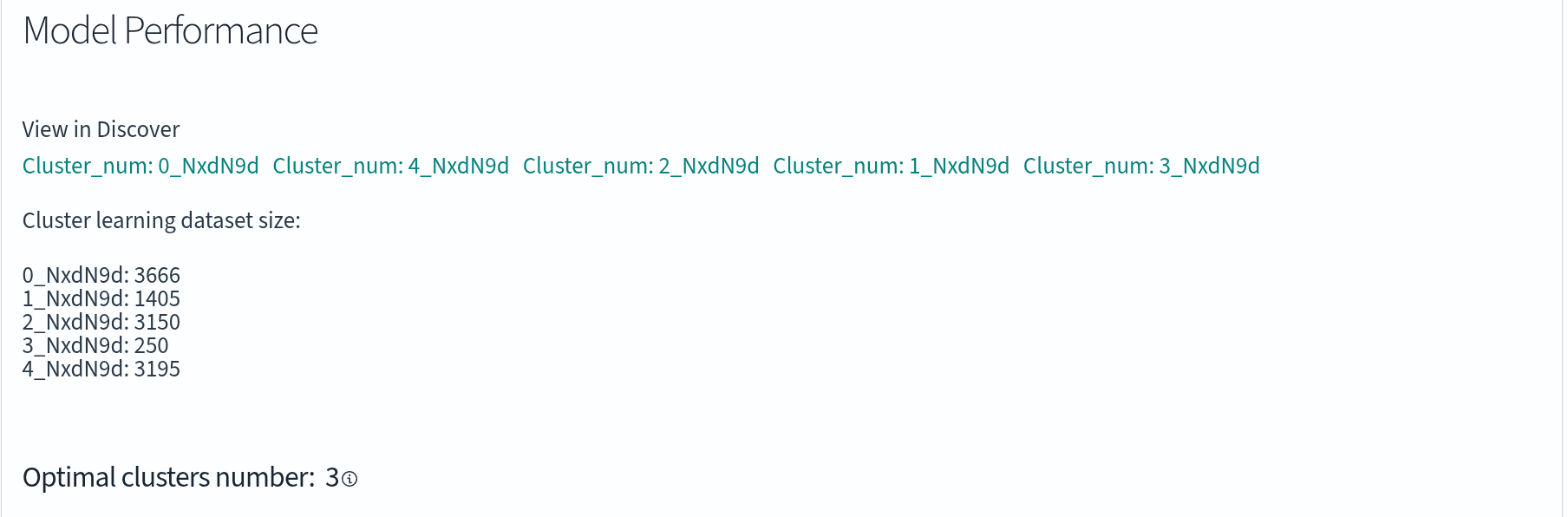
At the top of the Model Performance section:
View in Discover lists one link per cluster; each link opens the documents of that cluster in Discover.
Cluster learning dataset size shows how many documents of the learning dataset fall into each cluster.
Optimal clusters number shows the number of clusters suggested by the elbow method.
Elbow Method and Optimal Number of Clusters
The elbow method is a commonly used technique in clustering analysis to determine the optimal number of clusters. It involves plotting cluster quality against the number of clusters and identifying the point where the quality improvement slows down, forming an “elbow” shape on the graph. This point indicates the optimal number of clusters.
Cluster Quality Chart
The Cluster Quality Chart visualizes the relationship between the number of clusters and the cluster quality. The x-axis represents the number of clusters, from 2 to 9, and the y-axis represents the cluster quality score. The goal is to identify the point where adding more clusters does not significantly improve quality, which is the optimal number of clusters.
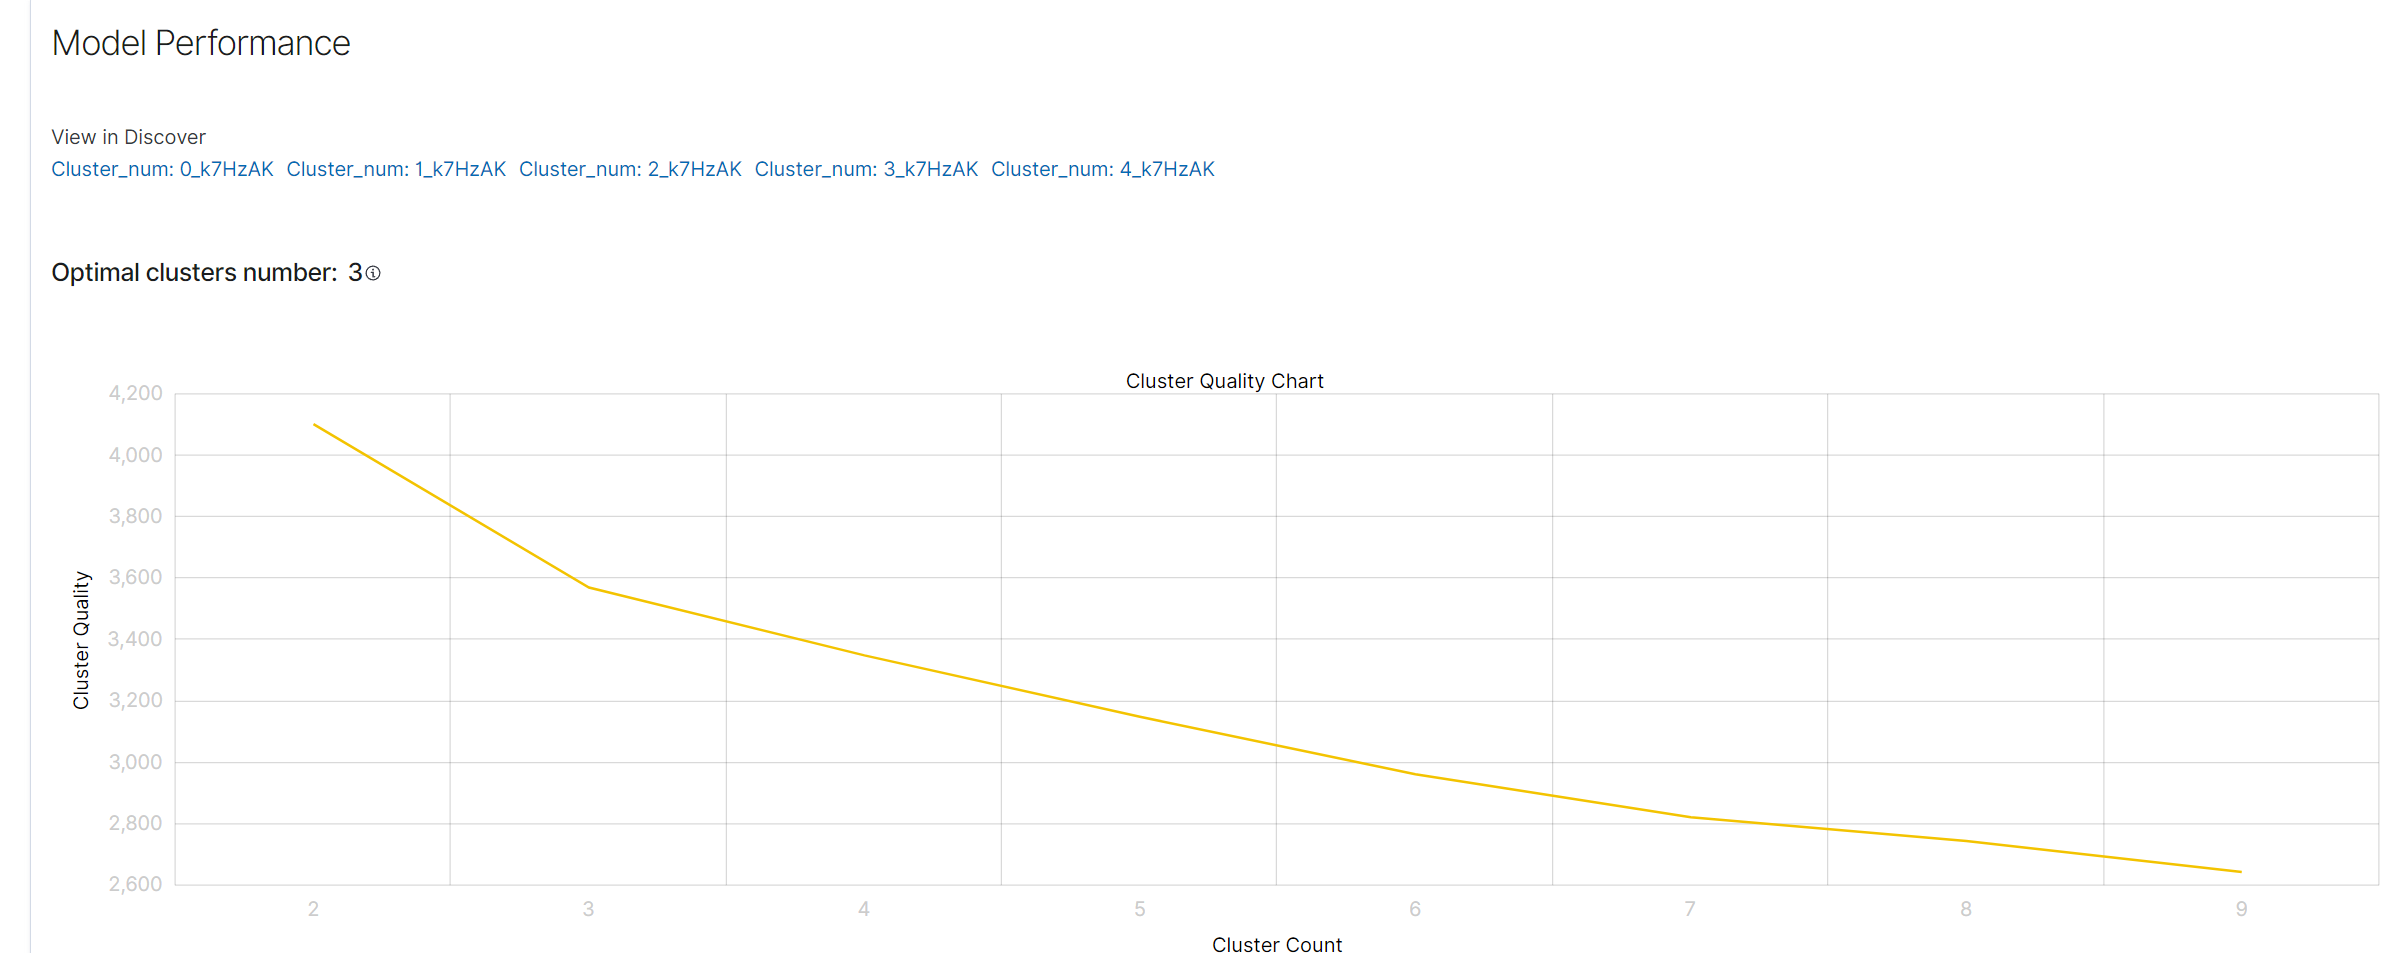
The suggested value appears above the chart as Optimal clusters number. If it differs from the number you set in Clusters, consider changing the setting and running the use case again.
Cluster Distribution Chart
Below the elbow method chart in the Performance tab, there is a cluster distribution chart. This chart shows the distribution of documents among clusters along with their centers. Each dot on the chart represents a document assigned to a specific cluster, and the cross marks the center of the cluster in the same color.
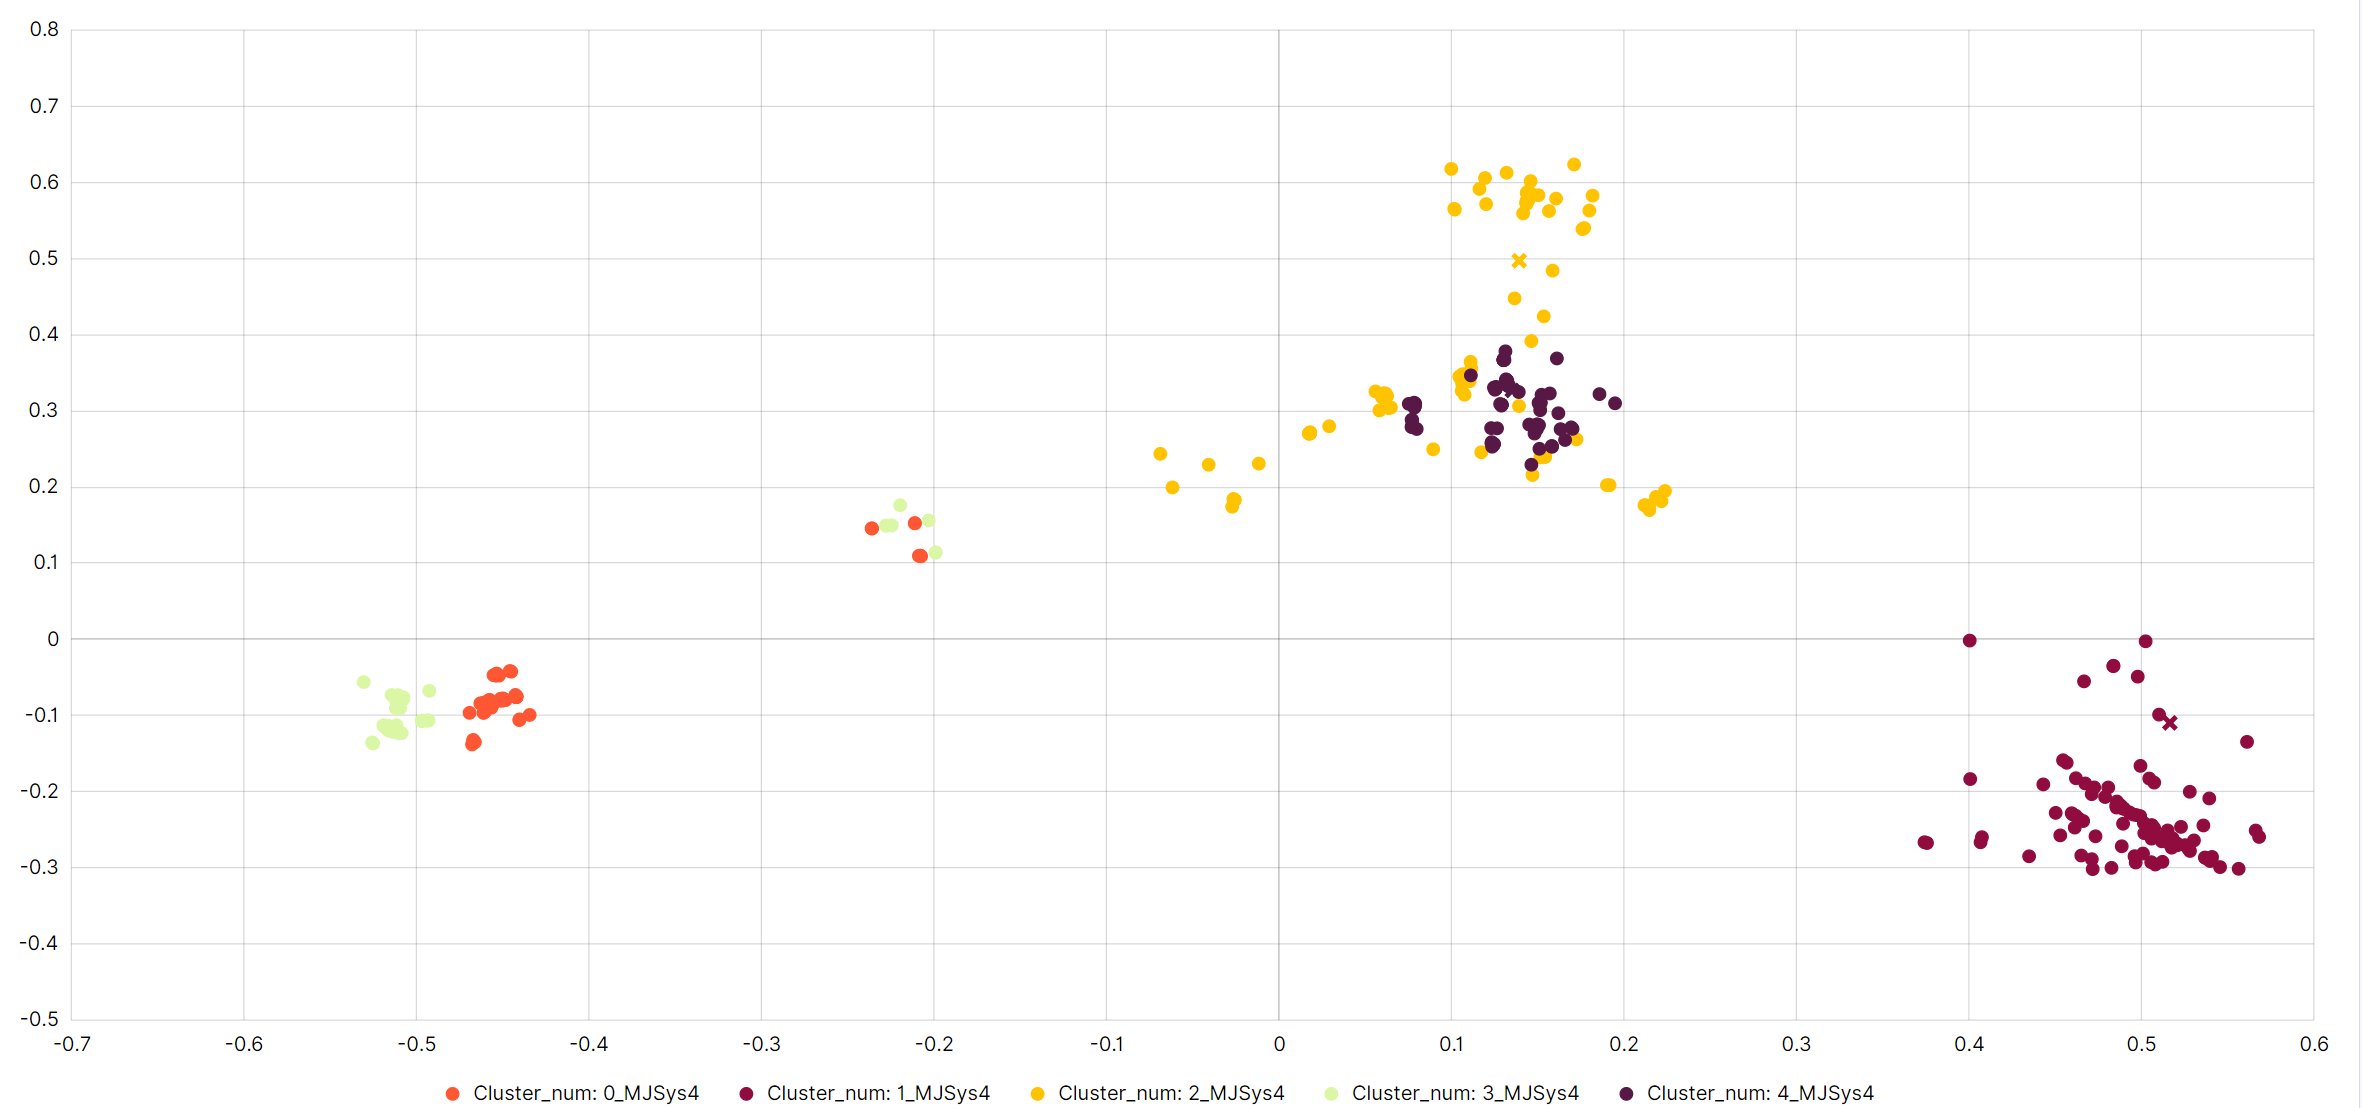
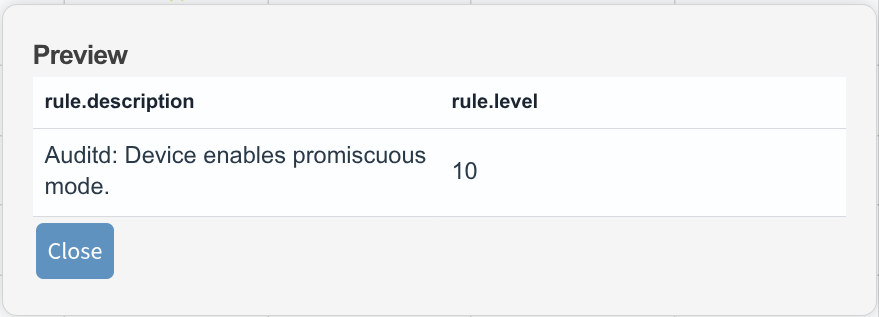
Clicking on a Dot: Clicking on any dot on the chart opens the Preview window with the values of the analysed fields in that document.
Indicative Number of Documents: The chart shows up to 100 documents per cluster, not the entire dataset. This is done to avoid overcrowding the chart and to provide better readability and data analysis.
Benefits of the Cluster Distribution Chart
The cluster distribution chart helps in:
Visualizing Document Groupings: It enables understanding how documents are grouped into clusters and their distributions.
Quick Anomaly Identification: By analyzing the document distribution, unusual groupings can be quickly identified, which may indicate anomalies.
Analyzing Cluster Centers: Cluster centers help evaluate which features are most representative of a given cluster.
Clustering Result Examples
Below the cluster distribution chart, the Clustering result examples section displays up to 10 example documents from each cluster. These documents are not a full set but a representative sample.
Understanding the Clustering Result Examples
Document Representation: Each cluster section lists example documents with the values of the analysed fields.
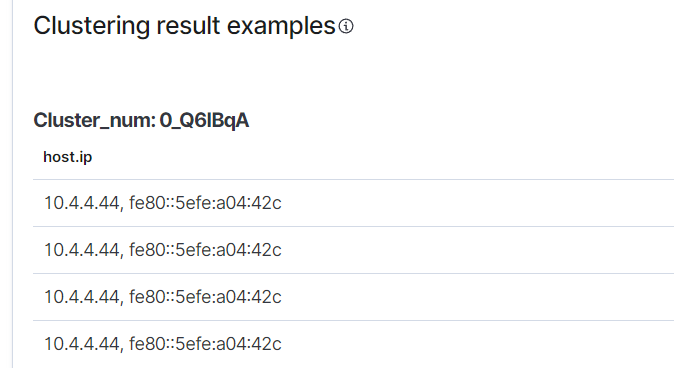
Sample Data: The documents shown are not exhaustive. Only a sample is displayed to give an idea of the type of data grouped into each cluster. This helps in understanding the nature and characteristics of the clusters without overwhelming the user with too much data.
At the bottom of the section, Save Model saves the trained model in the Model Library.
Benefits of Viewing Clustering Result Examples
The clustering result examples help in:
Validating Cluster Quality: By looking at the example documents, you can quickly assess whether the clustering algorithm has grouped the documents meaningfully.
Identifying Patterns: Seeing sample documents from each cluster allows you to identify common patterns or features within each cluster.
Quick Reference: The representative samples provide a quick reference to the kinds of documents in each cluster, aiding in faster analysis and decision-making.